. 2014 Nov 17:5:5363.
doi: 10.1038/ncomms6363.

Coccolithophore calcification response to past ocean acidification and climate change

Affiliations

Coccolithophore calcification response to past ocean acidification and climate change

Sarah A O'Dea et al. Nat Commun. .

Abstract

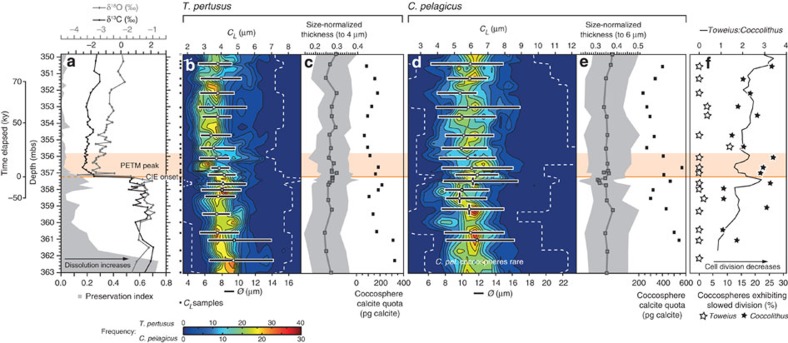
Anthropogenic carbon dioxide emissions are forcing rapid ocean chemistry changes and causing ocean acidification (OA), which is of particular significance for calcifying organisms, including planktonic coccolithophores. Detailed analysis of coccolithophore skeletons enables comparison of calcite production in modern and fossil cells in order to investigate biomineralization response of ancient coccolithophores to climate change. Here we show that the two dominant coccolithophore taxa across the Paleocene-Eocene Thermal Maximum (PETM) OA global warming event (~56 million years ago) exhibited morphological response to environmental change and both showed reduced calcification rates. However, only Coccolithus pelagicus exhibits a transient thinning of coccoliths, immediately before the PETM, that may have been OA-induced. Changing coccolith thickness may affect calcite production more significantly in the dominant modern species Emiliania huxleyi, but, overall, these PETM records indicate that the environmental factors that govern taxonomic composition and growth rate will most strongly influence coccolithophore calcification response to anthropogenic change.


Figures

Figure 1
Figure 1. Stable isotope, coccolith preservation and morphometric records at Bass River, New Jersey.
(a) Bulk carbon (black squares) and bulk oxygen isotopes (grey diamonds; data from John et al.21) with a quantitative nannofossil preservation index (data from Gibbs et al.; grey shading). Time from the initial carbon isotope excursion (CIE) is indicated (kyrs; following John et al.21), as are depths from which coccolith length (CL) measurements were collected (black squares). (b,d) Frequency data for coccolith lengths (CL; totalling 3,200 and 3,050 measurements for T. pertusus and C. pelagicus, respectively) are interpolated to equal depth steps of 10 cm, with minimum and maximum size-bins (dashed line). Mean coccosphere diameters (Ø; white squares) with 5th and 95th percentiles of each population (horizontal black bars) and the sampling interval (vertical black bars) are shown, calculated from a total of 507 and 375 coccospheres for Toweius and Coccolithus, respectively. (c,e) Mean coccolith size-normalized thickness for T. pertusus and C. pelagicus (dark grey squares), with the 5th and 95th percentiles of each sample (grey shading). Uncertainty on mean size-normalized thickness is calculated as two s.d.s across the bootstrap results at the length to which thickness is being normalized and does not exceed ±0.008 μm. Mean coccosphere calcite quotas are shown (black squares). (f) The percentage of each population that exhibits coccosphere geometry typical of slowed cell division (early stationary growth phase, see ref. ; open stars for T. pertusus and closed stars for C. pelagicus) and the ratio of T. pertusus to C. pelagicus coccoliths (black line). The onset of the CIE (orange line) and interval of peak warmth during the PETM (orange shading) are indicated (following John et al.21).
Figure 2
Figure 2. Scanning electron micrographs of C. pelagicus at Bass River, New Jersey.
Sample depths are 351.95, 349.82 and 357.38 mbs as indicated. The minimum in size-normalized thickness of C. pelagicus occurs between 357.38 and 357.36 mbs. Individual scale bars indicate 1 μm.
Figure 3
Figure 3. Estimating calcification rate for fossil coccolithophore species.
Calcification rates (curved red lines) are derived by multiplying the amount of calcite produced per cell by the number of cell divisions per day. Mean (large circles) and the 5th and 95th percentiles (vertical lines) of coccosphere calcite quotas are shown (Toweius in white and yellow for pre- and post-CIE onset populations, respectively; Coccolithus in black). Populations exhibiting exponential phase coccosphere geometry (normal rates of cell division) are plotted between 0.5 and 1.0 divisions per day and likely vary within this range. Coccolithus populations that are exhibiting early stationary phase coccosphere geometry (slowed division; characterized by a high proportion of CN≥16) across the onset and peak of the PETM are plotted between 0 and 0.2 divisions per day. Small circles indicate intersections between calcification rates and either the measured percentile range of coccosphere calcite quotas (on vertical lines) or the inferred range of divisions per day (on horizontal lines).
Figure 4
Figure 4. Species morphotypes at New Jersey, California and Tanzania.
(a,b) Coccolith length (CL) and thickness (CT) measurements for size-defined morphotypes of T. pertusus and C. pelagicus, identified using mixture analyses. Frequency distributions of CL (c,d) and size-normalized thickness (e,f) of each size-defined morphotype. For T. pertusus ‘small’ is <2.9 μm, ‘medium’ is >2.9 to <4.7 μm and ‘large’ is >4.7 μm, whereas for C. pelagicus, ‘small’ is <7.7 μm, ‘medium’ is >7.7 to <9.9 μm and ‘large’ is >9.9 μm.

References

    1. Feely R. A. et al. Impact of anthropogenic CO2 on the CaCO3 system in the oceans. Science 305, 362–366 (2004). - PubMed
    1. Doney S. C. et al. Ocean acidification: the other CO2 problem. Annu. Rev. Marine Sci. 1, 169–192 (2009). - PubMed
    1. Fabry V. J. Marine calcifiers in a high-CO2 ocean. Science 320, 1020–1022 (2008). - PubMed
    1. Ridgwell A. et al. From laboratory manipulations to Earth system models: scaling calcification impacts of ocean acidification. Biogeosciences 6, 2611–2623 (2009).
    1. Riebesell U & Tortell P.D. inOcean Acidification (eds Gattuso J. P., Hansson L. 99–121Oxford Univ. Press (2011).

Publication types