. 2014 Nov 17:5:5475.
doi: 10.1038/ncomms6475.

Localized light-induced protein dimerization in living cells using a photocaged dimerizer

Affiliations

Localized light-induced protein dimerization in living cells using a photocaged dimerizer

Edward R Ballister et al. Nat Commun. .

Abstract

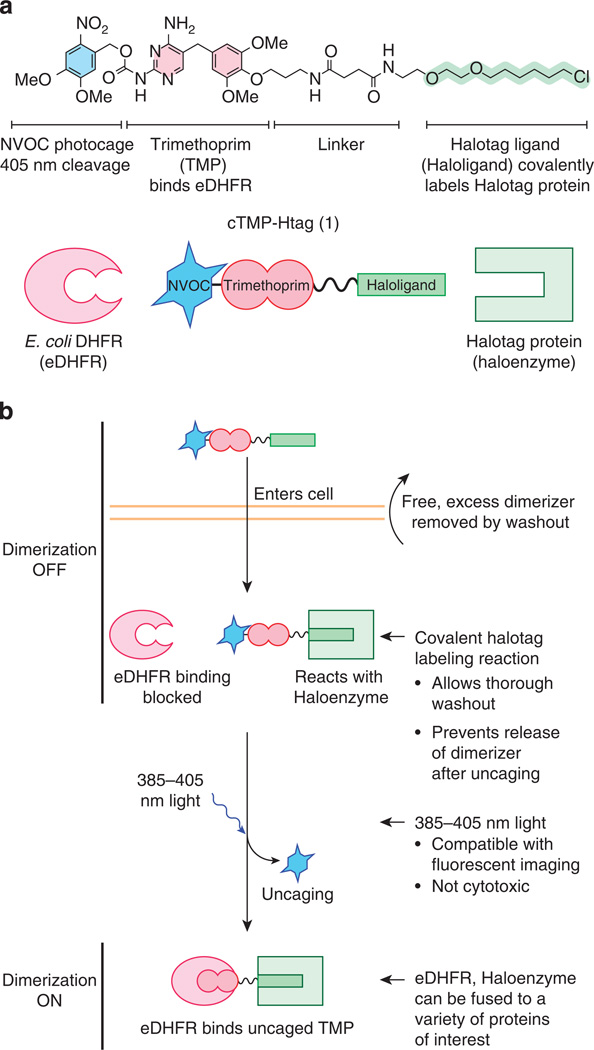
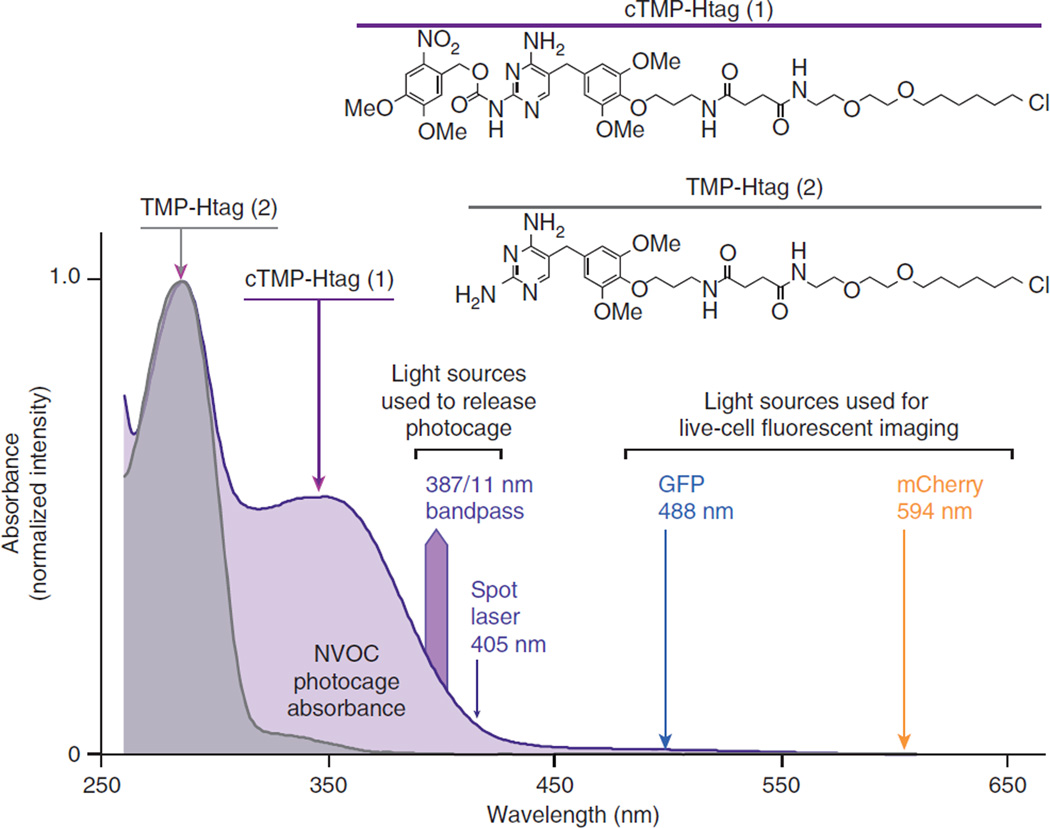
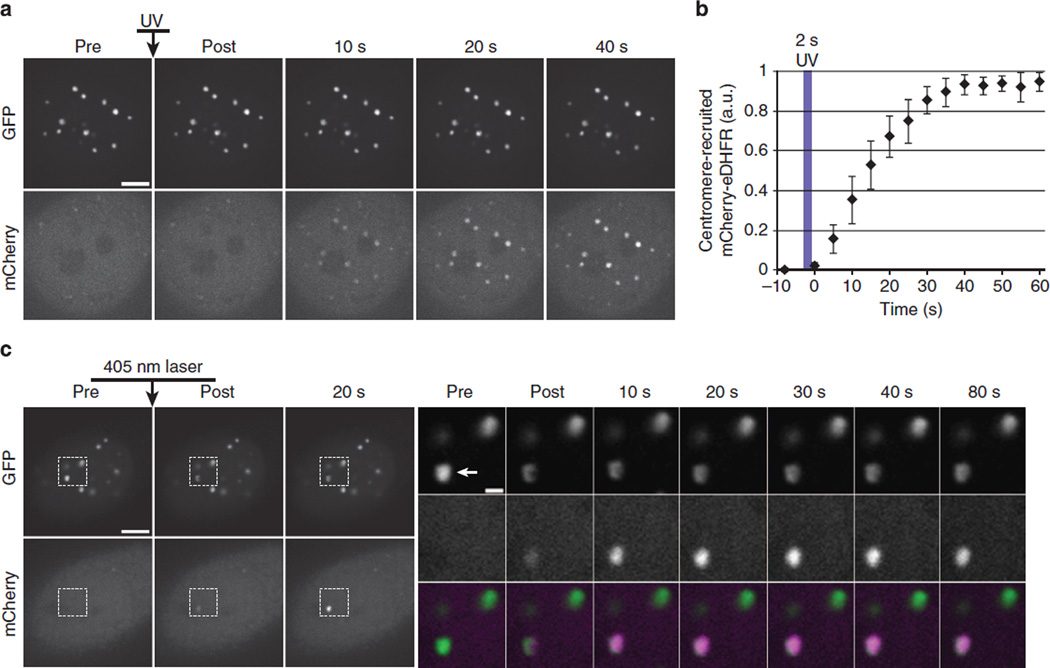
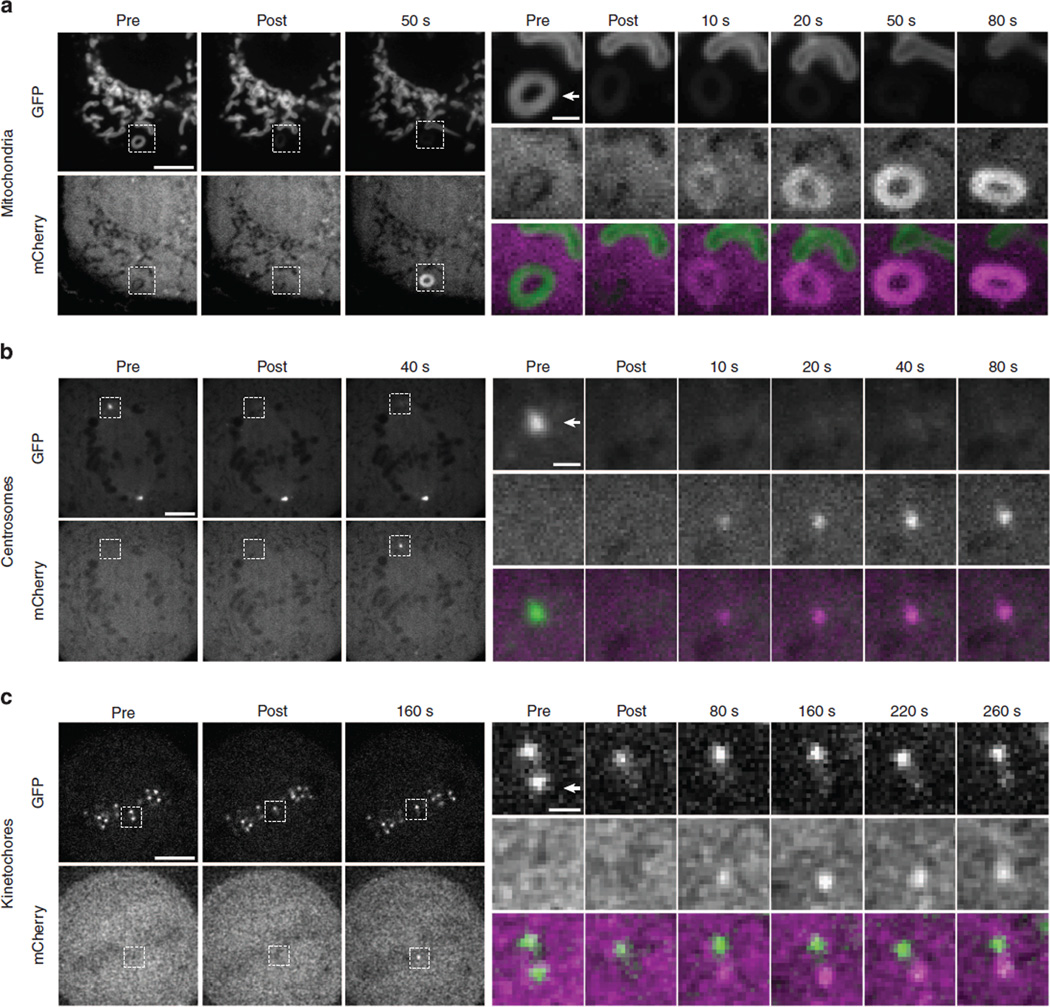
Regulated protein localization is critical for many cellular processes. Several techniques have been developed for experimental control over protein localization, including chemically induced and light-induced dimerization, which both provide temporal control. Light-induced dimerization offers the distinct advantage of spatial precision within subcellular length scales. A number of elegant systems have been reported that utilize natural light-sensitive proteins to induce dimerization via direct protein-protein binding interactions, but the application of these systems at cellular locations beyond the plasma membrane has been limited. Here we present a new technique to rapidly and reversibly control protein localization in living cells with subcellular spatial resolution using a cell-permeable, photoactivatable chemical inducer of dimerization. We demonstrate light-induced recruitment of a cytosolic protein to individual centromeres, kinetochores, mitochondria and centrosomes in human cells, indicating that our system is widely applicable to many cellular locations.


Figures

Figure 1
Figure 1. Design of photocaged dimerizer cTMP-Htag
(a) Chemical structure and schematic diagrams of cTMP-Htag 1 and its two receptors: E. coli DHFR (eDHFR) and the Halotag protein (Haloenzyme). (b) Schematic of light-induced protein dimerization in living cells via cTMP-Htag. The cell-permeable photocaged dimerizer enters cells and irreversibly reacts with the Haloenzyme. Any unreacted dimerizer is removed by washout. The photocage prevents binding with eDHFR before illumination, and is removed by irradiation with ~385–405nm light, allowing eDHFR to bind the uncaged TMP group, thus dimerizing eDHFR and Haloenzyme.
Figure 2
Figure 2
Ultraviolet (UV)–visible absorbance spectra of dimerizers. Chemical structures and normalized UV–visible spectra (260–600 nm) of cTMP-Htag (1, in 90% phosphate-buffered saline (PBS) pH 7.4/10% dimethyl sulphoxide) and the non-caged analogue TMP-Htag (2, in 75% PBS pH 7.4/25% DMSO). Light sources used for uncaging (387/11, 405 nm) or for imaging (488, 594 nm) are indicated.
Figure 3
Figure 3. cTMP-Htag enters living cells
The extent of cTMP-Htag reaction with CENPB-Haloenzyme as a function of cTMP-Htag concentration or treatment time was measured using a dye-blocking assay. Cells expressing CENPB-Haloenzyme (without GFP) were incubated with cTMP-Htag, washed, treated with 100nM Halotag-Oregon Green (Halo-OreGrn) for 20min, then washed again before imaging. Decreased Halo-OreGrn indicates cTMP-Htag occupancy of CENPB-Haloenzyme sites. Each Halo-OreGrn image is displayed at two brightness levels to aid visualization. Within each row, all the images are displayed using identical brightness levels. (a,b) Cells were treated with 1, 5, 10 or 20 mM cTMP-Htag for 1 h, then treated with Halo-OreGrn as described above. Treatment with 10 µM cTMP-Htag for 1 h is sufficient to block ~90% of Halo-OreGrn binding. (c,d) Cells were treated with 20 µM cTMP-Htag for 15, 30 or 60min, or left untreated as control, then treated with Halo-OreGrn as described above. Treatment with 20 µM cTMP-Htag for 30min is sufficient to block ~90% of Halo-OreGrn binding. Images (a,c) are maximum-intensity projections of representative cells from each condition. Average Halo-OreGrn intensity at centromeres was quantified for each condition (b,d). Error bars represent s.d. (n≥15 fields for each data point, multiple cells per field). a.u., arbitrary unit.
Figure 4
Figure 4. Light-induced dimerization at centromeres
Cells expressing CENPB–GFP-Haloenzyme and mCherry–eDHFR were treated with 20µM cTMP-Htag for 1h, then washed before imaging. (a) Cell-wide recruitment of mCherry–eDHFR to centromere-localized CENPB–GFP–Haloenzyme in response to a 2-s pulse of 387(±5.5)nm light. (b) Average mCherry–eDHFR centromere intensity at time points before and after uncaging, error bars represent s.d. (n=10 cells). (c) A single centromere (indicated by arrowhead in inset) was irradiated with a 405nm laser to induce mCherry–eDHFR recruitment. Insets show boxed regions in GFP (top row) and mCherry (middle row) and colour-merge (bottom row) from indicated time points. Scale bars, 5 or 1mm in insets. a.u., arbitrary unit.
Figure 5
Figure 5. Dimerization reversal by addition of free TMP
Cells were expressing CENPB–GFP-Haloenzyme and mCherry–eDHFR. (a,b) Cells were treated with 20 µM cTMP-Htag for 1 h, then washed before imaging. Eleven fields of interphase cells were sequentially activated with a 2 s pulse of ultraviolet (UV) light, then imaged every 10 s for 60 s. Eight minutes after the 11th field was photoactivated, all the fields were imaged again, then TMP was added to a final concentration of 100 µM. Each field was imaged every minute for 10min. Image acquisition and stage movement took ~4.5s for each field. Selected images from the 11th field (a). mCherry intensity at centromeres was quantified (b). For the photoactivation phase of the experiment, centromere intensity levels were normalized for each field, then averaged over all the fields for each time point. This average, as well as the normalized values for the 11th field are plotted. For the TMP-addition phase of the experiment, measurements for each field at each time point are plotted. mCherry intensity was normalized for each field, then averaged across all the fields for each 1-min image acquisition cycle. Averages are plotted as a function of the average image acquisition time during each cycle (for instance, ~24 s after the addition of TMP for the first cycle). Measurements of field 11 corresponding to the images displayed in a are marked with an asterisk (*). Error bars represent s.d. (c) Cells were treated with 1 µM TMP-Htag for 30 min, then washed and imaged ~2 h later. TMP was added to a final concentration of 100 µM, resulting in the loss of dimerization within 8min. TMP was removed by washout, resulting in the recovery of dimerization within 20 min. Scale bars, 5 µm.
Figure 6
Figure 6. Dimerization at individual mitochondria, centrosomes and kinetochores
Cells expressing mCherry–eDHFR and Haloenzyme–GFP-anchor domain fusion proteins specific for (a) mitochondria (ActA), (b) centrosomes (AKAP9) or (c) kinetochores (Nuf2) were incubated with 20 µM cTMP-Htag for 1 h, then washed before imaging. Cells were imaged before and after targeted laser illumination, as indicated. Individual structures in these cells (indicated by arrowheads in insets) were targeted with a 10–100ms pulse from a 405nm laser immediately before the ‘post’ image. Insets show boxed regions in GFP (top row) and mCherry (middle row) and colour-merge (bottom row) from indicated time points. GFP is locally photobleached by the 405 nm uncaging pulse. Gaussian smoothing with a radius of 1 pixel was applied to mCherry images in c. Scale bars, 5 or 1 µm in insets.

References

    1. Gautier A, et al. How to control proteins with light in living systems. Nat. Chem. Biol. 2014;10:533–541. - PubMed
    1. Fegan A, White B, Carlson JCT, Wagner CR. Chemically controlled protein assembly: techniques and applications. Chem. Rev. 2010;110:3315–3336. - PubMed
    1. Putyrski M, Schultz C. Protein translocation as a tool: the current rapamycin story. FEBS Lett. 2012;586:2097–2105. - PubMed
    1. DeRose R, Miyamoto T, Inoue T. Manipulating signaling at will: chemically-inducible dimerization (CID) techniques resolve problems in cell biology. Pflugers Arch. 2013;465:409–417. - PMC - PubMed
    1. Levskaya A, Weiner OD, Lim WA, Voigt CA. Spatiotemporal control of cell signalling using a light-switchable protein interaction. Nature. 2009;461:997–1001. - PMC - PubMed

Publication types