

COFFDROP: A Coarse-Grained Nonbonded Force Field for Proteins Derived from All-Atom Explicit-Solvent Molecular Dynamics Simulations of Amino Acids
- PMID: 25400526
- PMCID: PMC4230375
- DOI: 10.1021/ct5006328
COFFDROP: A Coarse-Grained Nonbonded Force Field for Proteins Derived from All-Atom Explicit-Solvent Molecular Dynamics Simulations of Amino Acids
Abstract
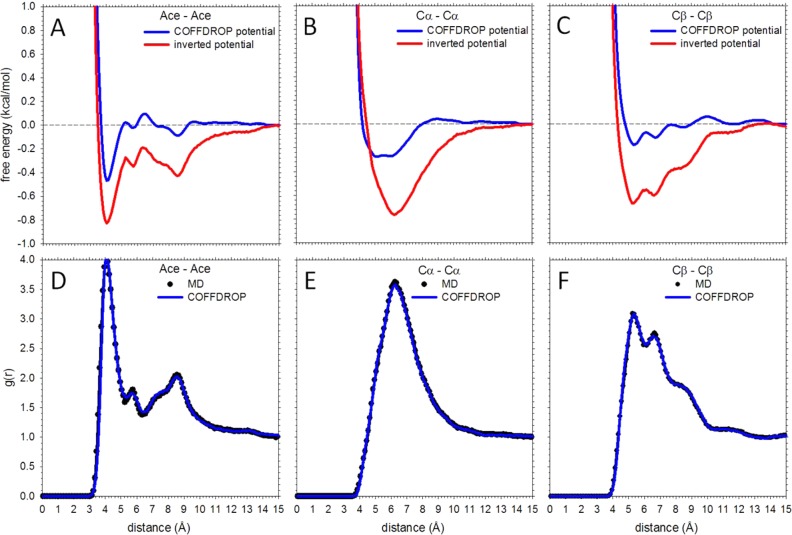
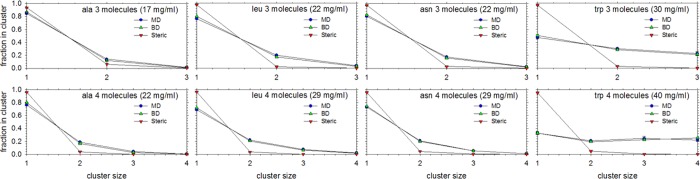
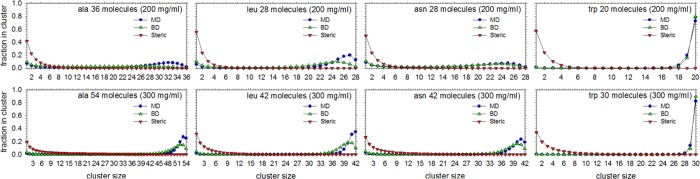
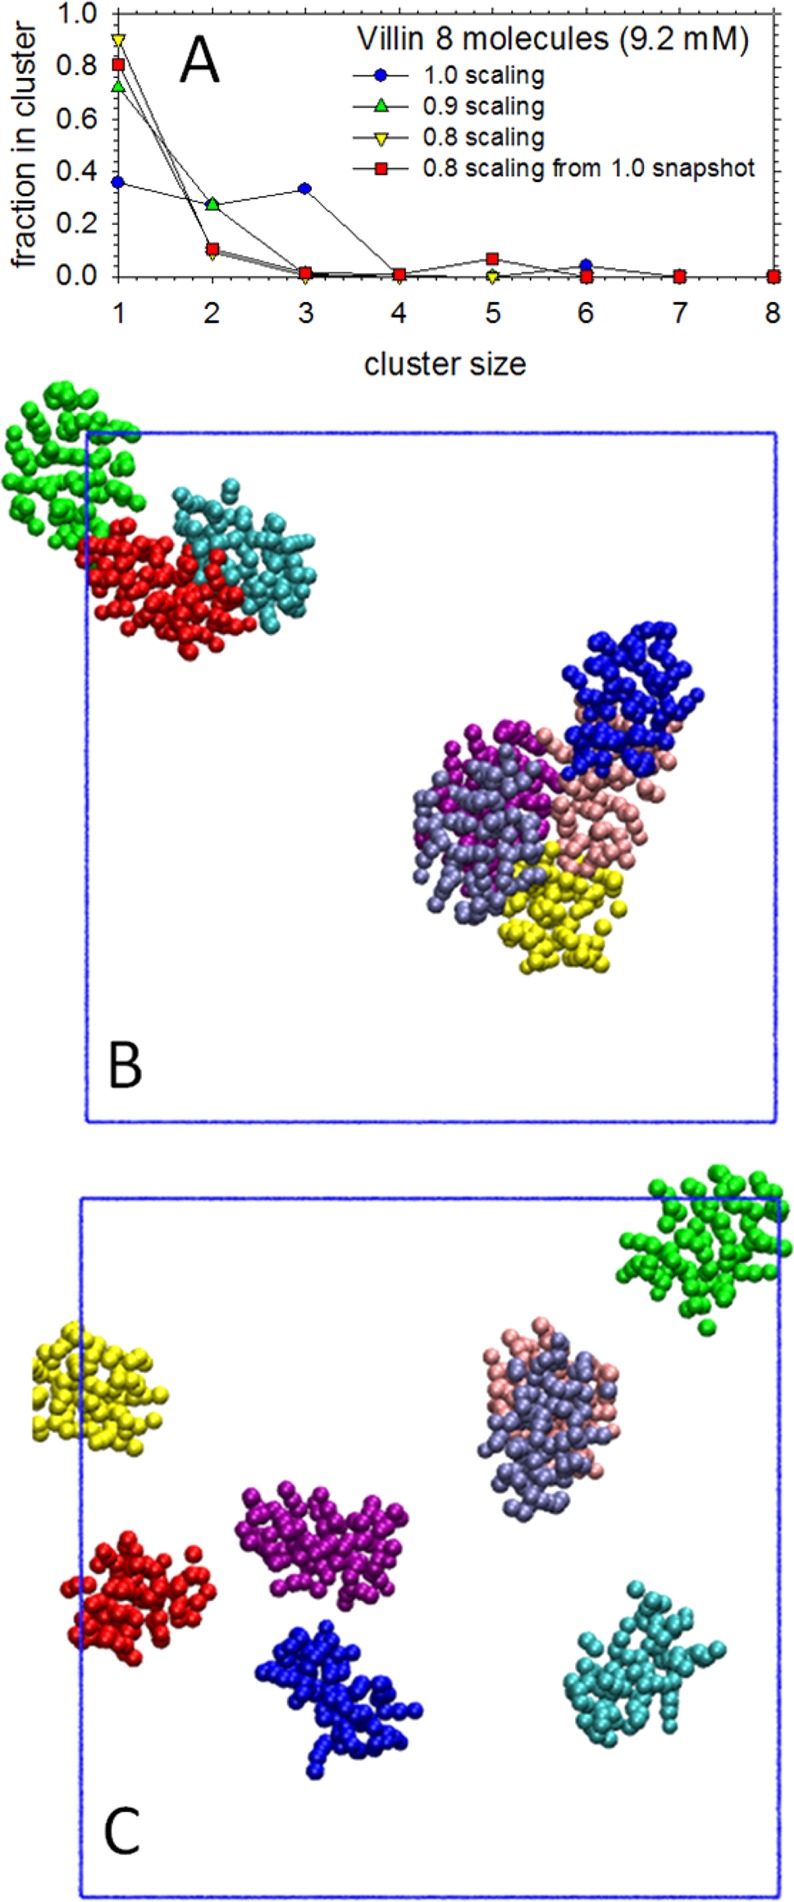
We describe the derivation of a set of bonded and nonbonded coarse-grained (CG) potential functions for use in implicit-solvent Brownian dynamics (BD) simulations of proteins derived from all-atom explicit-solvent molecular dynamics (MD) simulations of amino acids. Bonded potential functions were derived from 1 μs MD simulations of each of the 20 canonical amino acids, with histidine modeled in both its protonated and neutral forms; nonbonded potential functions were derived from 1 μs MD simulations of every possible pairing of the amino acids (231 different systems). The angle and dihedral probability distributions and radial distribution functions sampled during MD were used to optimize a set of CG potential functions through use of the iterative Boltzmann inversion (IBI) method. The optimized set of potential functions-which we term COFFDROP (COarse-grained Force Field for Dynamic Representation Of Proteins)-quantitatively reproduced all of the "target" MD distributions. In a first test of the force field, it was used to predict the clustering behavior of concentrated amino acid solutions; the predictions were directly compared with the results of corresponding all-atom explicit-solvent MD simulations and found to be in excellent agreement. In a second test, BD simulations of the small protein villin headpiece were carried out at concentrations that have recently been studied in all-atom explicit-solvent MD simulations by Petrov and Zagrovic (PLoS Comput. Biol.2014, 5, e1003638). The anomalously strong intermolecular interactions seen in the MD study were reproduced in the COFFDROP simulations; a simple scaling of COFFDROP's nonbonded parameters, however, produced results in better accordance with experiment. Overall, our results suggest that potential functions derived from simulations of pairwise amino acid interactions might be of quite broad applicability, with COFFDROP likely to be especially useful for modeling unfolded or intrinsically disordered proteins.
Figures
Similar articles
-
Parametrization of Backbone Flexibility in a Coarse-Grained Force Field for Proteins (COFFDROP) Derived from All-Atom Explicit-Solvent Molecular Dynamics Simulations of All Possible Two-Residue Peptides.J Chem Theory Comput. 2015 May 12;11(5):2341-54. doi: 10.1021/acs.jctc.5b00038. Epub 2015 Apr 30. J Chem Theory Comput. 2015. PMID: 26574429 Free PMC article.
-
Self-assembling dipeptides: conformational sampling in solvent-free coarse-grained simulation.Phys Chem Chem Phys. 2009 Mar 28;11(12):2077-86. doi: 10.1039/b818144f. Epub 2009 Feb 2. Phys Chem Chem Phys. 2009. PMID: 19280018
-
A coarse-grained model for polyethylene glycol polymer.J Chem Phys. 2011 Dec 7;135(21):214903. doi: 10.1063/1.3664623. J Chem Phys. 2011. PMID: 22149813
-
Multiscale molecular dynamics simulations of rotary motor proteins.Biophys Rev. 2018 Apr;10(2):605-615. doi: 10.1007/s12551-017-0373-4. Epub 2017 Dec 4. Biophys Rev. 2018. PMID: 29204882 Free PMC article. Review.
-
Molecular dynamic simulations of environment and sequence dependent DNA conformations: the development of the BMS nucleic acid force field and comparison with experimental results.J Biomol Struct Dyn. 1998 Dec;16(3):487-509. doi: 10.1080/07391102.1998.10508265. J Biomol Struct Dyn. 1998. PMID: 10052609 Review.
Cited by
-
Molecular Dynamics Simulations of 441 Two-Residue Peptides in Aqueous Solution: Conformational Preferences and Neighboring Residue Effects with the Amber ff99SB-ildn-NMR Force Field.J Chem Theory Comput. 2015 Mar 10;11(3):1315-29. doi: 10.1021/ct5010966. J Chem Theory Comput. 2015. PMID: 26579777 Free PMC article.
-
Tabulation as a high-resolution alternative to coarse-graining protein interactions: Initial application to virus capsid subunits.J Chem Phys. 2015 Dec 28;143(24):243159. doi: 10.1063/1.4938479. J Chem Phys. 2015. PMID: 26723644 Free PMC article.
-
Comparative Performance of Computer Simulation Models of Intrinsically Disordered Proteins at Different Levels of Coarse-Graining.J Chem Inf Model. 2023 Jul 10;63(13):4079-4087. doi: 10.1021/acs.jcim.3c00113. Epub 2023 Jun 20. J Chem Inf Model. 2023. PMID: 37339604 Free PMC article.
-
Inverse Boltzmann Iterative Multi-Scale Molecular Dynamics Study between Carbon Nanotubes and Amino Acids.Molecules. 2022 Apr 27;27(9):2785. doi: 10.3390/molecules27092785. Molecules. 2022. PMID: 35566140 Free PMC article.
-
Investigating Intrinsically Disordered Proteins With Brownian Dynamics.Front Mol Biosci. 2022 Jun 8;9:898838. doi: 10.3389/fmolb.2022.898838. eCollection 2022. Front Mol Biosci. 2022. PMID: 35755809 Free PMC article.
References
-
- Shaw D. E.; Maragakis P.; Lindorff-Larsen K.; Piana S.; Dror R. O.; Eastwood M. P.; Bank J. A.; Jumper J. M.; Salmon J. K.; Shan Y.; Wriggers W. Atomic-level characterization of the structural dynamics of proteins. Science 2010, 330, 341–346. - PubMed
-
- Tozzini V. Coarse-grained models for proteins. Curr. Opin. Struct. Biol. 2005, 15, 144–150. - PubMed
-
- Ayton G. S.; Noid W. G.; Voth G. A. Multiscale modeling of biomolecular systems: In serial and in parallel. Curr. Opin. Struct. Biol. 2007, 17, 192–198. - PubMed
-
- Clementi C. Coarse-grained models of protein folding: Toy models or predictive tools?. Curr. Opin. Struct. Biol. 2008, 18, 10–15. - PubMed
Grants and funding
LinkOut - more resources
Full Text Sources
Other Literature Sources