

Why do I hear but not understand? Stochastic undersampling as a model of degraded neural encoding of speech
- PMID: 25400543
- PMCID: PMC4214224
- DOI: 10.3389/fnins.2014.00348
Why do I hear but not understand? Stochastic undersampling as a model of degraded neural encoding of speech
Abstract
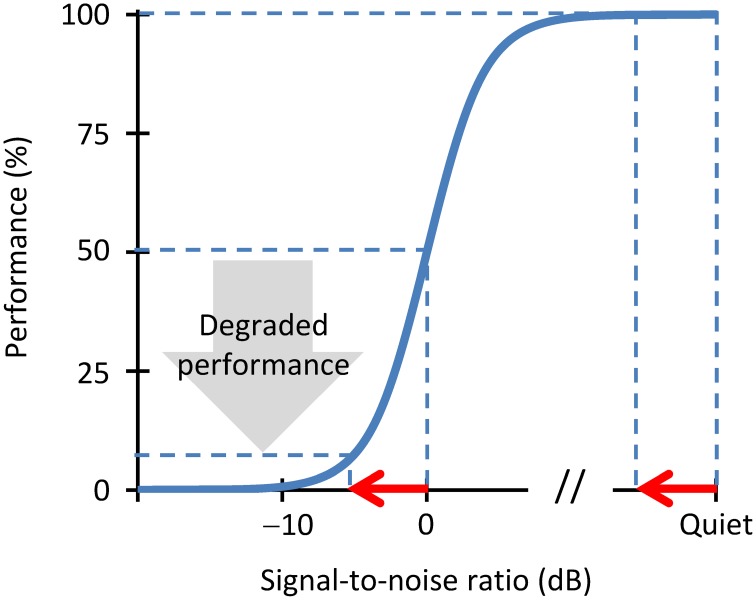
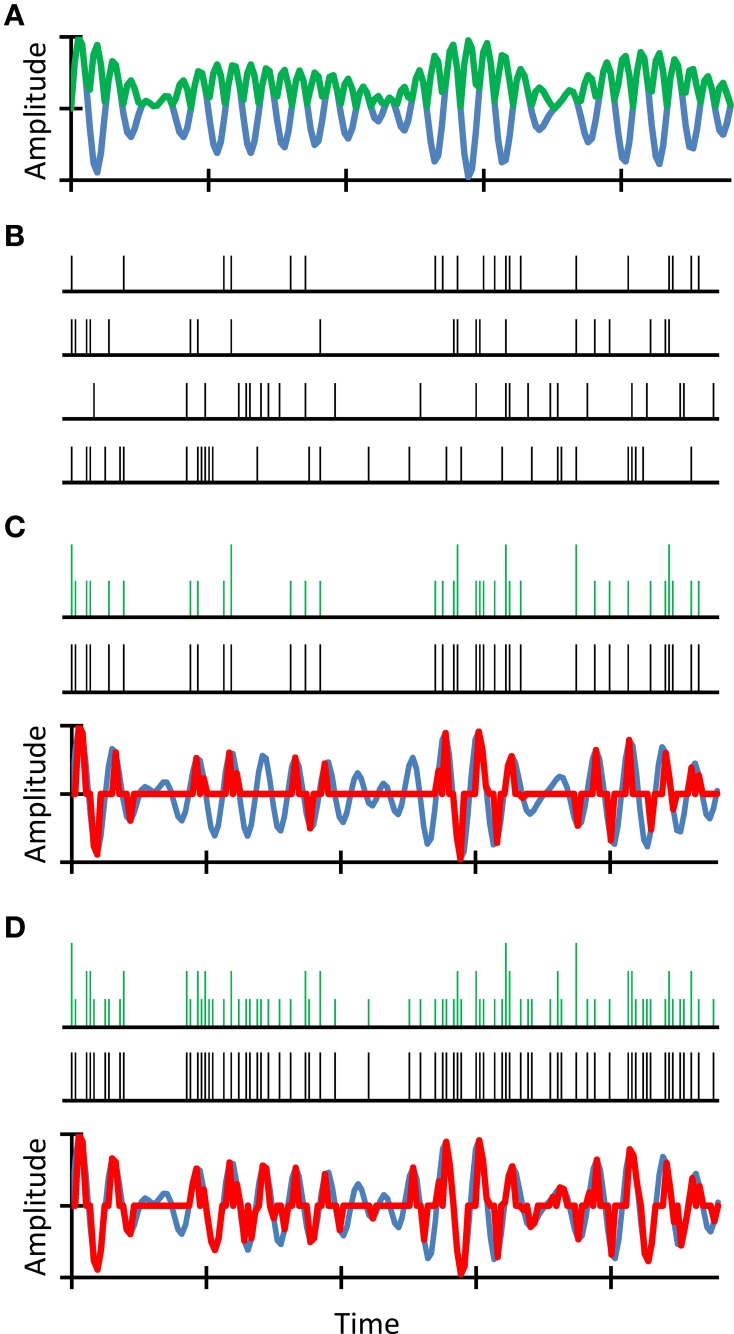
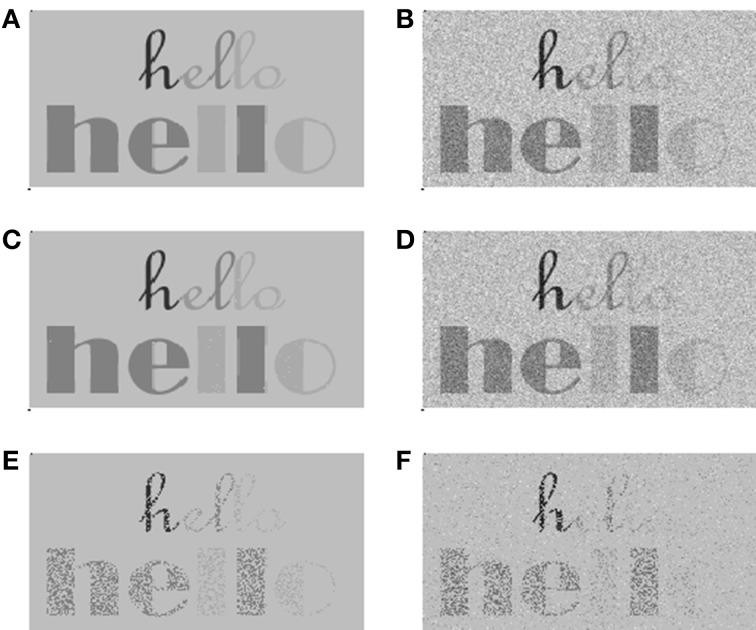
Hearing impairment is a serious disease with increasing prevalence. It is defined based on increased audiometric thresholds but increased thresholds are only partly responsible for the greater difficulty understanding speech in noisy environments experienced by some older listeners or by hearing-impaired listeners. Identifying the additional factors and mechanisms that impair intelligibility is fundamental to understanding hearing impairment but these factors remain uncertain. Traditionally, these additional factors have been sought in the way the speech spectrum is encoded in the pattern of impaired mechanical cochlear responses. Recent studies, however, are steering the focus toward impaired encoding of the speech waveform in the auditory nerve. In our recent work, we gave evidence that a significant factor might be the loss of afferent auditory nerve fibers, a pathology that comes with aging or noise overexposure. Our approach was based on a signal-processing analogy whereby the auditory nerve may be regarded as a stochastic sampler of the sound waveform and deafferentation may be described in terms of waveform undersampling. We showed that stochastic undersampling simultaneously degrades the encoding of soft and rapid waveform features, and that this degrades speech intelligibility in noise more than in quiet without significant increases in audiometric thresholds. Here, we review our recent work in a broader context and argue that the stochastic undersampling analogy may be extended to study the perceptual consequences of various different hearing pathologies and their treatment.
Keywords: aging; auditory deafferentation; auditory encoding; hearing impairment; hearing loss; speech intelligibility; speech processing; stochastic sampling.
Figures
Similar articles
-
Stochastic undersampling steepens auditory threshold/duration functions: implications for understanding auditory deafferentation and aging.Front Aging Neurosci. 2015 May 15;7:63. doi: 10.3389/fnagi.2015.00063. eCollection 2015. Front Aging Neurosci. 2015. PMID: 26029098 Free PMC article.
-
Perception of stochastically undersampled sound waveforms: a model of auditory deafferentation.Front Neurosci. 2013 Jul 16;7:124. doi: 10.3389/fnins.2013.00124. eCollection 2013. Front Neurosci. 2013. PMID: 23882176 Free PMC article.
-
Auditory models of suprathreshold distortion and speech intelligibility in persons with impaired hearing.J Am Acad Audiol. 2013 Apr;24(4):307-28. doi: 10.3766/jaaa.24.4.6. J Am Acad Audiol. 2013. PMID: 23636211
-
Underlying neural mechanisms of degraded speech intelligibility following noise-induced hearing loss: The importance of distorted tonotopy.Hear Res. 2022 Dec;426:108586. doi: 10.1016/j.heares.2022.108586. Epub 2022 Jul 22. Hear Res. 2022. PMID: 35953357 Free PMC article. Review.
-
Supra-Threshold Hearing and Fluctuation Profiles: Implications for Sensorineural and Hidden Hearing Loss.J Assoc Res Otolaryngol. 2018 Aug;19(4):331-352. doi: 10.1007/s10162-018-0669-5. Epub 2018 May 9. J Assoc Res Otolaryngol. 2018. PMID: 29744729 Free PMC article. Review.
Cited by
-
Age-Related Temporal Processing Deficits in Word Segments in Adult Cochlear-Implant Users.Trends Hear. 2019 Jan-Dec;23:2331216519886688. doi: 10.1177/2331216519886688. Trends Hear. 2019. PMID: 31808373 Free PMC article.
-
Analysis of the Spanish Auditory Test of Speech in Noise (PAHRE) in a Population with Hearing Loss.Audiol Res. 2024 Sep 25;14(5):861-874. doi: 10.3390/audiolres14050073. Audiol Res. 2024. PMID: 39452465 Free PMC article.
-
Impaired noise adaptation contributes to speech intelligibility problems in people with hearing loss.Sci Rep. 2024 Nov 20;14(1):28807. doi: 10.1038/s41598-024-80131-9. Sci Rep. 2024. PMID: 39567602 Free PMC article.
-
Cochlear Neurotrophin-3 overexpression at mid-life prevents age-related inner hair cell synaptopathy and slows age-related hearing loss.Aging Cell. 2022 Oct;21(10):e13708. doi: 10.1111/acel.13708. Epub 2022 Sep 11. Aging Cell. 2022. PMID: 36088647 Free PMC article.
-
Molecular analysis of individual differences in talker search at the cocktail-party.J Acoust Soc Am. 2022 Sep;152(3):1804. doi: 10.1121/10.0014116. J Acoust Soc Am. 2022. PMID: 36182280 Free PMC article.
References
-
- ANSI S3.5. (2007). Methods for Calculation of the Speech Intelligibility Index. New York: American National Standards Institute
-
- Baer T., Moore B. C. J. (1993). Effects of spectral smearing on the intelligibility of sentences in noise. J. Acoust. Soc. Am. 94, 1241. 10.1121/1.408176 - DOI
Publication types
LinkOut - more resources
Full Text Sources
Other Literature Sources