. 2014 Oct 30:8:366.
doi: 10.3389/fnbeh.2014.00366. eCollection 2014.

Effects of MS-153 on chronic ethanol consumption and GLT1 modulation of glutamate levels in male alcohol-preferring rats

Affiliations

Effects of MS-153 on chronic ethanol consumption and GLT1 modulation of glutamate levels in male alcohol-preferring rats

Hasan Alhaddad et al. Front Behav Neurosci. .

Abstract

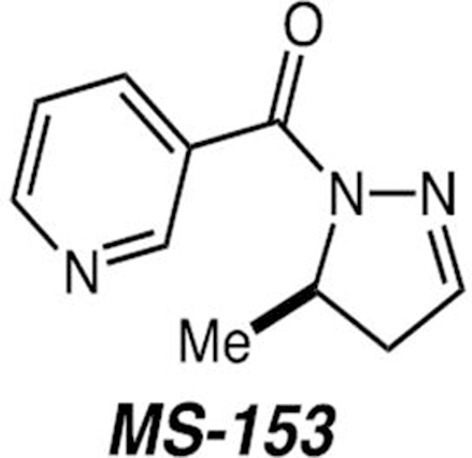
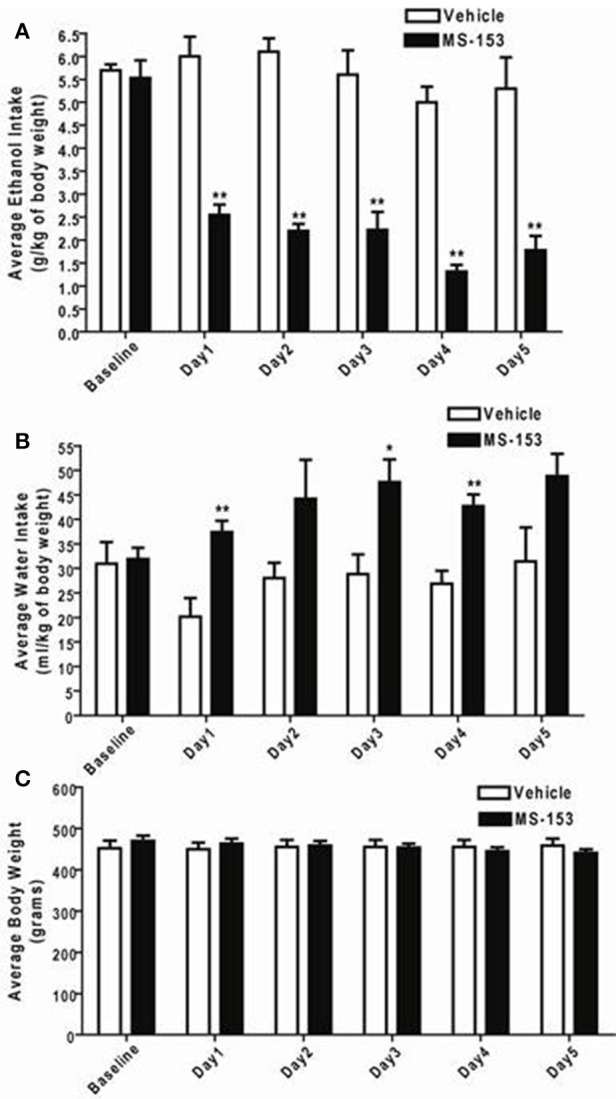
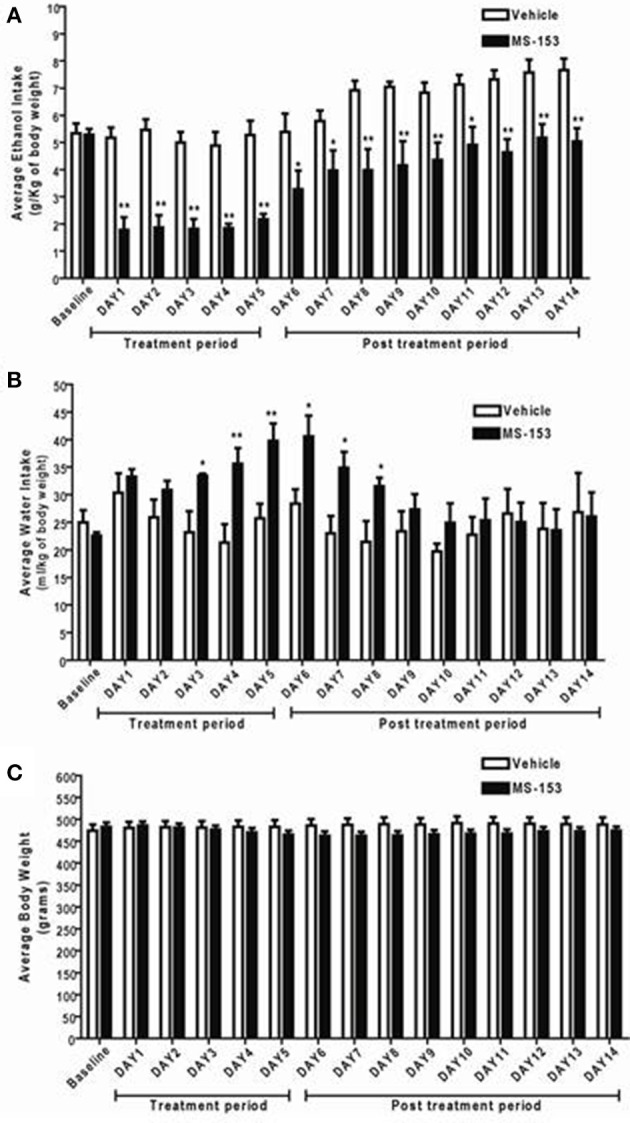
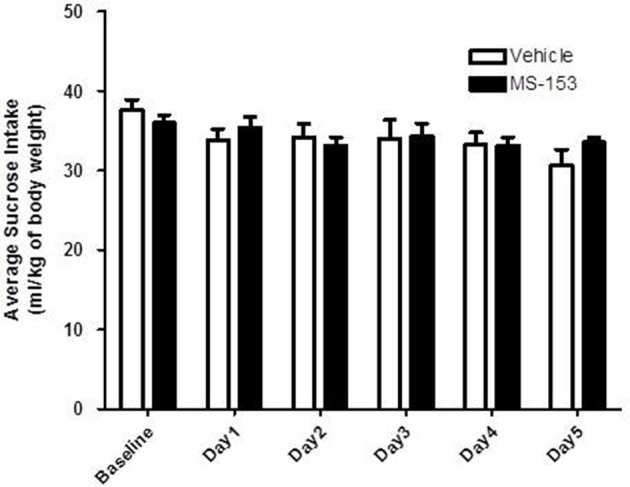
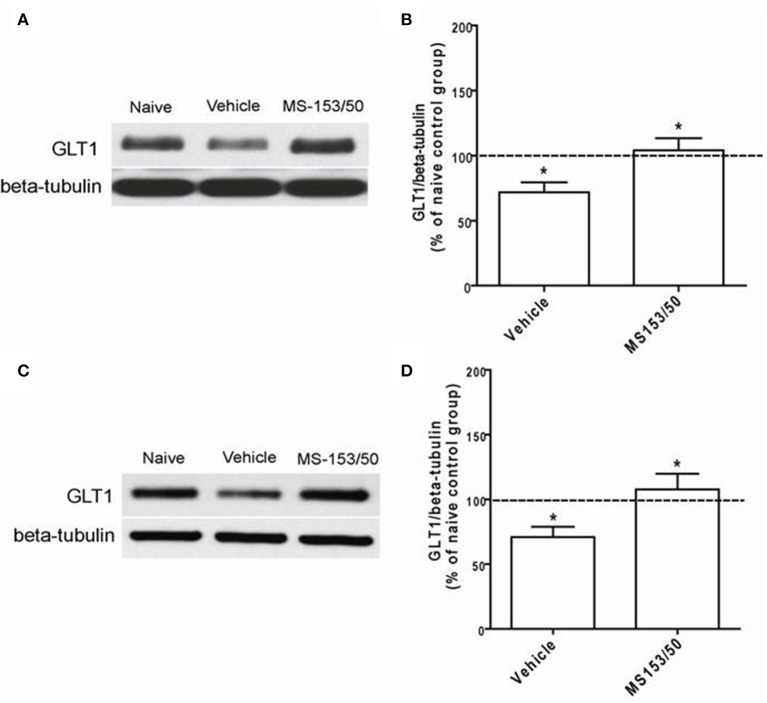
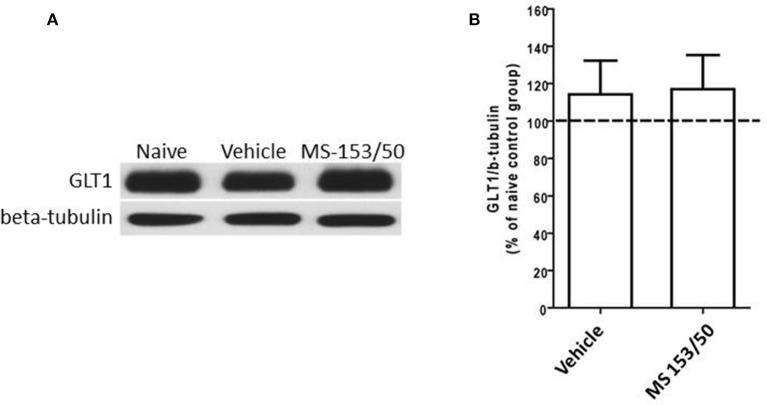
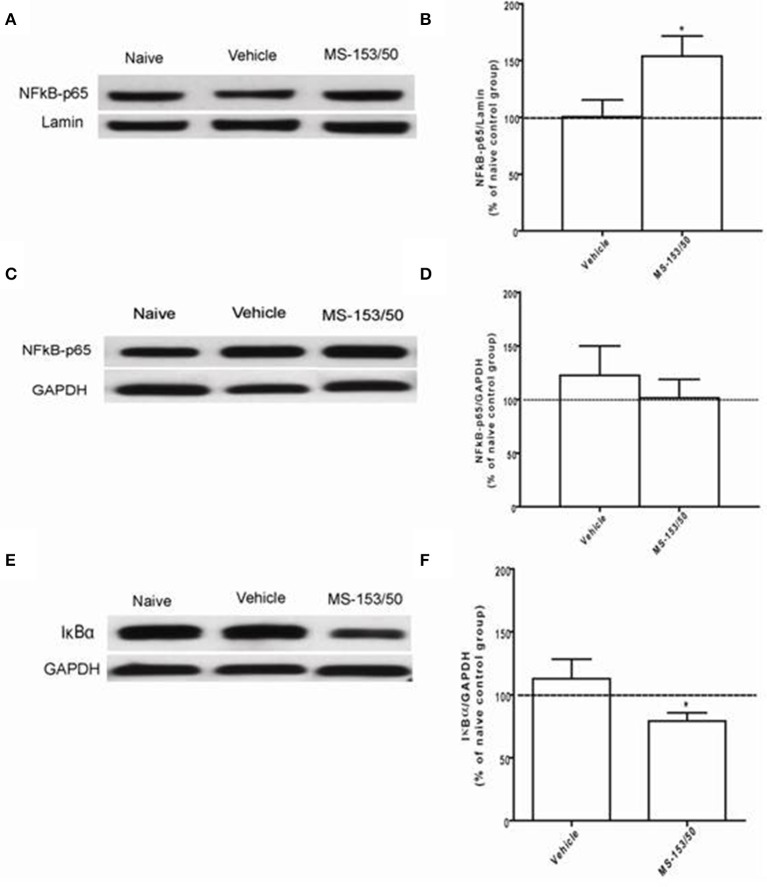
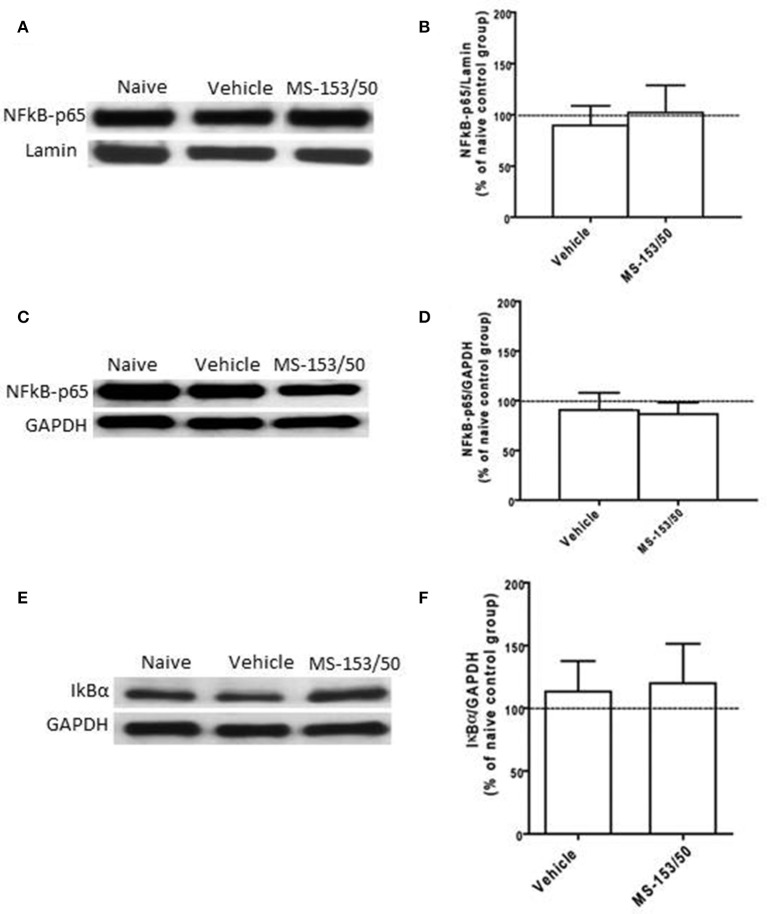
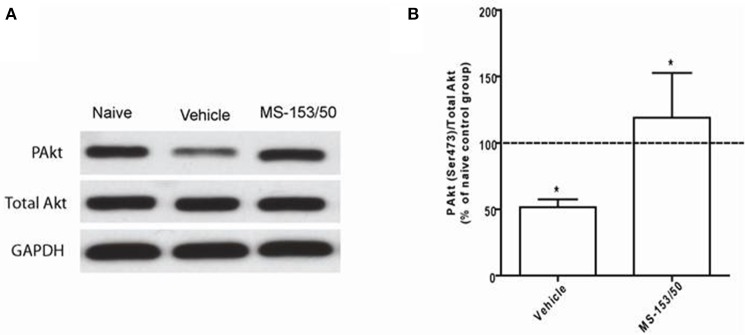
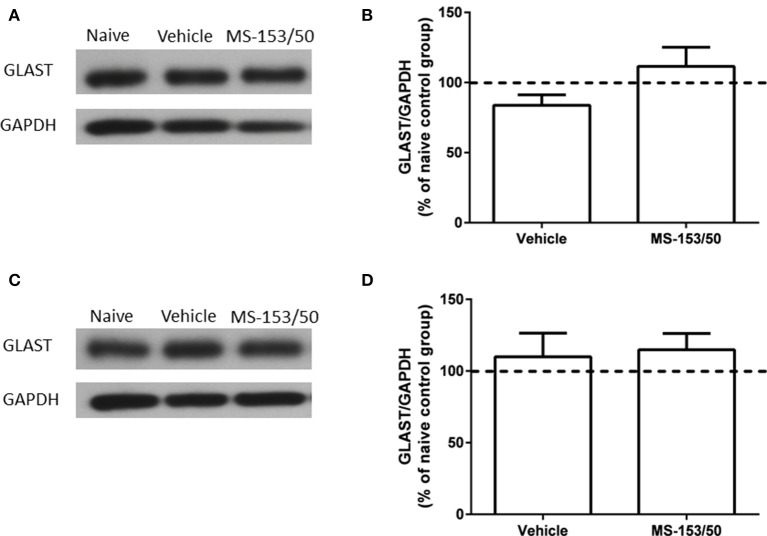
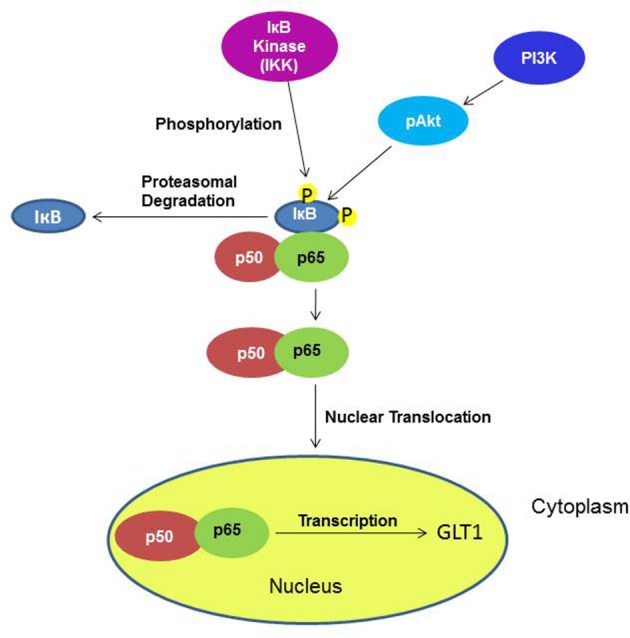
We have recently shown that upregulation of glutamate transporter 1 (GLT1) in the brain is associated in part with reduction in ethanol intake in alcohol-preferring (P) male rats. In this study, we investigated the effects of a synthetic compound, (R)-(-)-5-methyl-1-nicotinoyl-2-pyrazoline (MS-153), known to activate GLT1 on ethanol consumption as well as GLT1 expression and certain signaling pathways in P rats. P rats were given 24-h concurrent access to 15 and 30% ethanol, water and food for 5 weeks. On week 6, P rats received MS-153 at a dose of 50 mg/kg (i.p.) or a vehicle (i.p.) for 5 consecutive days. We also tested the effect of MS-153 on daily sucrose (10%) intake. Our studies revealed a significant decrease in ethanol intake at the dose of 50 mg/kg MS-153 from Day 1 through 14. In addition, MS-153 at dose of 50 mg/kg did not induce any significant effect on sucrose intake. Importantly, we found that MS-153 upregulated the GLT1 level in the nucleus accumbens (NAc) but not in the prefrontal cortex (PFC). In accordance, we found upregulation of nuclear NFkB-65 level in NAc in MS-153-treated group, however, IkBα was downregulated in MS-153-treated group in NAc. We did not find any changes in NFkB-65 and IkBα levels in PFC. Interestingly, we revealed that p-Akt was downregulated in ethanol vehicle treated groups in the NAc; this downregulation was reversed by MS-153 treatment. We did not observe any significant differences in glutamate aspartate transporter (GLAST) expression among all groups. These findings reveal MS-153 as a GLT1 modulator that may have potential as a therapeutic drug for the treatment of alcohol dependence.

Keywords: EAAT2; GLT1; MS-153; P rats; alcohol dependence; glutamate.


Figures

Figure 1
Figure 1
(R)-(−)-5-methyl-1-nicotinoyl-2-pyrazoline (MS-153) structure.
Figure 2
Figure 2
Diagram showing the sample chromatograms of MS-153 in plasma (A) and CSF (B) (n = 4). The X-axis represents the retention time of MS-153 in minutes and the Y-axis represents the absorbance of MS-153 in absorbance units.
Figure 3
Figure 3
(A) Effects of MS-153 treatment on ethanol intake in male P rats exposed to 5 weeks of free choice of ethanol and water. Vehicle (n = 7), and MS-153 50 mg/kg (n = 5). Statistical analyses exhibited a significant decrease in ethanol consumption with MS-153 (50 mg/kg, i.p.) from Day 1 (24 h after the first i.p. injection) through Day 5 compared to the ethanol vehicle group. (B) Effects of MS-153 treatment on water intake in P rats exposed to 5 weeks of free choice of ethanol and water. Statistical analyses exhibited a significant increase in water consumption with MS-153 (50 mg/kg, i.p.) on Days 1, 3, and 4 compared to the ethanol vehicle group. (C) Effects of MS-153 treatment on body weight. Statistical analyses did not demonstrate any significant effect on body weight. Values shown as means ± s.e.m. (*p < 0.05; **p < 0.01).
Figure 4
Figure 4
(A) Effects of MS-153 treatment and post-treatment on daily ethanol intake in male P rats exposed to 5 weeks of free choice of ethanol and water. Vehicle (n = 8), and MS-153 50 mg/kg (n = 8). Statistical analyses demonstrated a significant decrease in ethanol intake with the MS-153 (50 mg/kg, i.p.) treated group from Day 1 (24 h after the first i.p. injection) through Day 14 (10 days after the last injection) as compared to ethanol vehicle group. (B) Effects of MS-153 treatment on water intake in P rats exposed to 5 weeks of free choice of ethanol and water. Statistical analyses demonstrated a significant increase in water consumption on days 3–8. (C) Effects of MS-153 treatment on body weight. Statistical analyses did not demonstrate any significant effects of MS-153 on body weight. Values shown as means ± s.e.m. (*p < 0.05; **p < 0.01).
Figure 5
Figure 5
Effects of MS-153 on sucrose intake in P rats. Vehicle (n = 7) and MS-153 50 mg/kg (n = 5). MS-153 at the higher dose (50 mg/kg, i.p.) did not induce any effect on sucrose intake. Values shown as means ± s.e.m.
Figure 6
Figure 6
Effects of MS-153 (50 mg/kg) on GLT1 expression level in NAc. (A,C) Immunoblots for GLT1 and β-tubulin, which was used as a control loading protein, in the NAc after 1 day and 10 days of the last i.p. injection of MS-153, respectively. (B,D) Quantitative analysis revealed a significant increase in the ratio of GLT1/β-tubulin in MS-153-treated groups compared to the ethanol vehicle groups after 1 day and 10 days of the last i.p. injection of MS-153, respectively. Significant downregulation of GLT1 expression was revealed in the ethanol vehicle group compared to the naïve ethanol group. Values shown as means ± s.e.m. (*p < 0.05) (n = 5 for each group).
Figure 7
Figure 7
Effects of MS-153 (50 mg/kg) on GLT1 expression in PFC. (A) Immunoblots for GLT1 and β-tubulin, which was used as a control loading protein, in the PFC after 1 day of the last i.p. injection of MS-153. (B) Quantitative analysis did not reveal any significant differences in the ratio of GLT1/β-tubulin among all groups. Values shown as means ± s.e.m. (n = 5 for each group).
Figure 8
Figure 8
Effects of MS-153 at 50 mg/kg (MS-153/50, n = 5), vehicle (ethanol vehicle group, n = 5), naïve (naïve ethanol vehicle group, n = 5) groups on NFκ B-p65 level in the NAc. (A,C,E) Immunoblots for GAPDH and Lamin [which were used as control loading proteins for cytoplasmic extract (CE) and nuclear extract (NE) proteins, respectively], NFκ B-p65, and Iκ Bα in CE and NE. (B,D) Quantitative analysis of NFκ B-p65 levels in the CE and NE revealed a significant increase in the ratio of NFκ B-p65/Lamin level in the NE but not in the CE for the ethanol MS-153-treated group compared to the naïve ethanol vehicle and ethanol vehicle groups. (F) Quantitative analysis of Iκ Bα level in the CE revealed a significant decrease in the ratio of Iκ Bα/GAPDH level in the ethanol MS-153-treated group compared to the naïve ethanol vehicle and ethanol vehicle groups. Values shown as means ± s.e.m. (*p < 0.05).
Figure 9
Figure 9
Effects of MS-153 at 50 mg/kg (MS-153/50, n = 5), vehicle (ethanol vehicle group, n = 5), naïve (naïve ethanol vehicle group, n = 5) groups on NF-κ B-p65 level in the PFC. (A,C,E) Immunoblots for GAPDH and Lamin (which were used as control loading proteins for cytoplasmic extract (CE) and nuclear extract (NE) proteins, respectively), NF-κ B-p65, and Iκ Bα in CE and NE extracts. (B,D) Quantitative analysis of NF-κ B-p65 levels in CE and NE did not reveal any significant change in all tested groups in the CE or NE. (F) Quantitative analysis of Iκ Bα level in CE did not reveal any significant change in Iκ Bα level in tested groups. Values shown as means ± s.e.m.
Figure 10
Figure 10
Effects of MS-153 at 50 mg/kg (MS-153, n = 5), vehicle (ethanol vehicle group, n = 5), naïve (naïve ethanol vehicle group, n = 5) groups on phospho-Akt levels in the NAc. (A) Each panel presents immunoblots for Total Akt and GAPDH, which was used as a control loading protein, and phospho-Akt (PAkt) in the NAc. (B) Quantitative analysis revealed a significant increase in the ratio of PAkt/total Akt in both MS-153-treated groups compared to the ethanol vehicle group. Significant downregulation of PAkt/total Akt expression was revealed in the ethanol vehicle group compared to the naïve ethanol vehicle group. Values shown as means ± s.e.m. (*p < 0.01).
Figure 11
Figure 11
Effects of MS-153 (50 mg/kg) on GLAST expression in PFC and NAc. (A,C) Immunoblots for GLAST and GAPDH, which was used as a control loading protein, in the PFC and NAc, respectively. (B,D) Quantitative analysis did not reveal any significant differences in the ratio of GLAST/GAPDH among all groups in PFC and NAc, respectively. Values shown as means ± s.e.m. (n = 5 for each group).
Figure 12
Figure 12
Diagram shows the signaling pathways involving the effects of MS-153 in upregulation of GLT1. Under an unknown mechanism, MS-153 administration may increase GLT1 transcription through phosphorylation by IkB kinase of the IkB-p50–p65 complex, which dissociated to p50–p65 and IkB. The nuclear translocation of p50–p65 can lead to increased transcription of GLT1.

Similar articles

Cited by

References

    1. Abekawa T., Honda M., Ito K., Inoue T., Koyama T. (2002). Effect of MS-153 on the development of behavioral sensitization to stereotypy-inducing effect of phencyclidine. Brain Res. 926, 176–180. 10.1016/S0006-8993(01)03164-X - DOI - PubMed
    1. Alhaddad H., Das S. C., Sari Y. (2014). Effects of ceftriaxone on ethanol intake: a possible role for xCT and GLT-1 isoforms modulation of glutamate levels in P rats. Psychopharmacology (Berl). 231, 4049–4057. 10.1007/s00213-014-3545-y - DOI - PMC - PubMed
    1. Berger U. V., Hediger M. A. (1998). Comparative analysis of glutamate transporter expression in rat brain using differential double in situ hybridization. Anat. Embryol. (Berl). 198, 13–30. 10.1007/s004290050161 - DOI - PubMed
    1. Dahchour A., Hoffman A., Deitrich R., de Witte P. (2000). Effects of ethanol on extracellular amino acid levels in high-and low-alcohol sensitive rats: a microdialysis study. Alcohol Alcohol. 35, 548–553. 10.1093/alcalc/35.6.548 - DOI - PubMed
    1. Danbolt N. C. (2001). Glutamate uptake. Prog. Neurobiol. 65, 1–105. 10.1016/S0301-0082(00)00067-8 - DOI - PubMed

LinkOut - more resources