Review
. 2014 Oct 30:5:225.
doi: 10.3389/fneur.2014.00225. eCollection 2014.

Conceptualizing lennox-gastaut syndrome as a secondary network epilepsy

Affiliations
Review

Conceptualizing lennox-gastaut syndrome as a secondary network epilepsy

John S Archer et al. Front Neurol. .

Abstract

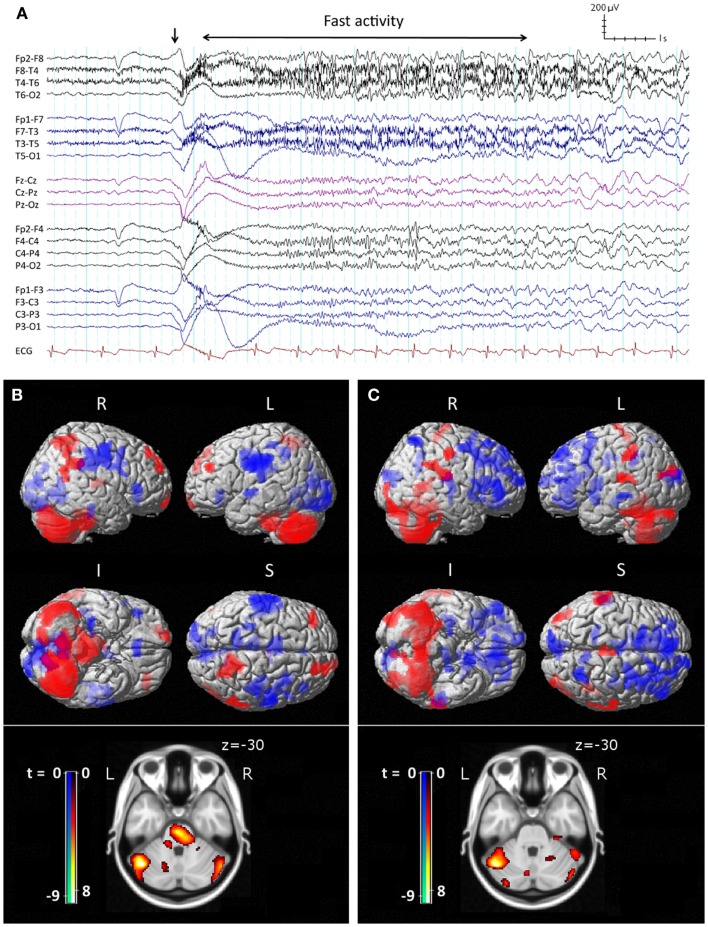
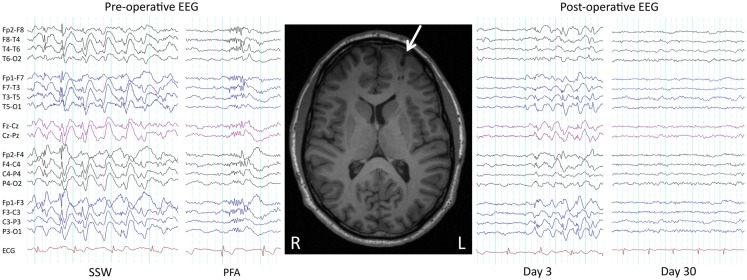
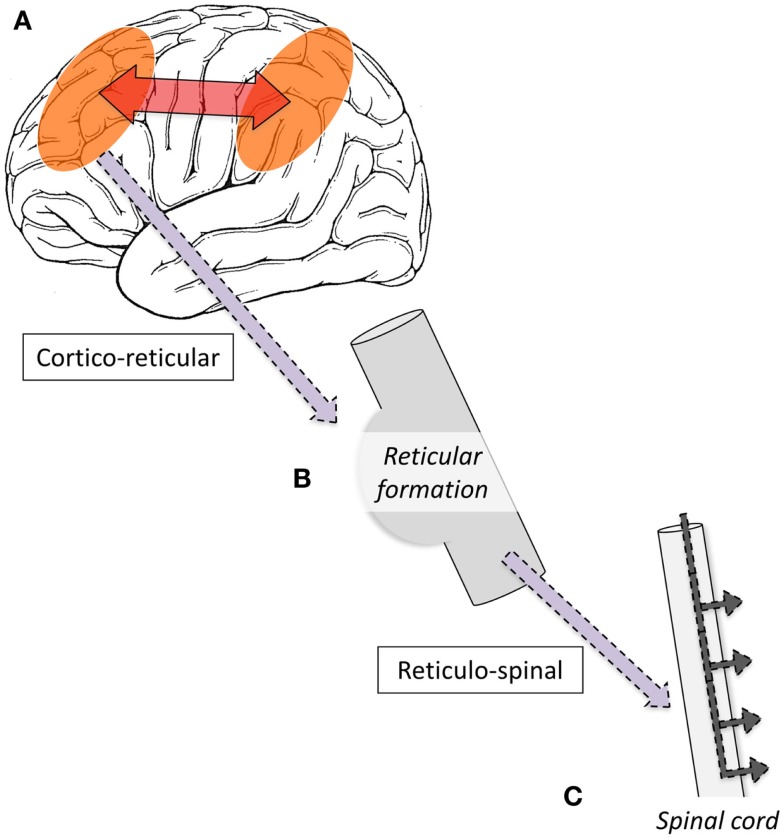
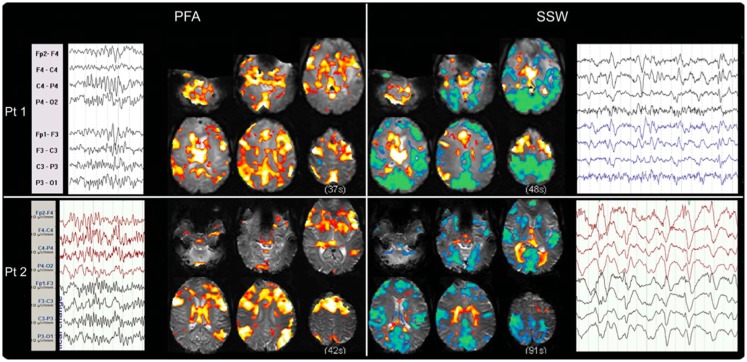
Lennox-Gastaut Syndrome (LGS) is a category of severe, disabling epilepsy, characterized by frequent, treatment-resistant seizures, and cognitive impairment. Electroencephalography (EEG) shows characteristic generalized epileptic activity that is similar in those with lesional, genetic, or unknown causes, suggesting a common underlying mechanism. The condition typically begins in young children, leaving many severely disabled with recurring seizures throughout their adult life. Scalp EEG of the tonic seizures of LGS is characterized by a diffuse high-voltage slow transient evolving into generalized low-voltage fast activity, likely reflecting sustained fast neuronal firing over a wide cortical area. The typical interictal discharges (runs of slow spike-and-wave and bursts of generalized paroxysmal fast activity) also have a "generalized" electrical field, suggesting widespread cortical involvement. Recent brain mapping studies have begun to reveal which cortical and subcortical regions are active during these "generalized" discharges. In this critical review, we examine findings from neuroimaging studies of LGS and place these in the context of the electrical and clinical features of the syndrome. We suggest that LGS can be conceptualized as "secondary network epilepsy," where the epileptic activity is expressed through large-scale brain networks, particularly the attention and default-mode networks. Cortical lesions, when present, appear to chronically interact with these networks to produce network instability rather than triggering each individual epileptic discharge. LGS can be considered as "secondary" network epilepsy because the epileptic manifestations of the disorder reflect the networks being driven, rather than the specific initiating process. In this review, we begin with a summation of the clinical manifestations of LGS and what this has revealed about the underlying etiology of the condition. We then undertake a systematic review of the functional neuroimaging literature in LGS, which leads us to conclude that LGS can best be conceptualized as "secondary network epilepsy."

Keywords: EEG–fMRI; Lennox–Gastaut syndrome; attention network; default-mode network; generalized epilepsy; paroxysmal fast activity; slow spike and wave; tonic seizure.


Figures

Figure 1
Figure 1
Ictal EEG features and peri-ictal SPECT of tonic seizures in LGS. (A) Clinical onset of seizure corresponds with a high-voltage slow transient (vertical arrow) followed by apparent diffuse attenuation, evolving into low-voltage fast activity (LVFA) and later a run of slow spike-and-wave mixed with notched delta. (B) Early radiotracer injection (<10 s after offset of LVFA) and subsequent SPECT shows an early pattern of increased (red) cerebral blood flow in frontal and parietal “attention” areas, pons, and cerebellum, and decreased (blue) CBF in primary cortical areas. (C) Late radiotracer injection (>10 s after offset of LVFA) and subsequent SPECT shows an evolution toward a pattern of increased CBF over lateral parietal cortex and cerebellum, and decreased CBF bi-frontally, while the pons is no longer involved. (B,C) Top: surface renderings displayed at p < 0.02 (uncorrected), extent k > 125 voxels. Below: overlay onto axial slice of MNI T1 152 average brain displayed at p < 0.05 [cluster-corrected for family-wise error (FWE)]. R = right, L = left, I = inferior, S = superior. Adapted and re-printed with permission from Intusoma and colleagues (13).
Figure 2
Figure 2
Pre- and post-operative EEG. Pre- and post-operative EEG in a 38-year-old male with LGS, a lesion, and intractable seizures since childhood. Prior to resection of a left frontal cortical dysplasia (arrowed), the patient suffered daily seizures. Pre-operative interictal EEG showed bursts of slow spike-and-wave (SSW) and generalized paroxysmal fast activity (GPFA). Day 3 post-operative EEG showed persistence of SSW, while day 30 EEG showed complete normalization, consistent with a winding down of the epileptic process. The patient is 2 years seizure free, consistent with LGS being potentially reversible. Re-printed with permission from Archer and colleagues (29).
Figure 3
Figure 3
Schematic illustration of proposed mechanism of tonic seizures in LGS is shown. (A) Epileptiform activity initiated in cortex, and rapidly amplified within intrinsic attention and default-mode networks. (B) Epileptiform activity projects via cortico-reticular pathway – Brodmann area 6 (premotor cortex) to ponto-medullary reticular formation (105, 106). (C) Epileptiform activity projects via the reticulo-spinal pathway to motor neurons innervating proximal muscles at multiple levels (107).
Figure 4
Figure 4
Electroencephalography–functional magnetic resonance imaging of generalized paroxysmal fast activity (GPFA) and slow spike-and-wave (SSW) in individual LGS patients is shown. In individual patients, GPFA and SSW produce different blood–oxygen-level-dependent (BOLD) response patterns. GPFA shows increased BOLD in diffuse association network regions, as well as brainstem, basal ganglia, and thalamus. SSW shows a different pattern, with decreased BOLD signal in primary cortical areas. The number of events in seconds, at the bottom of each panel, is the sum of the length of all individual epileptiform events recorded during the EEG for each patient. Pt, patient. Re-printed with permission from Pillay and colleagues (72).
Figure 5
Figure 5
Group-level EEG–fMRI activation maps and peri-event BOLD signal time-courses in LGS patients with epileptogenic lesions in different cortical locations are shown. (A) Generalized paroxysmal fast activity (GPFA). Left: fixed-effects whole-brain group EEG–fMRI analysis in six patients with cortical lesions in different locations showing co-activation of two normally anti-correlated cognitive systems in diffuse association cortex: the attention and default-mode networks. Activations are displayed as two-tailed t-statistics thresholded at p < 0.05 (corrected for FWE) and overlaid on axial slices of the MNI T1 152 average brain. Right: random-effects peri-event time-course analysis showing GPFA group mean BOLD signal change from regions of interest. Time-courses are displayed in 3.2 s time-bins, from 32 s before to 32 s after event onset (indicated by vertical line). Error bars indicate standard errors. Asterisks indicate time-bins of significant mean BOLD signal change (two-tailed single sample t-tests, p < 0.05, uncorrected). Time-course analysis confirms simultaneous BOLD signal increases in frontal and parietal association cortical areas, thalamus, and pons, and reduced signal in primary cortical areas. (B) Slow spike-and-wave (SSW). Left: fixed-effects whole-brain group EEG–fMRI analysis in three subjects with cortical lesions in different locations showing mixed increased and decreased BOLD signal, including activation in thalamus and lateral frontal and parietal areas, and deactivation in primary cortex including pericentral and occipital regions. Activations are displayed as per (A). Right: random-effects peri-event time-course analysis showing SSW group mean BOLD signal change from regions of interest, as displayed in (A). Time-course analysis shows a complex set of activity changes that are only partially captured by the whole-brain maps. Attention and default-mode networks are being driven simultaneously, but with a steady “pre-spike” increase in activity followed by a decrease in signal at the time of scalp-detected SSW. Primary cortical regions show signal decreases. Adapted and re-printed with permission from Archer and colleagues (29).

References

    1. Oguni H, Hayashi K, Osawa M. Long-term prognosis of Lennox-Gastaut syndrome. Epilepsia (1996) 37(s3):44–7.10.1111/j.1528-1157.1996.tb01820.x - DOI - PubMed
    1. Yagi K. Evolution of Lennox-Gastaut syndrome: a long-term longitudinal study. Epilepsia (1996) 37(s3):48–51.10.1111/j.1528-1157.1996.tb01821.x - DOI - PubMed
    1. Goldsmith IL, Zupanc ML, Buchhalter JR. Long-term seizure outcome in 74 patients with Lennox–Gastaut syndrome: effects of incorporating MRI head imaging in defining the cryptogenic subgroup. Epilepsia (2000) 41(4):395–9.10.1111/j.1528-1157.2000.tb00179.x - DOI - PubMed
    1. Arzimanoglou A, French J, Blume WT, Cross JH, Ernst J-P, Feucht M, et al. Lennox-Gastaut syndrome: a consensus approach on diagnosis, assessment, management, and trial methodology. Lancet Neurol (2009) 8(1):82–93.10.1016/S1474-4422(08)70292-8 - DOI - PubMed
    1. Crumrine PK. Lennox-Gastaut syndrome. J Child Neurol (2002) 17(1 Suppl):S70–5.10.1177/08830738020170011001 - DOI - PubMed