

Mild degenerative changes of hip cartilage in elderly patients: an available sample representative of early osteoarthritis
- PMID: 25400727
- PMCID: PMC4230082
Mild degenerative changes of hip cartilage in elderly patients: an available sample representative of early osteoarthritis
Abstract
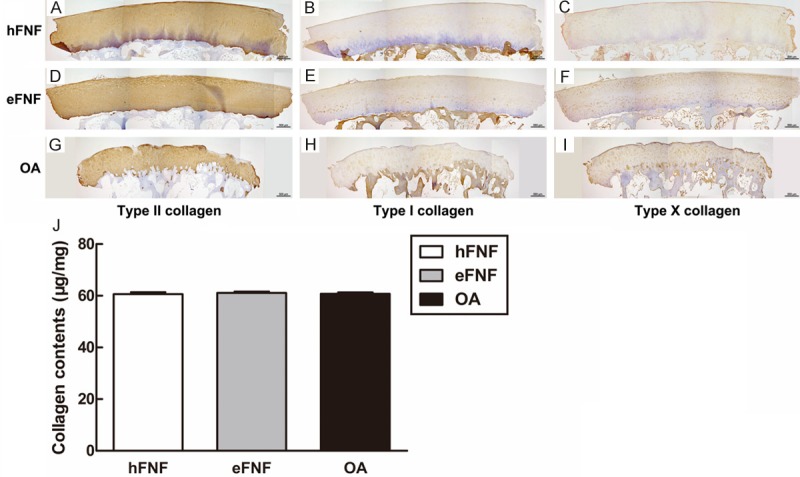
This study investigated the cellular and molecular changes which occur in cartilage from adults with femoral neck fracture (FNF) and osteoarthritis (OA), and explored the similarities in hip cartilage obtained from elderly patients and patients with early OA. Femoral heads were retrieved from 23 female patients undergoing total hip arthroplasty (THA). This group included 7 healthy patients with FNF (hFNF), 8 elderly adults with FNF (eFNF), and 8 elderly patients with hip OA (OA). After high-field MRI T2 mapping, osteochondral plugs were harvested from the weight-bearing area of femoral heads for subsequent macroscopic, histologic, and immunochemical evaluation. Additionally, the contents of cartilage matrix were analyzed, and gene expression was detected. The surface of cartilage from hFNF and eFNF patients appeared smooth, regular, and elastic, whereas it showed irregularities, thinning, and defects in OA patients. Elevated T2 values and decreased accumulation of glycosaminoglycans (GAGs) were detected in cartilage from eFNF patients. Furthermore, type I collagen accumulation was slightly increased and type X collagen concentration was obviously elevated in eFNF patients; however, type II collagen distribution and the contents and anisotropy of collagen fibrils in eFNF patients showed no significant changes. Consistent with histology and immunohistochemical results, aggrecan was downregulated and type X collagen was upregulated, while collagens types I and II showed no significant changes in eFNF patients. The cellular and molecular characteristics of hip cartilage in eFNF patients who showed no symptoms of OA were similar to those in patients with mild OA. Thus, eFNF cartilage can serve as a comparative specimen for use in studies investigating early OA.
Keywords: Femoral neck fracture; articular cartilage degeneration; available sample; elderly patients; osteoarthritis.
Figures


Similar articles
-
Cartilage collagen damage in hip osteoarthritis similar to that seen in knee osteoarthritis; a case-control study of relationship between collagen, glycosaminoglycan and cartilage swelling.BMC Musculoskelet Disord. 2013 Jan 9;14:18. doi: 10.1186/1471-2474-14-18. BMC Musculoskelet Disord. 2013. PMID: 23302451 Free PMC article.
-
Cartilage T1ρ and T2 Relaxation Times in Patients With Mild-to-Moderate Radiographic Hip Osteoarthritis.Arthritis Rheumatol. 2015 Jun;67(6):1548-56. doi: 10.1002/art.39074. Arthritis Rheumatol. 2015. PMID: 25779656 Free PMC article.
-
Is cartilage sGAG content related to early changes in cartilage disease? Implications for interpretation of dGEMRIC.Osteoarthritis Cartilage. 2012 May;20(5):396-404. doi: 10.1016/j.joca.2012.01.015. Epub 2012 Feb 11. Osteoarthritis Cartilage. 2012. PMID: 22334095
-
Hip MRI and its implications for surgery in osteoarthritis patients.Rheum Dis Clin North Am. 2009 Aug;35(3):591-604. doi: 10.1016/j.rdc.2009.09.001. Rheum Dis Clin North Am. 2009. PMID: 19931805 Review.
-
MRI of hip cartilage: joint morphology, structure, and composition.Clin Orthop Relat Res. 2012 Dec;470(12):3321-31. doi: 10.1007/s11999-012-2403-7. Clin Orthop Relat Res. 2012. PMID: 22723242 Free PMC article. Review.
Cited by
-
Biochemical Markers for the Early Identification of Osteoarthritis: Systematic Review and Meta-Analysis.Mol Diagn Ther. 2018 Dec;22(6):671-682. doi: 10.1007/s40291-018-0362-8. Mol Diagn Ther. 2018. PMID: 30377978
-
Investigations of Cartilage Matrix Degeneration in Patients with Early-Stage Femoral Head Necrosis.Med Sci Monit. 2017 Dec 6;23:5783-5792. doi: 10.12659/msm.907522. Med Sci Monit. 2017. PMID: 29208853 Free PMC article.
-
Acetabular cartilage abnormalities in elderly patients with femoral neck fractures.SICOT J. 2022;8:24. doi: 10.1051/sicotj/2022022. Epub 2022 Jun 14. SICOT J. 2022. PMID: 35699460 Free PMC article.
-
Regional Articular Cartilage Abnormalities of the Hip.AJR Am J Roentgenol. 2015 Sep;205(3):502-12. doi: 10.2214/AJR.15.14463. AJR Am J Roentgenol. 2015. PMID: 26295636 Free PMC article. Review.
-
Cartilage matrix changes in contralateral mobile knees in a rabbit model of osteoarthritis induced by immobilization.BMC Musculoskelet Disord. 2015 Aug 25;16:224. doi: 10.1186/s12891-015-0679-y. BMC Musculoskelet Disord. 2015. PMID: 26589614 Free PMC article.
References
-
- Pollard TCB, Gwilym SE, Carr AJ. The assessment of early osteoarthritis. J Bone Joint Surg Br. 2008;90:411–421. - PubMed
-
- Mosher TJ, Dardzinski BJ. Cartilage MRI T2 relaxation time mapping: overview and applications. Semin Musculoskelet Radiol. 2004;8:355–368. - PubMed
-
- Apprich S, Welsch GH, Mamisch TC, Szomolanyi P, Mayerhoefer M, Pinker K, Trattnig S. Detection of degenerative cartilage disease: comparison of high-resolution morphological MR and quantitative T2 mapping at 3.0 Tesla. Osteoarthritis Cartilage. 2010;18:1211–1217. - PubMed
-
- Watrin-Pinzano A, Ruaud JP, Olivier P, Grossin L, Gonord P, Blum A, Netter P, Guillot G, Gillet P, Loeuille D. Effect of proteoglycan depletion on T2 mapping in rat patellar cartilage. Radiology. 2005;234:162–170. - PubMed
Publication types
MeSH terms
Substances
LinkOut - more resources
Full Text Sources