Comparative Study
. 2015 Jan;47(1):39-46.
doi: 10.1038/ng.3144. Epub 2014 Nov 17.

A recurrent de novo mutation in KCNC1 causes progressive myoclonus epilepsy

Affiliations
Comparative Study

A recurrent de novo mutation in KCNC1 causes progressive myoclonus epilepsy

Mikko Muona et al. Nat Genet. 2015 Jan.

Abstract

Progressive myoclonus epilepsies (PMEs) are a group of rare, inherited disorders manifesting with action myoclonus, tonic-clonic seizures and ataxia. We sequenced the exomes of 84 unrelated individuals with PME of unknown cause and molecularly solved 26 cases (31%). Remarkably, a recurrent de novo mutation, c.959G>A (p.Arg320His), in KCNC1 was identified as a new major cause for PME. Eleven unrelated exome-sequenced (13%) and two affected individuals in a secondary cohort (7%) had this mutation. KCNC1 encodes KV3.1, a subunit of the KV3 voltage-gated potassium ion channels, which are major determinants of high-frequency neuronal firing. Functional analysis of the Arg320His mutant channel showed a dominant-negative loss-of-function effect. Ten cases had pathogenic mutations in known PME-associated genes (NEU1, NHLRC1, AFG3L2, EPM2A, CLN6 and SERPINI1). Identification of mutations in PRNP, SACS and TBC1D24 expand their phenotypic spectra to PME. These findings provide insights into the molecular genetic basis of PME and show the role of de novo mutations in this disease entity.


Figures
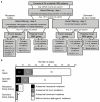
Figure 1
Figure 1
Analysis of the PME exomes. (a) A simplified flow chart of the exome data analysis strategy under autosomal and sex-linked recessive and dominant/de novo inheritance models, and summary of results. The average total number of variants per exome (36528) refers to single nucleotide variants and indels passing quality filtering within the exome bait regions. Numbers in parentheses after gene names indicate numbers of patients with mutations in the gene. Gene and patient counts under ‘Potential novel PME genes’ are derived after excluding patients with pathogenic or probably pathogenic mutations in known disease genes or with the pathogenic mutation in KCNC1 identified in this study. (b) Numbers and proportions of patients without obvious pathogenic mutations or with pathogenic or probably pathogenic mutations of variable patterns of inheritance. The three patients with probably pathogenic mutations are included under sporadic cases with recessive mutations. Case PME84-1 with the recurrent de novo KCNC1 mutation is included under cases with autosomal dominant mutations with a dominant family history (Fig. 2a).
Figure 2
Figure 2
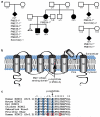
The recurrent c.959G>A mutation in KCNC1. (a) Pedigrees of 13 unrelated patients demonstrate the de novo occurrence of the c.959G>A mutation in KCNC1. Patient IDs of the exome-sequenced cases are marked with asterisks. Triangle symbol indicates miscarriage at 8 weeks. m, c.959G>A; +, wild-type; n.d., not determined. (b) A cartoon showing the domain structure of a single KV3.1 subunit. The positively charged arginine residues (marked with “+”) in the S4 segment detect changes in voltage. The p.Arg320His changes one of the arginine residues to a histidine (red “+”and arrow). (c) ClustalX amino acid sequence comparison of the voltage-sensing S4 segment shows full conservation of the arginine 320 (indicated by an arrow) across different species. The four positively charged arginine residues (Arg311, Arg314, Arg317, Arg320) occurring every third position are highlighted in blue. The KV3.3 residues Arg420, Arg423, Thr428, mutated in spinocerebellar ataxia,,, are in red boxes. Asterisks, colons, and periods indicate fully conserved, strongly similar, and weakly similar residues, respectively.
Figure 3
Figure 3
Functional analysis of p.Arg320His in KV3.1. (a) Representative traces of whole-cell currents recorded in Xenopus laevis oocytes, injected with the same amount of cRNA encoding KV3.1 wild-type (WT) or Arg320His, during 0.5 s voltage steps ranging from −60 mV to +60 mV. (b) Current amplitudes analyzed at the end of the voltage step to +60 mV and normalized to the mean current amplitude of WT (n = 49) recorded on the same day, revealed significantly smaller potassium currents for the Arg320His (n = 50) (Mann-Whitney U test; ***P < 0.001). (c) Western blot analysis of Xenopus laevis oocytes injected with either WT or Arg320His mutant cRNA using a mouse antibody to DDK-tag showed similar bands in total cell lysates in the two representative experiments. H2O-injected oocytes were used as a negative control and actin served as a loading control. The presence of two bands in the blot is likely to be due to N-glycosylation that the KV3.1 protein (expected protein size ~56kDa) is subjected to in vivo and in heterologous expression systems,. (d),(e) A dominant-negative effect of Arg320His mutant on WT channels was determined when a constant amount of the WT cRNA was injected with either H2O or the same amount of Arg320His cRNA in a 1:1 ratio. (d) Representative whole-cell currents recorded as in a were decreased for the co-expression of WT and Arg320His mutant channels. (e) Analysis of current amplitudes at the end of a 0.5-s pulse to +60 mV, followed by normalization to the WT recorded on the same day, revealed that the co-expression with the Arg320His mutant (n = 27) reduced currents by about 4-fold compared to the WT (n = 32) (Student’s t-test; ***P < 0.001). (f) Current-voltage relationships of WT and co-expression of WT with Arg320His channels revealed a leftward shift for the latter, resulting in a significant increase of normalized tail current amplitudes in almost the whole range of analyzed potentials (Student’s t-test; P < 0.001 for −60 mV to +50 mV). Lines represent fits of a Boltzmann function. The V0.5 was 19.6 ± 0.5 mV (n = 19) and 8.0 ± 1.3 mV (n = 16) (Student’s t-test; P < 0.001) and the slope factor k 12.9 ± 0.2 and 10.2 ± 0.3 (Student’s t-test; P < 0.001) for WT and WT/Arg320His co-expression, respectively. Data in b,e,f are presented as means ± s.e.m.

References

    1. Berkovic SF, Andermann F, Carpenter S, Wolfe LS. Progressive Myoclonus Epilepsies: Specific Causes and Diagnosis. N. Engl. J. Med. 1986;315:296–305. - PubMed
    1. Shahwan A, Farrell M, Delanty N. Progressive myoclonic epilepsies: a review of genetic and therapeutic aspects. Lancet Neurol. 2005;4:239–248. - PubMed
    1. Franceschetti S, et al. Progressive myoclonic epilepsies: definitive and still undetermined causes. Neurology. 2014;82:405–411. - PMC - PubMed
    1. Pennacchio LA, et al. Mutations in the Gene Encoding Cystatin B in Progressive Myoclonus Epilepsy (EPM1) Science. 1996;271:1731–1734. - PubMed
    1. Berkovic SF, et al. Array-Based Gene Discovery with Three Unrelated Subjects Shows SCARB2/LIMP-2 Deficiency Causes Myoclonus Epilepsy and Glomerulosclerosis. Am. J. Hum. Genet. 2008;82:673–684. - PMC - PubMed

Publication types

MeSH terms