Comparative Study
. 2015 Jan;47(1):13-21.
doi: 10.1038/ng.3146. Epub 2014 Nov 17.

Spectrum of diverse genomic alterations define non-clear cell renal carcinoma subtypes

Affiliations
Comparative Study

Spectrum of diverse genomic alterations define non-clear cell renal carcinoma subtypes

Steffen Durinck et al. Nat Genet. 2015 Jan.

Abstract

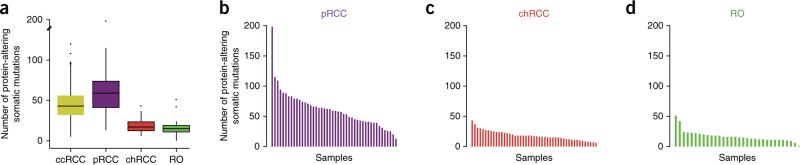
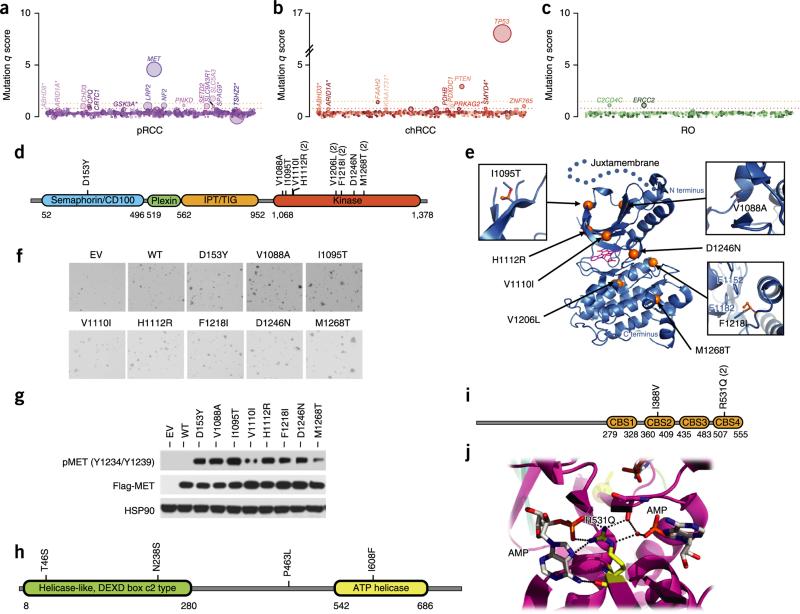
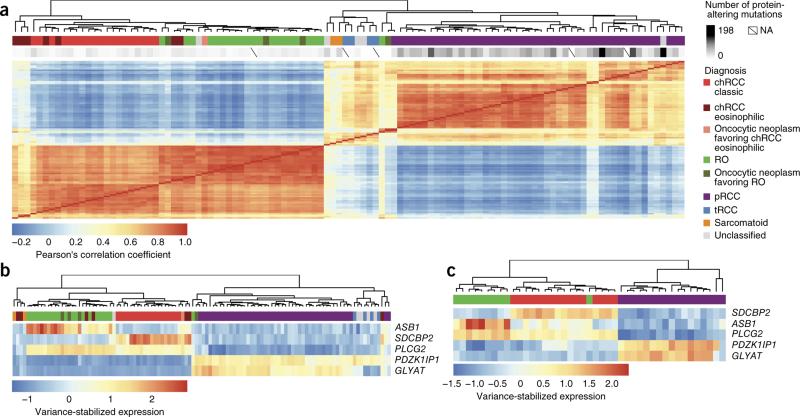
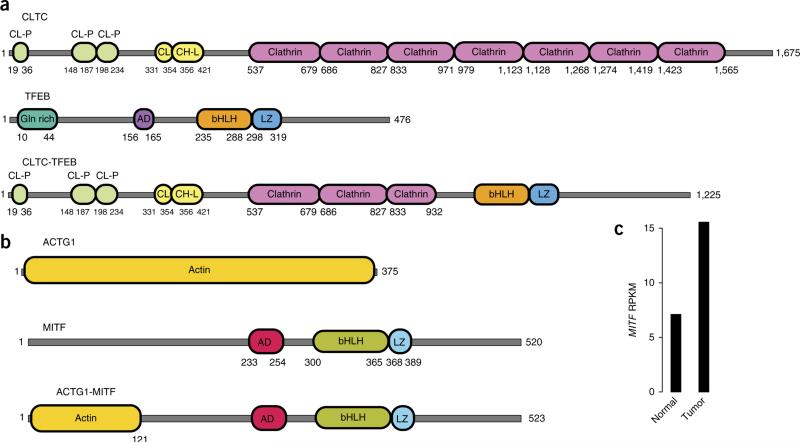
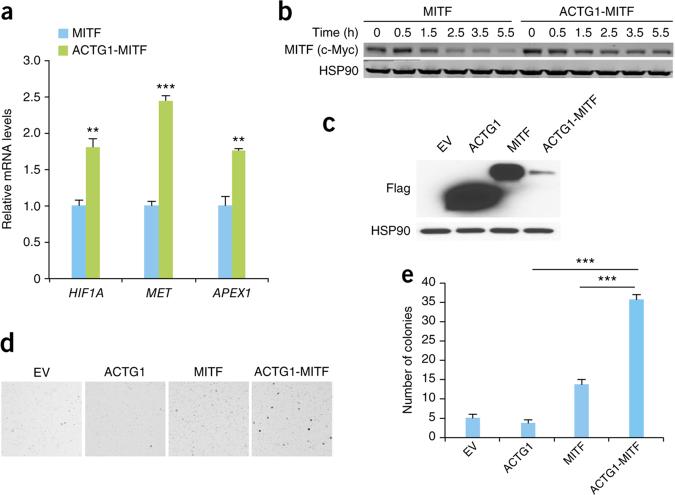
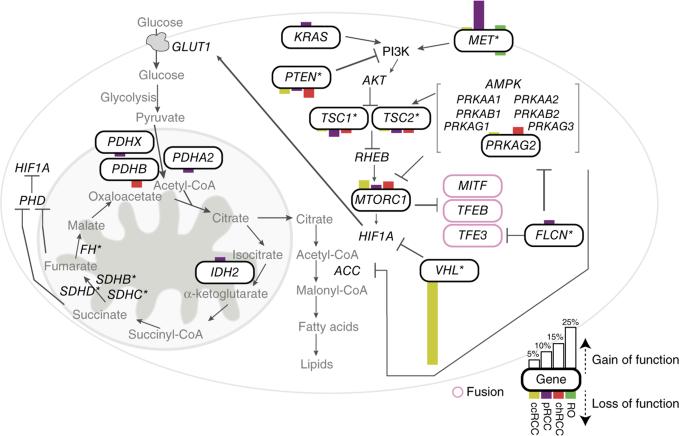
To further understand the molecular distinctions between kidney cancer subtypes, we analyzed exome, transcriptome and copy number alteration data from 167 primary human tumors that included renal oncocytomas and non-clear cell renal cell carcinomas (nccRCCs), consisting of papillary (pRCC), chromophobe (chRCC) and translocation (tRCC) subtypes. We identified ten significantly mutated genes in pRCC, including MET, NF2, SLC5A3, PNKD and CPQ. MET mutations occurred in 15% (10/65) of pRCC samples and included previously unreported recurrent activating mutations. In chRCC, we found TP53, PTEN, FAAH2, PDHB, PDXDC1 and ZNF765 to be significantly mutated. Gene expression analysis identified a five-gene set that enabled the molecular classification of chRCC, renal oncocytoma and pRCC. Using RNA sequencing, we identified previously unreported gene fusions, including ACTG1-MITF fusion. Ectopic expression of the ACTG1-MITF fusion led to cellular transformation and induced the expression of downstream target genes. Finally, we observed upregulation of the anti-apoptotic factor BIRC7 in MiTF-high RCC tumors, suggesting a potential therapeutic role for BIRC7 inhibitors.


Figures

Figure 1
Figure 1
Somatic mutations in nccRCC. (a) Box plot of the number of protein-altering somatic mutations in each tumor subtype in comparison to ccRCC (TCGA data; ref. 4). The median value is shown as a line, with the whiskers extending from the highest value within 1.5 times the interquartile range of the third quartile to the lowest value within 1.5 times the interquartile range of the first quartile. Number of samples used: ccRCC, 417; pRCC, 46; chRCC, 47; renal oncocytoma (RO), 33. (b–d) Bar graphs showing the number of protein-altering somatic mutations observed in each sample for pRCC (b), chRCC (c) and renal oncocytoma (d).
Figure 2
Figure 2
Significantly mutated genes in nccRCC. (a–c) Genes evaluated for significance on the basis of q score are shown for pRCC (a), chRCC (b) and renal oncocytoma (c). Each gene is represented as a circle, where the size of the circle is proportional to the observed mutation frequency. Genes are arranged from left to right along the x axis in alphabetical order. Genes with a significant q score appear above the dotted red line (FDR < 0.15). An asterisk next to a gene name indicates genes with a q score of 0.15 < FDR < 0.2. The dotted orange line represents FDR = 0.05. (d) Schematic depicting the MET alterations. (e) MET alterations mapped onto a crystal structure for the MET kinase domain (PDB, 1R0P). Blue ribbons represent the MET protein. Mutated residues are shown as orange spheres. K-252, an inhibitor, bound to the active site (PDB, 1R0P) is shown as magenta sticks. The dotted line extending beyond the N terminus of the kinase domain is not part of the crystal structure but is included to illustrate the likely location of the juxtamembrane domain. Accompanying panels show the positions of previously unreported alterations of oncogenic relevance. (f) Anchorage-independent colony growth of NIH3T3 cells stably expressing wild-type (WT) or mutant MET. EV, empty vector. (g) Protein blot analysis of the phosphorylation status of MET mutants stably expressed in NIH3T3 cells. pMET, phosphorylated MET. (h) Schematic depicting ERCC2 alterations. (i,j) PRKAG2 alterations depicted on Pfam domains (i) or the protein structure (PDB, 2V8Q) (j). Accession codes for the protein sequences used for the schematics can be found in Supplementary Table 3.
Figure 3
Figure 3
RNA-seq–based classification of nccRCCs. (a) Unsupervised clustering of the samples by sample correlation matrix using the 400 genes with the most variable expression. NA, not available. (b) Clustering of the samples on the basis of a minimal set of five differentially expressed genes. (c) Validation cohort clustering shown using the five-gene set.
Figure 4
Figure 4
Proteins encoded by the CLTC-TFEB and MITF gene fusions. (a) Schematic of the CLTC-TFEB fusion protein resulting from the CLTC-TFEB fusion transcript. (b) Schematic of the ACTG1-MITF fusion protein predicted from the ACTG1-MITF fusion transcript. (c) MITF expression (RPKM, reads per kilobase of target per million mapped reads) in the tumor harboring the MITF fusion. CL-P, clathrin propel; CL, clathrin link; CH-L, clathrin H link; Gln rich, glutamine rich; AD, activation domain; bHLH, basic helix-loop-helix domain; L, leucine zipper. Accession codes for the proteins depicted: CLTC, NP_004850.1; TFEB, P19484.3 (NP_001258873); ACTG1, NP_001186883.1; MITF, NP_937802.1.
Figure 5
Figure 5
ACTG1-MITF gene fusion promotes anchorage-independent growth. (a) Expression of MITF target genes in HEK293T cells expressing wild-type MITF or the ACTG1-MITF fusion protein. The values shown are from three biological replicates (error bars, s.e.m.; **P < 0.01, ***P < 0.001, two-tailed Student's t test). (b) Stability of the MITF fusion protein over time in HEK293T cells transfected with the indicated constructs after cycloheximide treatment, assessed using protein blotting. Cells at time 0 h were not treated with cycloheximide. (c) Protein blot showing the expression of Flag-tagged ACTG1, MITF and ACTG1-MITF fusion proteins in NIH3T3 cell expressing the indicated constructs. HSP90 was used as a loading control. (d) Representative images depicting colony formation by NIH3T3 cells stably expressing the indicated constructs. (e) Quantification of the number of colonies (>300 μm in diameter) shown in d. Data shown are mean values ±s.e.m. from three biological replicates (***P < 0.0001, two-tailed Student's t test).
Figure 6
Figure 6
Integrated analysis of alterations in key pathways in nccRCC subtypes. Shown are mutated genes and their mutational frequencies in the indicated RCC subtypes for MET signaling and metabolism pathways. Mutated genes in the pathway are shown inside a curved-edge rectangle. Bars on top of the curved-edge rectangle indicate mutations that are known or predicted to be activating, and bars on the bottom edge of the curved-edge rectangle indicate mutations known or predicted to be inactivating. The length of each bar is proportional to the frequency of the mutations observed by subtype in this study or the TCGA study (for ccRCC; ref. 4). An asterisk indicates genes with known RCC risk alleles. Enclosed in pink curved-edge rectangles are genes involved in fusions identified in this study.

Comment in

Similar articles

Cited by

References

    1. Siegel R, Naishadham D, Jemal A. Cancer statistics, 2013. CA Cancer J. Clin. 2013;63:11–30. - PubMed
    1. Peña-Llopis S, et al. BAP1 loss defines a new class of renal cell carcinoma. Nat. Genet. 2012;44:751–759. - PMC - PubMed
    1. Sato Y, et al. Integrated molecular analysis of clear-cell renal cell carcinoma. Nat. Genet. 2013;45:860–867. - PubMed
    1. Cancer Genome Atlas Research Network Comprehensive molecular characterization of clear cell renal cell carcinoma. Nature. 2013;499:43–49. - PMC - PubMed
    1. Srigley JR, et al. The International Society of Urological Pathology (ISUP) Vancouver Classification of Renal Neoplasia. Am. J. Surg. Pathol. 2013;37:1469–1489. - PubMed

Publication types

MeSH terms

Supplementary concepts