. 2014 Nov 17;9(11):e112796.
doi: 10.1371/journal.pone.0112796. eCollection 2014.

Mycoplasma gallisepticum lipid associated membrane proteins up-regulate inflammatory genes in chicken tracheal epithelial cells via TLR-2 ligation through an NF-κB dependent pathway

Affiliations

Mycoplasma gallisepticum lipid associated membrane proteins up-regulate inflammatory genes in chicken tracheal epithelial cells via TLR-2 ligation through an NF-κB dependent pathway

Sanjukta Majumder et al. PLoS One. .

Abstract

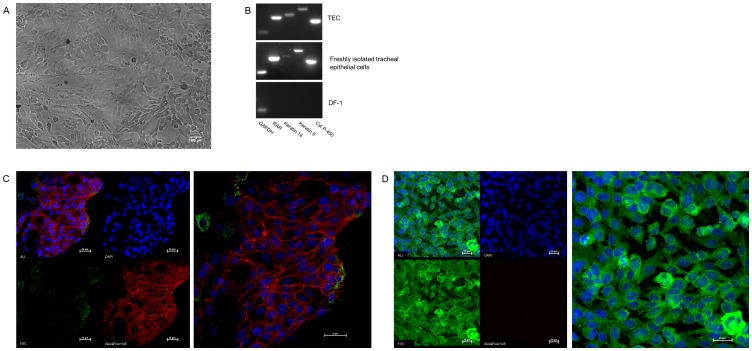
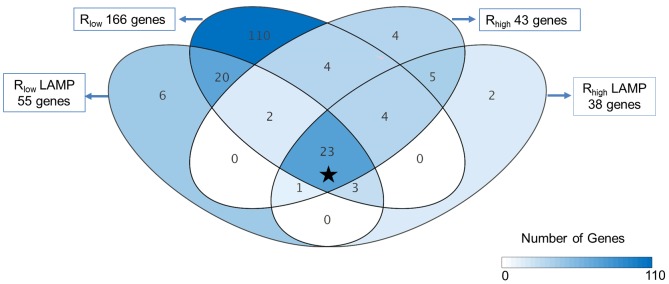
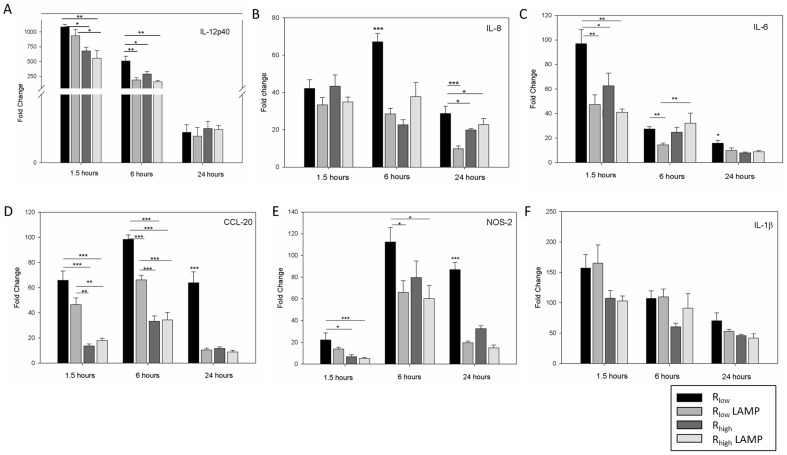
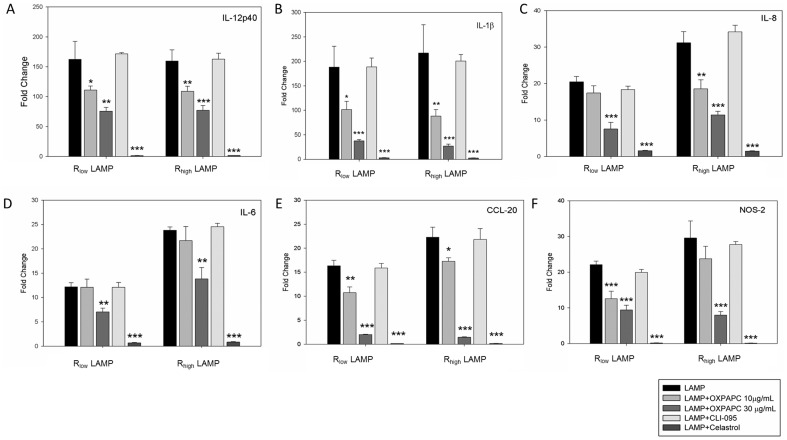
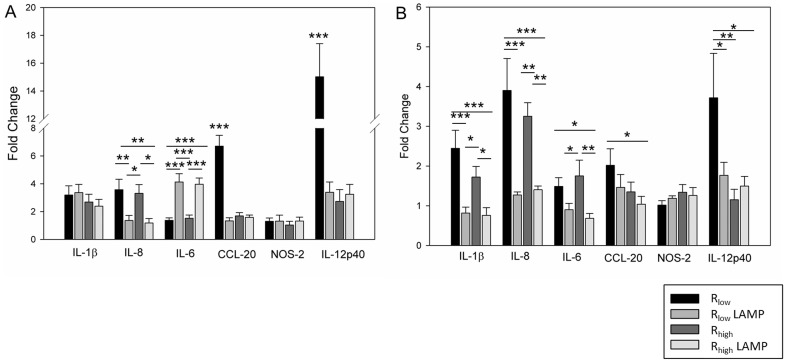
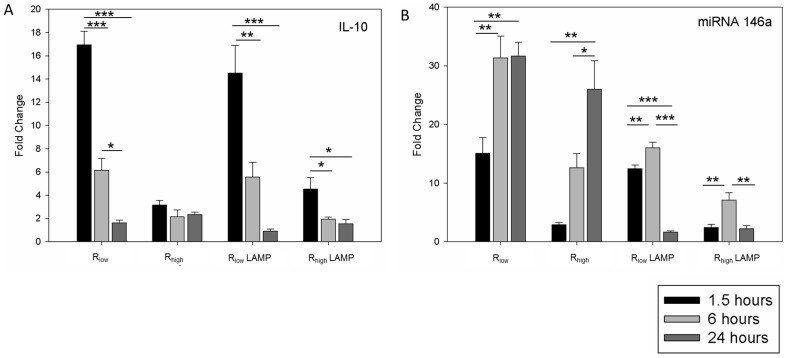
Mycoplasma gallisepticum-mediated respiratory inflammation in chickens is associated with accumulation of leukocytes in the tracheal submucosa. However the molecular mechanisms underpinning these changes have not been well described. We hypothesized that the initial inflammatory events are initiated upon ligation of mycoplasma lipid associated membrane proteins (LAMP) to TLRs expressed on chicken tracheal epithelial cells (TEC). To test this hypothesis, live bacteria or LAMPs isolated from a virulent (R(low)) or a non-virulent (R(high)) strain were incubated with primary TECs or chicken tracheae ex vivo. Microarray analysis identified up-regulation of several inflammatory and chemokine genes in TECs as early as 1.5 hours post-exposure. Kinetic analysis using RT-qPCR identified the peak of expression for most genes to be at either 1.5 or 6 hours. Ex-vivo exposure also showed up-regulation of inflammatory genes in epithelial cells by 1.5 hours. Among the commonly up-regulated genes were IL-1β, IL-6, IL-8, IL-12p40, CCL-20, and NOS-2, all of which are important immune-modulators and/or chemo-attractants of leukocytes. While these inflammatory genes were up-regulated in all four treatment groups, R(low) exposed epithelial cells both in vitro and ex vivo showed the most dramatic up-regulation, inducing over 100 unique genes by 5-fold or more in TECs. Upon addition of a TLR-2 inhibitor, LAMP-mediated gene expression of IL-1β and CCL-20 was reduced by almost 5-fold while expression of IL-12p40, IL-6, IL-8 and NOS-2 mRNA was reduced by about 2-3 fold. Conversely, an NF-κB inhibitor abrogated the response entirely for all six genes. miRNA-146a, a negative regulator of TLR-2 signaling, was up-regulated in TECs in response to either R(low) or R(high) exposure. Taken together we conclude that LAMPs isolated from both R(high) and R(low) induced rapid, TLR-2 dependent but transient up-regulation of inflammatory genes in primary TECs through an NF-κB dependent pathway.


Conflict of interest statement

Competing Interests: The authors have declared that no competing interests exist.

Figures

Figure 1
Figure 1. Primary chicken tracheal epithelial cell culture (TEC).
Primary chicken tracheal epithelial cells were isolated and cultured as described in the Methods section. 1A: Primary chicken tracheal epithelial cells at 100X magnification. 1B: Confirmation of tracheal epithelial cell identity both in vitro and freshly isolated (ex vivo) from tracheae after ex-vivo exposure: PCR amplified epithelial cell specific genes from cDNA in agarose gel, compared to chicken embryonic fibroblast (DF-1) cells. 1C: Tracheal epithelial cells stained for E-cadherin and Vimentin at (400X magnification). Left panel shows TECs at different filter setting Blue (DAPI) for nuclear staining, Green (FITC) for Vimentin and Red (AlexaFluor 546) for E-cadherin, right panel shows merged picture for all filters. 1D: DF-1 fibroblast cells stained for E-cadherin and Vimentin at 400X magnification. Left panel shows DF-1 cells at different filter setting; Blue (DAPI) for nuclear staining, Green (FITC) for Vimentin and Red (AlexaFluor 546) for E-cadherin; right panel shows merged picture for all filters.
Figure 2
Figure 2. Distribution of differentially regulated genes in TECs.
Differentially regulated genes (≥5 fold) in tracheal epithelial cell after exposure to live Rlow, Rhigh or LAMPs isolated from either strain 1.5 hours after exposure. The star (*) in the figure represent commonly up-regulated genes upon all four exposures, from which six follow up genes were chosen. n = 8 (4 biological replicates x2 dye swap technical replicates) for all microarray experiments.
Figure 3
Figure 3. Differential gene expression in TECs post-exposure.
mRNA fold difference in TECs exposed to Rlow, Rlow LAMP, Rhigh or Rhigh LAMP at 1.5, 6 and 24 hours respectively. Samples normalized to housekeeping gene GAPDH and un-exposed TECs as control. n = 6 for all experiments. Results are denoted as fold change ± SEM with all control values set at 1. Significant differences denoted as * = P<0.05, ** = P<0.01, *** = P<0.001. A: IL-12p40 mRNA. B: IL-8 mRNA. C: IL-6 mRNA. D: CCL-20 mRNA. E: NOS-2 mRNA. F: IL-1β mRNA.
Figure 4
Figure 4. Differential gene expression in TECs exposed to LAMPs in the presence of signaling inhibitors.
Epithelial cells were exposed to LAMPs isolated from Rlow or Rhigh in the presence or absence of signaling inhibitors for 6 hours. Samples were normalized to the housekeeping gene GAPDH and un-exposed TECs served as control. n = 6 for all experiments. Results are denoted as fold change ± SEM with all control values set at 1. Significant differences denoted as * = P<0.05, ** = P<0.01, *** = P<0.001. A. IL-12p40. B. IL-1β. C. IL-8. D. IL-6. E. CCL-20. F. NOS-2.
Figure 5
Figure 5. Differential gene expression in tracheal epithelial cells after ex-vivo exposure to LAMPs.
Comparison of mRNA fold difference in tracheal epithelial cells from tracheal explant exposed to Rlow, Rlow LAMP, Rhigh or Rhigh LAMP at 1.5 and 6 hours respectively. Samples normalized to housekeeping gene GAPDH and un-exposed tracheae as control. n = 6 for all experiments. Results are denoted as fold change ± SEM with all control values set at 1. Significant differences denoted as * = P<0.05, ** = P<0.01, *** = P<0.001. A: mRNA fold difference of all genes at 1.5 hours. B: mRNA fold difference of all genes at 6 hours.
Figure 6
Figure 6. RT-qPCR analysis of miRNA and IL-10 differential expression in TECs.
Epithelial cells were exposed to Rlow, Rlow LAMP, Rhigh or Rhigh LAMP at 1.5, 6 and 24 hours respectively. Samples were normalized to housekeeping gene GAPDH and un-exposed TECs as control. n = 6 for all experiments. Results are denoted as fold change ± SEM with all control values set at 1. Significant differences denoted as * = P<0.05, ** = P<0.01, *** = P<0.001. A: mRNA fold difference of IL-10 in TECs at all three time points post exposure. B: mRNA fold difference of miRNA-146a in TECs at all three time points post exposure.

Similar articles

Cited by

References

    1. Sato S, Nonomura I, Shimizu F, Shoya S, Horiuchi T (1970) Mixed infection with Mycoplasma gallisepticum and the B1 strain of Newcastle disease virus in chickens. Natl Inst Anim Health Q (Tokyo) 10: 58–65. - PubMed
    1. Gaunson JE, Philip CJ, Whithear KG, Browning GF (2000) Lymphocytic infiltration in the chicken trachea in response to Mycoplasma gallisepticum infection. Microbiology 146 (Pt5): 1223–1229. - PubMed
    1. Stipkovits L, Egyed L, Palfi V, Beres A, Pitlik E, et al. (2012) Effect of low-pathogenicity influenza virus H3N8 infection on Mycoplasma gallisepticum infection of chickens. Avian Pathol 41: 51–57. - PubMed
    1. Winner F, Rosengarten R, Citti C (2000) In vitro cell invasion of Mycoplasma gallisepticum . Infect Immun 68: 4238–4244. - PMC - PubMed
    1. Vogl G, Plaickner A, Szathmary S, Stipkovits L, Rosengarten R, et al. (2008) Mycoplasma gallisepticum invades chicken erythrocytes during infection. Infect Immun 76: 71–77. - PMC - PubMed

Publication types

MeSH terms

Associated data