. 2014 Nov 13;19(11):18493-510.
doi: 10.3390/molecules191118493.

Pterocarpan-enriched soy leaf extract ameliorates insulin sensitivity and pancreatic β-cell proliferation in type 2 diabetic mice

Affiliations

Pterocarpan-enriched soy leaf extract ameliorates insulin sensitivity and pancreatic β-cell proliferation in type 2 diabetic mice

Un-Hee Kim et al. Molecules. .

Abstract

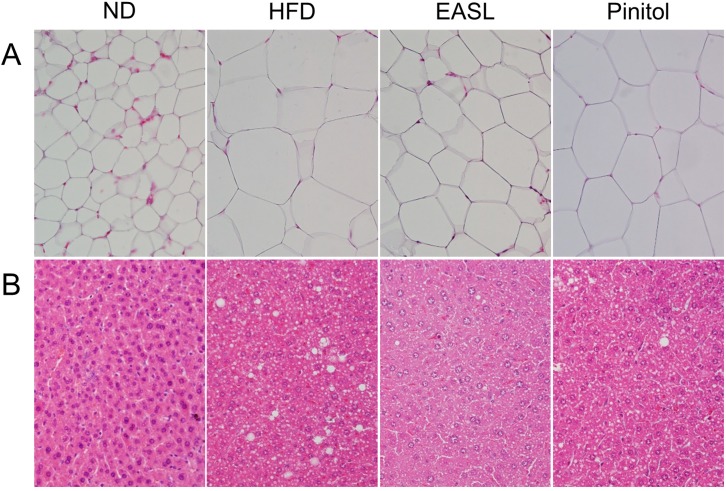
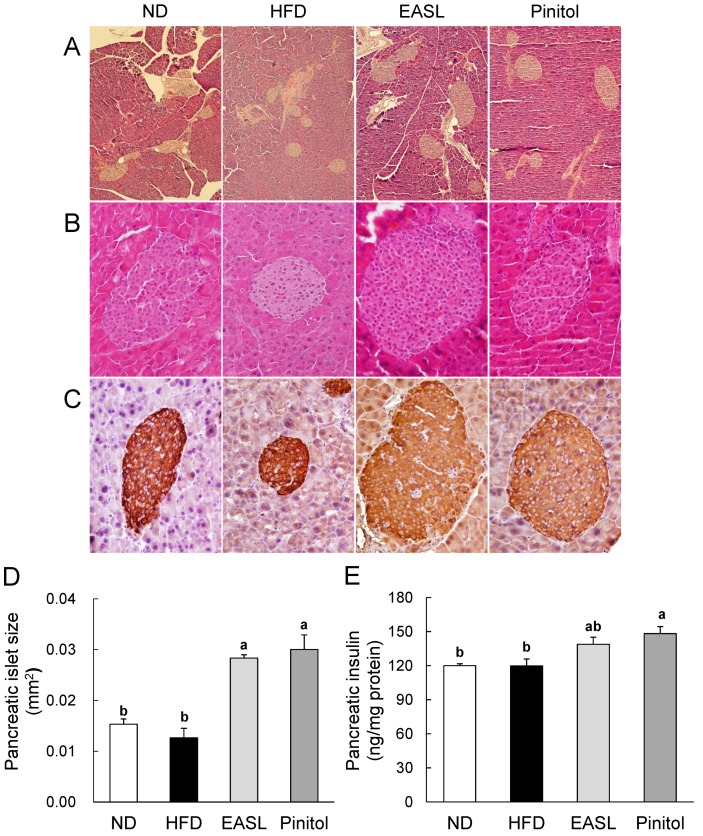
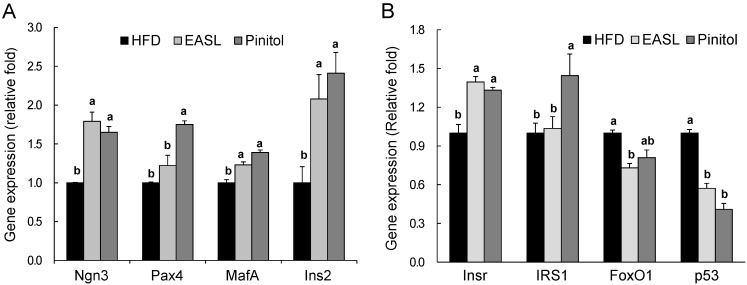
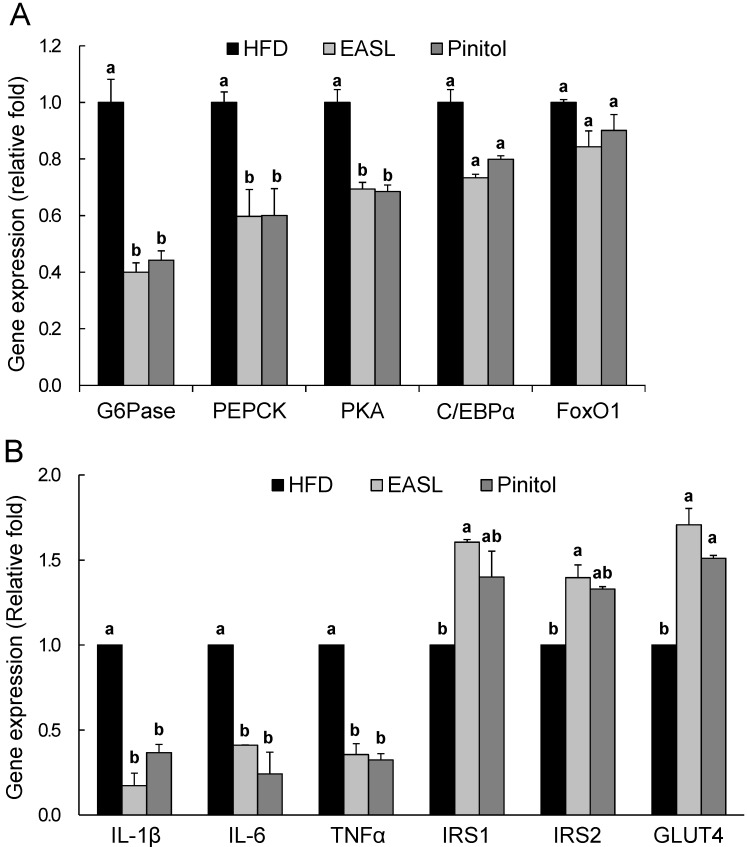
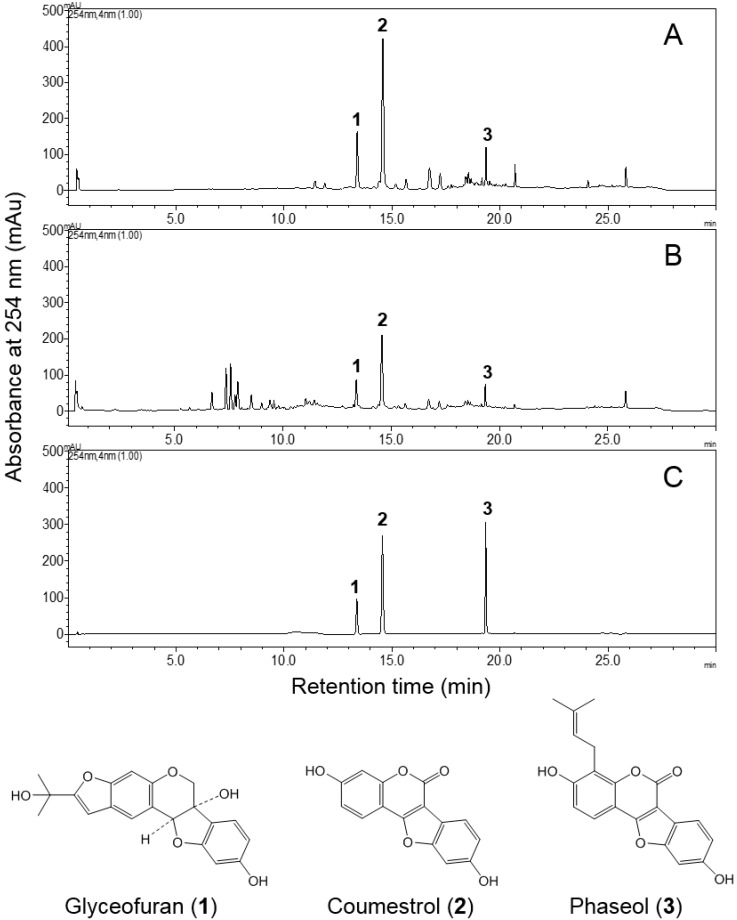
In Korea, soy (Glycine max (L.) Merr.) leaves are eaten as a seasonal vegetable or pickled in soy sauce. Ethyl acetate extracts of soy leaves (EASL) are enriched in pterocarpans and have potent α-glucosidase inhibitory activity. This study investigated the molecular mechanisms underlying the anti-diabetic effect of EASL in C57BL/6J mice with high-fat diet (HFD)-induced type 2 diabetes. Mice were randomly divided into normal diet (ND), HFD (60 kcal% fat diet), EASL (HFD with 0.56% (wt/wt) EASL), and Pinitol (HFD with 0.15% (wt/wt) pinitol) groups. Weight gain and abdominal fat accumulation were significantly suppressed by EASL. Levels of plasma glucose, HbA1c, and insulin in the EASL group were significantly lower than those of the HFD group, and the pancreatic islet of the EASL group had greater size than those of the HFD group. EASL group up-regulated neurogenin 3 (Ngn3), paired box 4 (Pax4), and v-maf musculoaponeurotic fibrosarcoma oncogene homolog A (MafA), which are markers of pancreatic cell development, as well as insulin receptor substrate 1 (IRS1), IRS2, and glucose transporter 4 (GLUT4), which are related to insulin sensitivity. Furthermore, EASL suppressed genes involved in hepatic gluconeogenesis and steatosis. These results suggest that EASL improves plasma glucose and insulin levels in mice with HDF-induced type 2 diabetes by regulating β-cell proliferation and insulin sensitivity.


Conflict of interest statement

The authors declare no conflict of interest.

Figures

Figure 1
Figure 1
Histology of the white adipose tissue (WAT) (A) and liver (B) with hematoxylin and eosin (H&E) staining in HFD-fed C57BL/6J mice (400× original magnification).
Figure 2
Figure 2
Effect of EASL supplementation on the pancreatic dysfunction in HFD-fed C57BL/6J mice. Histology of the pancreas with H&E (A,B) and insulin immunohistochemical (IHC) (C) staining. Magnification 100× (A) and 400× (B,C). The mean size of pancreatic islet (D) expressed in mm2. Pancreatic insulin levels (E). Pancreas was isolated and homogenized to measure pancreatic insulin levels. Values are presented as mean ± SE. a,b Means not sharing a common letter are significantly different between groups (p < 0.05).
Figure 3
Figure 3
Effects of EASL supplementation on the relative mRNA expression levels of pancreatic genes related to β-cell development (A) or insulin sensitivity (B). The levels of mRNA in pancreatic tissue were measured by real-time quantitative RT-PCR (qRT-PCR) and normalized to glyceraldehyde-3-phosphate dehydrogenase (GAPDH) expression. Values are presented as mean ± SE. a,b Means not sharing a common letter are significantly different between groups (p < 0.05).
Figure 4
Figure 4
Effects of EASL dietary supplementation on the relative mRNA expression levels of genes in the liver and WAT. Expression was measured by qRT-PCR for genes involved in gluconeogenesis (A) and insulin sensitivity (B) and then normalized to GAPDH expression. Values are presented as mean ± SE. a,b Means not sharing a common letter are significantly different between groups (p < 0.05).
Figure 5
Figure 5
HPLC chromatograms of EASL (A), 95% EtOH extract (B) from soy leaves, and the external standards 1, 2, and 3 (C) and their chemical structures. The HPLC chromatograms were detected at 254 nm. Peaks: 1, glyceofuran (TR: 13.36 min); 2, coumestrol (TR: 14.55 min); and 3, Phaseol (TR: 19.33 min). The mean peak areas of 1, 2, and 3 were 12.5%, 36.6%, and 5.4%, respectively, in EASL; the mean peak areas of 1, 2, and 3 were 6.2%, 19.5%, and 3.3%, respectively, in 95% ethanol extract.

References

    1. Shaw J.E., Sicree R.A., Zimmet P.Z. Global estimates of the prevalence of diabetes for 2010 and 2030. Diabetes Res. Clin. Pract. 2010;87:4–14. doi: 10.1016/j.diabres.2009.10.007. - DOI - PubMed
    1. American Diabetes Association Diagnosis and Classification of Diabetes Mellitus. Diabetes Care. 2010;33:S62–S69. - PMC - PubMed
    1. Kahn S.E., Hull R.L., Utzschneider K.M. Mechanisms linking obesity to insulin resistance and type 2 diabetes. Nature. 2006;444:840–846. doi: 10.1038/nature05482. - DOI - PubMed
    1. Donath M.Y., Ehses J.A., Maedler K., Schumann D.M., Ellingsgaard H., Eppler E., Reinecke M. Mechanisms of β-Cell Death in Type 2 Diabetes. Diabetes. 2005;54:S108–S113. doi: 10.2337/diabetes.54.suppl_2.S108. - DOI - PubMed
    1. Leto D., Saltiel A.R. Regulation of glucose transport by insulin: Traffic control of GLUT4. Nat. Rev. Mol. Cell Biol. 2012;13:383–396. doi: 10.1038/nrm3351. - DOI - PubMed

Publication types

MeSH terms