. 2015 Jan;16(1):118-28.
doi: 10.1038/ni.3036. Epub 2014 Nov 17.

TLR7 induces anergy in human CD4(+) T cells

Affiliations

TLR7 induces anergy in human CD4(+) T cells

Margarita Dominguez-Villar et al. Nat Immunol. 2015 Jan.

Abstract

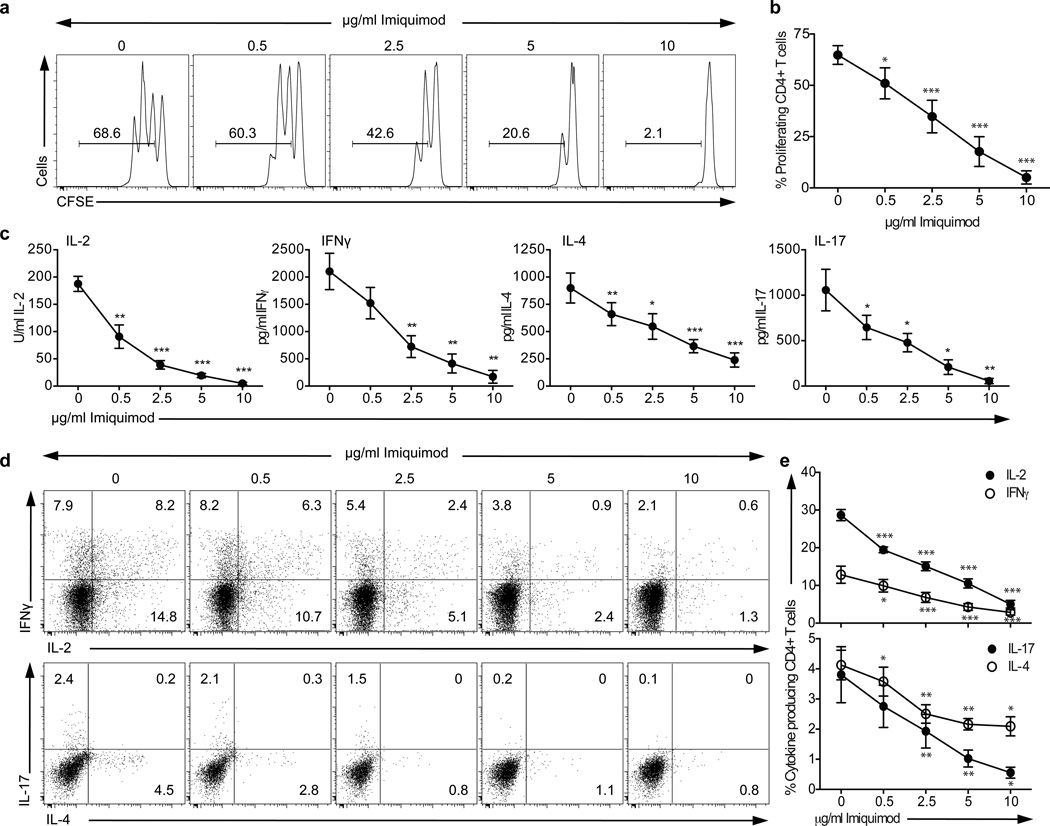
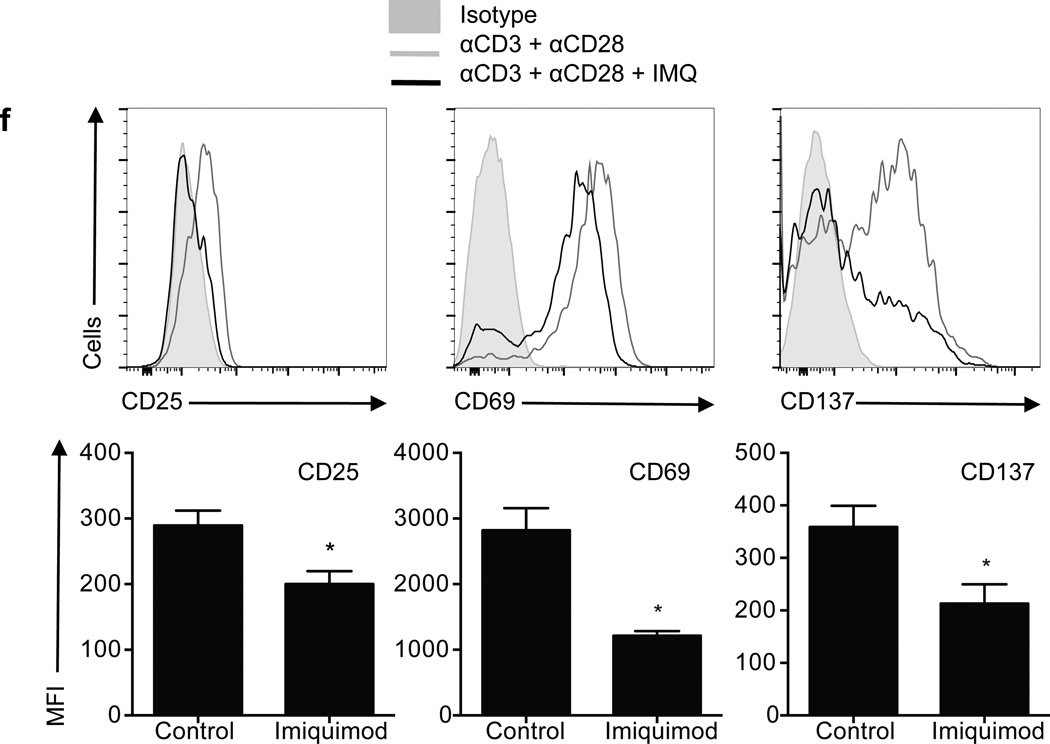
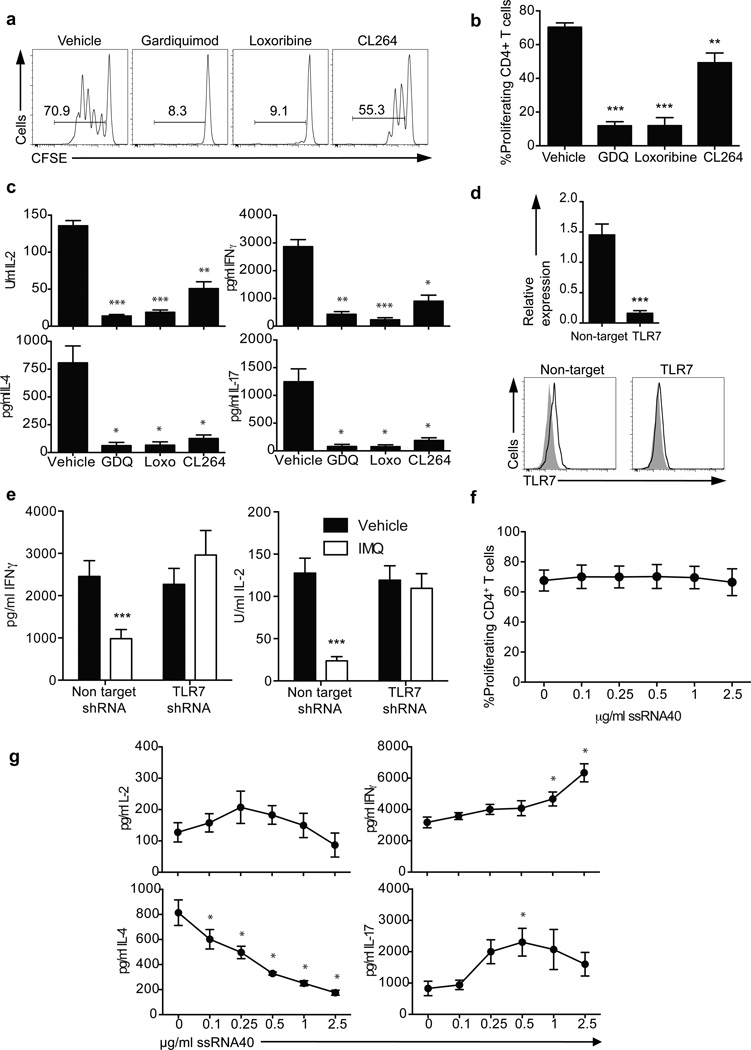
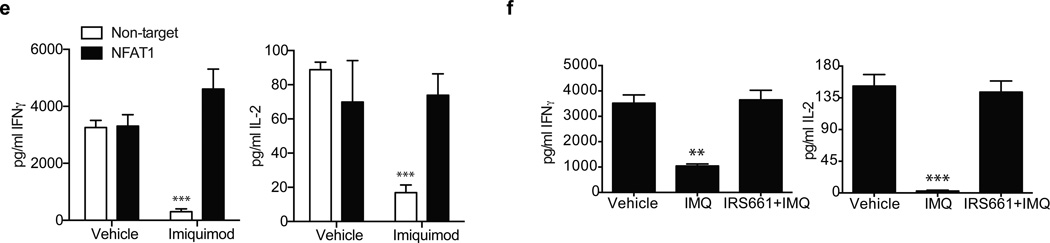
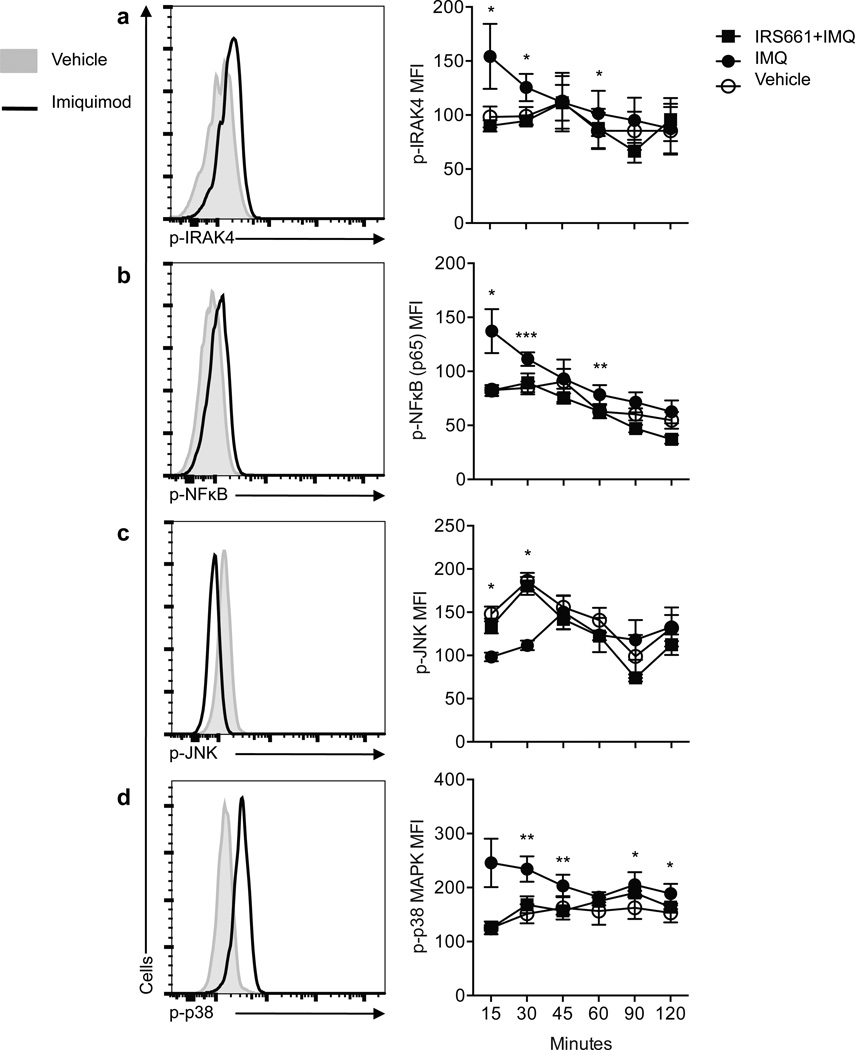
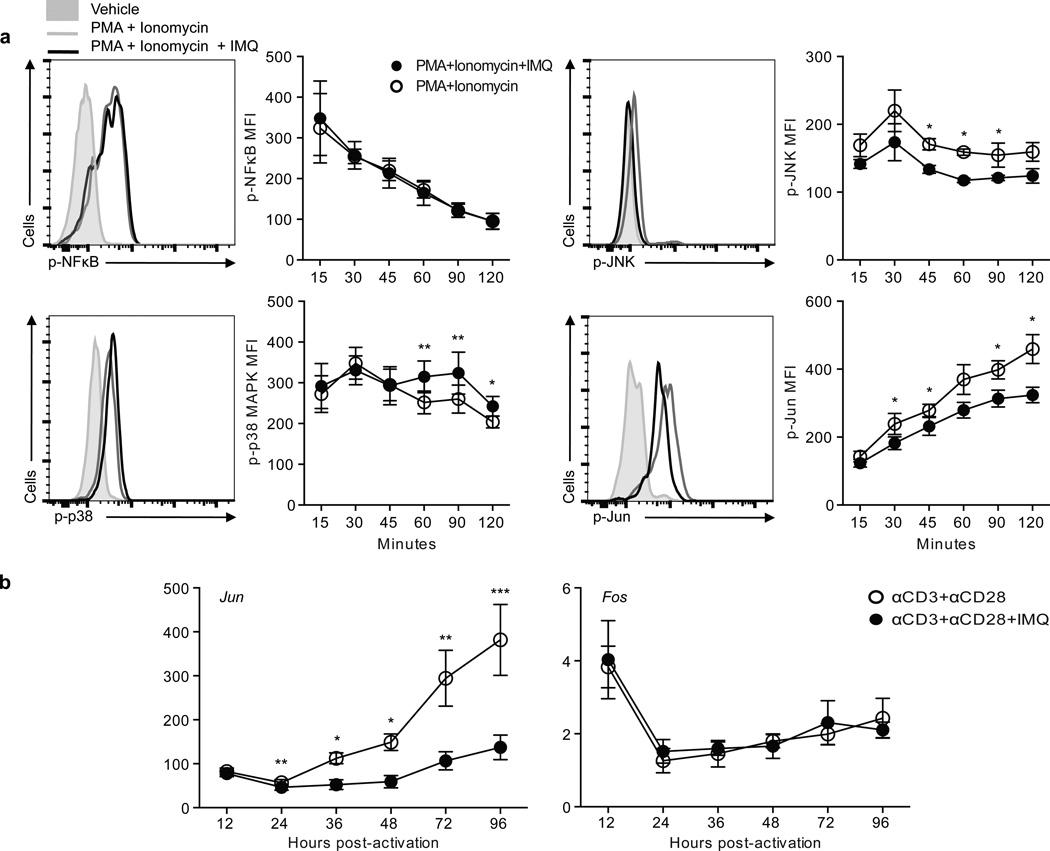
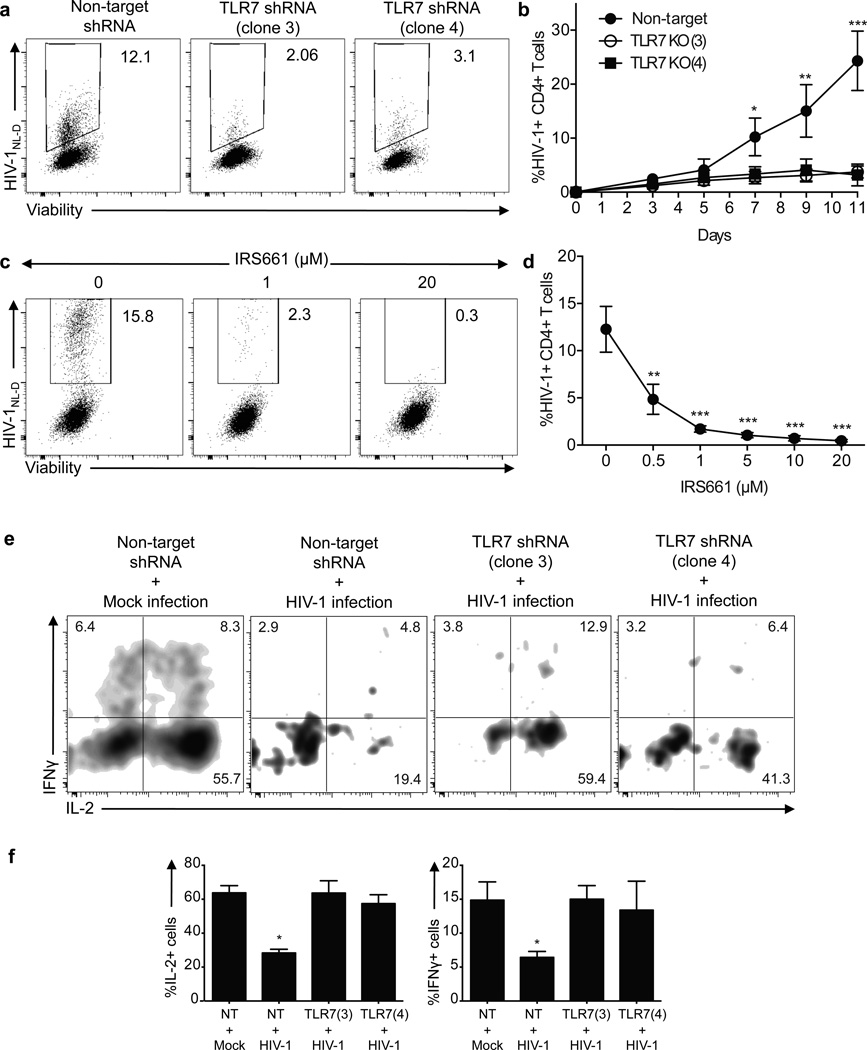
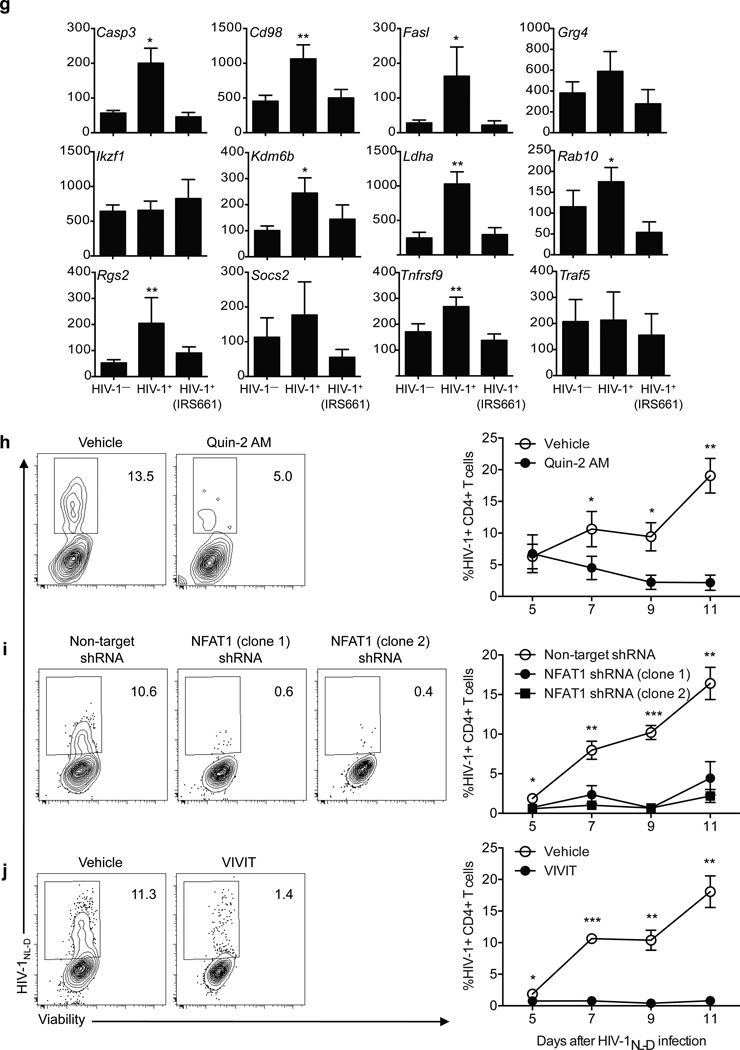
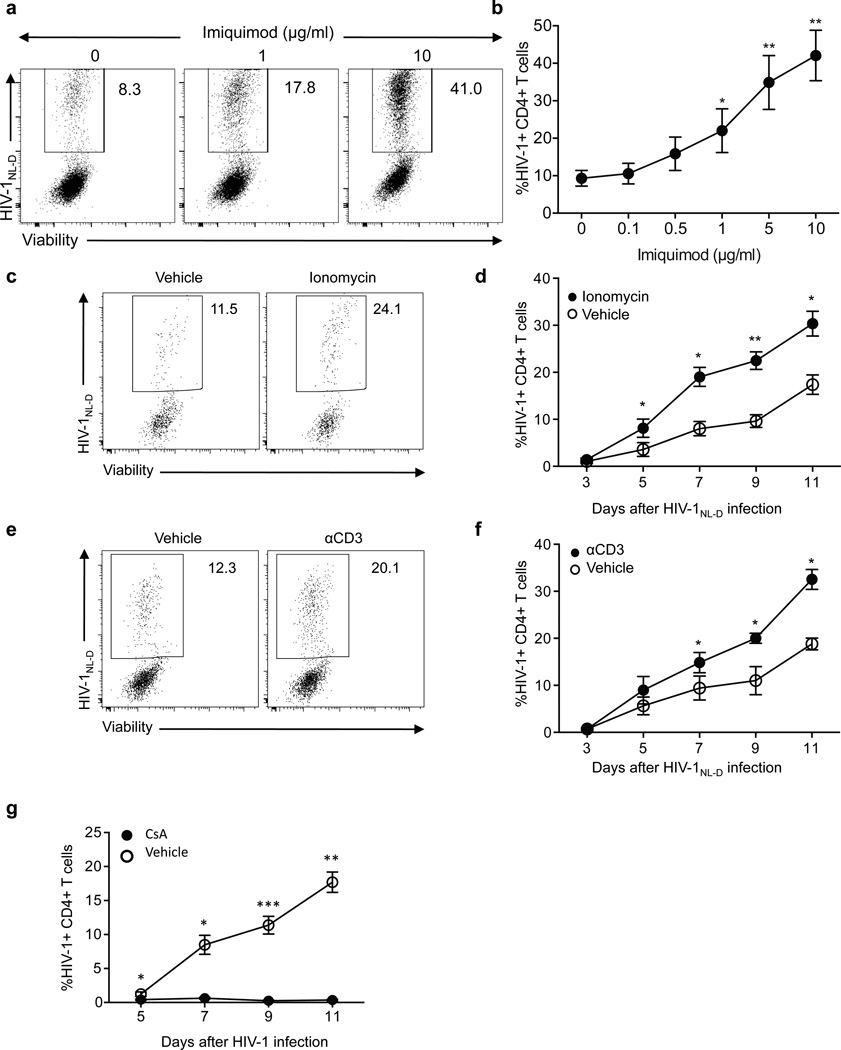
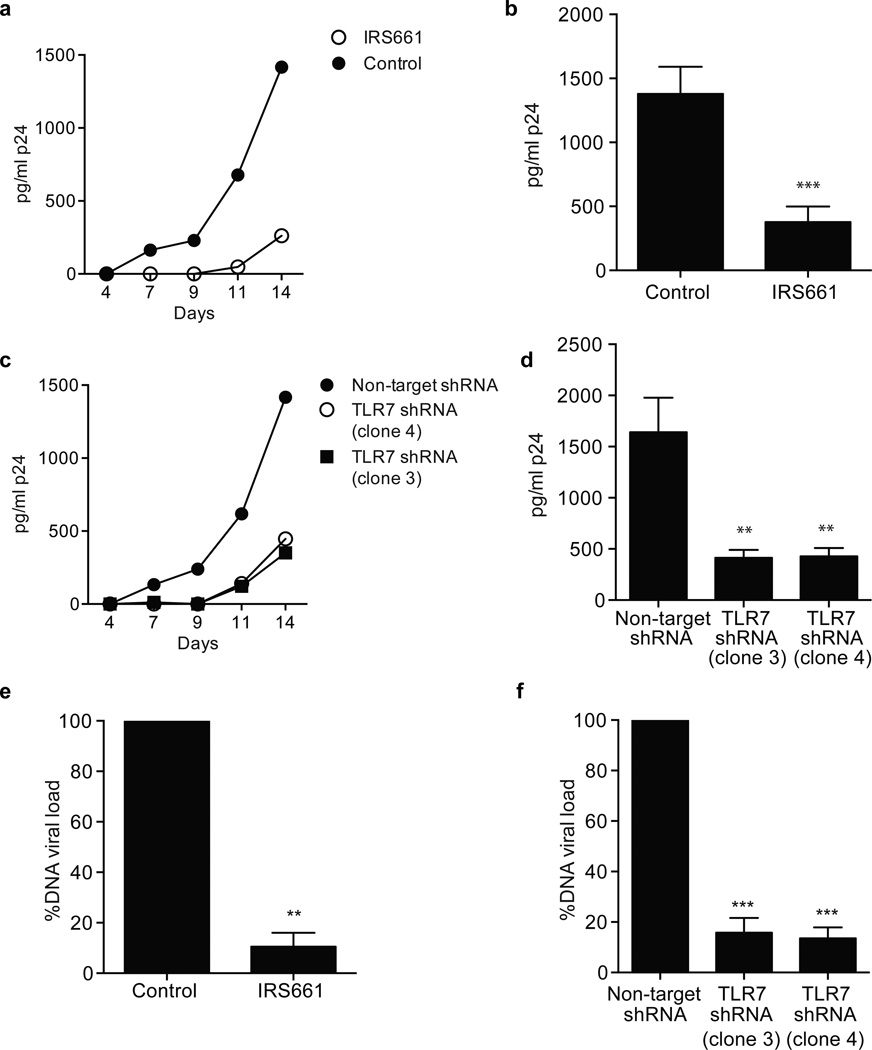
The recognition of microbial patterns by Toll-like receptors (TLRs) is critical for activation of the innate immune system. Although TLRs are expressed by human CD4(+) T cells, their function is not well understood. Here we found that engagement of TLR7 in CD4(+) T cells induced intracellular calcium flux with activation of an anergic gene-expression program dependent on the transcription factor NFATc2, as well as unresponsiveness of T cells. As chronic infection with RNA viruses such as human immunodeficiency virus type 1 (HIV-1) induces profound dysfunction of CD4(+) T cells, we investigated the role of TLR7-induced anergy in HIV-1 infection. Silencing of TLR7 markedly decreased the frequency of HIV-1-infected CD4(+) T cells and restored the responsiveness of those HIV-1(+) CD4(+) T cells. Our results elucidate a previously unknown function for microbial pattern-recognition receptors in the downregulation of immune responses.


Figures

Figure 1
Figure 1
TLR7 signaling inhibits proliferation and cytokine secretion on CD4+ T cells. CD4+ T cells were stimulated for four days in the presence of different concentrations of Imiquimod (IMQ). a. Histograms show CFSE-labeled CD4+ T cell proliferation after 3 days of stimulation. Numbers in histograms represent the frequency of viable proliferating CD4+ T cells. b. Frequency of viable proliferating CD4+ T cells stimulated in the presence of different concentrations of IMQ. c. Cytokine secretion measured by ELISA after 3 days. d. Intracellular staining after a 4 hour PMA and ionomycin stimulation at day four. e. Frequency of cytokine-producing CD4+ T cells. f. Representative example of the expression (upper row) and MFI (lower row) of CD25 (left), CD69 (middle) and CD137 (right panel) on stimulated cells in the presence (black open histogram) or absence (gray open histogram) of IMQ as compared to isotype control (gray curve). Statistical analyses represent mean± s.e.m. of eight independent experiments with one donor each, performed for a and c, and six independent experiments with one donor each for e and f. * p<0.05, ** p<0.005, *** p<0.0005.
Figure 1
Figure 1
TLR7 signaling inhibits proliferation and cytokine secretion on CD4+ T cells. CD4+ T cells were stimulated for four days in the presence of different concentrations of Imiquimod (IMQ). a. Histograms show CFSE-labeled CD4+ T cell proliferation after 3 days of stimulation. Numbers in histograms represent the frequency of viable proliferating CD4+ T cells. b. Frequency of viable proliferating CD4+ T cells stimulated in the presence of different concentrations of IMQ. c. Cytokine secretion measured by ELISA after 3 days. d. Intracellular staining after a 4 hour PMA and ionomycin stimulation at day four. e. Frequency of cytokine-producing CD4+ T cells. f. Representative example of the expression (upper row) and MFI (lower row) of CD25 (left), CD69 (middle) and CD137 (right panel) on stimulated cells in the presence (black open histogram) or absence (gray open histogram) of IMQ as compared to isotype control (gray curve). Statistical analyses represent mean± s.e.m. of eight independent experiments with one donor each, performed for a and c, and six independent experiments with one donor each for e and f. * p<0.05, ** p<0.005, *** p<0.0005.
Figure 2
Figure 2
The inhibitory effect of IMQ is TLR7-specific. CD4+ T cells were stimulated for 3 days in the presence of the TLR7 agonists GDQ, Loxoribine and CL264. a. Histograms show CFSE-labeled CD4+ T cell proliferation 3 days after stimulation. Numbers in histograms represent the frequency of viable proliferating CD4+ T cells. b. Frequency of viable proliferating CD4+ T cells. c. Cytokine secretion measured by ELISA after 3 days. d. CD4+ T cells were stimulated in the presence of a shRNA specific for TLR7 (clone TRCN0000056973) or a non-target control. Transduced cells were sorted based on GFP expression at day 5 and TLR7 RNA (upper) and protein (lower) expression were examined. Histograms represent isotype control (gray histograms) and TLR7 (open histograms). e. Non-target and TLR7 shRNA-transduced CD4+ T cells were stimulated in the presence (white bars) or absence (black bars) of IMQ for 3 days and IL-2 and IFN-γ secretion was measured by ELISA. f. CFSE-labeled CD4+ T cells were stimulated with anti-CD3 and anti-CD28 in the presence of different doses of ssRNA40. Statistical analysis of the frequency of proliferating CD4+ T cells with increasing concentrations of ssRNA40 (n=4 donors in 4 independent experiments). g. IL-2, IFN-γ, IL-4 and IL-17 secretion measured at day 3 after activation by ELISA (n=4 donors in 4 independent experiments). Statistical analysis represents mean±s.e.m. of seven independent experiments performed for a, b, d and e, five experiments for c and four experiments for f and g. * p<0.05, ** p<0.005, *** p<0.0005.
Figure 3
Figure 3
Mechanism of TLR7-induced anergy. a. Plots represent calcium fluxes as measured by Indo-1AM ratio over time in CD4+ T cells stimulated with two concentrations of IMQ (upper), ionomycin (lower left) or ssRNA40-LyoVec™ (lower right). Arrows indicate the addition of IMQ. b. Calcium flux in CD4+ T cells pre-incubated for one hour with a control sequence (black) or a specific TLR7 inhibitory sequence (10 µM IRS661, gray) and stimulated with 5 µg/ml IMQ. c. Dephosphorylated/phosphorylated NFAT1 ratio at 0, 45 and 90 minutes after IMQ treatment as measured by immunoblot with an anti-NFAT1 antibody (below). Bar charts represent normalized phospho-NFAT intensity at 0, 10, 20, 30 and 40 minutes after stimulation with IMQ. d. Anergy-related genes expression on CD4+ T cells stimulated with vehicle, IMQ or IRS661+IMQ for 2 hours. e. Non-target (white bars) and NFAT1 (black bars) shRNA-transduced CD4+ T cells were stimulated in the presence or absence of IMQ for 3 days and IL-2 and IFN-γ secretion was measured by ELISA. f. CD4+ T cells were incubated with vehicle and IMQ in the presence or absence or IRS661 for two hours, washed and stimulated with anti-CD3 and anti-CD28 for 2 days after a 12 hour resting period. IFN-γ and IL-2 were measured by ELISA. Statistical analysis represents mean±s.e.m. of 6 independent experiments performed for a and b, 5 experiments for c and d, 3 experiments for e and 4 experiments for Fig. f (each experiment with one donor). * p<0.05, ** p<0.005, *** p<0.0005.
Figure 3
Figure 3
Mechanism of TLR7-induced anergy. a. Plots represent calcium fluxes as measured by Indo-1AM ratio over time in CD4+ T cells stimulated with two concentrations of IMQ (upper), ionomycin (lower left) or ssRNA40-LyoVec™ (lower right). Arrows indicate the addition of IMQ. b. Calcium flux in CD4+ T cells pre-incubated for one hour with a control sequence (black) or a specific TLR7 inhibitory sequence (10 µM IRS661, gray) and stimulated with 5 µg/ml IMQ. c. Dephosphorylated/phosphorylated NFAT1 ratio at 0, 45 and 90 minutes after IMQ treatment as measured by immunoblot with an anti-NFAT1 antibody (below). Bar charts represent normalized phospho-NFAT intensity at 0, 10, 20, 30 and 40 minutes after stimulation with IMQ. d. Anergy-related genes expression on CD4+ T cells stimulated with vehicle, IMQ or IRS661+IMQ for 2 hours. e. Non-target (white bars) and NFAT1 (black bars) shRNA-transduced CD4+ T cells were stimulated in the presence or absence of IMQ for 3 days and IL-2 and IFN-γ secretion was measured by ELISA. f. CD4+ T cells were incubated with vehicle and IMQ in the presence or absence or IRS661 for two hours, washed and stimulated with anti-CD3 and anti-CD28 for 2 days after a 12 hour resting period. IFN-γ and IL-2 were measured by ELISA. Statistical analysis represents mean±s.e.m. of 6 independent experiments performed for a and b, 5 experiments for c and d, 3 experiments for e and 4 experiments for Fig. f (each experiment with one donor). * p<0.05, ** p<0.005, *** p<0.0005.
Figure 4
Figure 4. IMQ inhibits JNK phosphorylation
CD4+ T cells were stimulated for 2 hours with IMQ or vehicle. Histograms on the left show a representative example of the expression of the following phosphorylated molecules: IRAK4 (a), NF-κB p65 (b), JNK (c) and p38 (d) at 30 minutes after stimulation in vehicle- (gray histogram) or IMQ-treated (dark open histogram) CD4+ T cells. Diagrams on the right show the statistical analysis of 8 independent experiments with one donor each performed. *p<0.05, **p<0.005, ***p<0.0005.
Figure 5
Figure 5
IMQ inhibits JNK and Jun activation after full CD4+ T cell stimulation. CD4+ T cells were stimulated for 2 hours with PMA and Ionomycin in the presence or absence of IMQ. a. Histograms show a representative example of the expression of phosphorylated molecules (NF-κB p65, JNK, p38 cJun) at 60 minutes after activation in PMA+Ionomycin- (gray open histogram) or PMA+Ionomycin+IMQ-treated (dark open histogram) CD4+ T cells as compared to vehicle (gray histogram). Plots show the kinetics analysis of phosphorylation of 8 independent experiments performed with one donor each (right). b. Kinetics of FOS and JUN mRNA gene expression after stimulation of CD4+ T cells in the presence (black) or absence (white) of IMQ, shown as mean±s.e.m. of n=4 donors in 4 independent experiments. *p<0.05, **p<0.005, ***p<0.0005.
Figure 6
Figure 6
TLR7 and NFAT knock down abolishes HIV-1 infection. a. Dot plots show a representative example of the frequency of viable HIV-1+ CD4+ T cells on non-target (left dot plot, NT) or TLR7 shRNA-transduced CD4+ T cells (middle and right dot plots, shRNA clones 3 and 4) at day 7 after infection. b. Kinetics of HIV-1NL-D infection on non-target (NT) or TLR7 shRNA-transduced CD4+ T cells (TLR7(3) and TLR7(4)) (n=5 donors in 5 independent experiments). c. Dot plots show a representative example of the frequency of viable HIV-1+ CD4+ T cells stimulated in the presence of various doses of IRS661 for two days and infected with HIV-1NL-D at day 7 after infection. d. Frequency of HIV-1+ CD4+ T cells incubated with different doses of IRS661 (n=5 donors in 5 independent experiments). e. CD4+ T cells were stimulated with anti-CD3 and anti-CD28 in the presence of two TLR7 shRNA (clones 3 and 4) or non-target control (NT) and after two days the cells were infected with HIV-1 or mock (left panel). Dot plots show a representative example of IFN-γ and IL-2 secretion after a four-hour PMA and ionomycin stimulation at day 7 after infection. f. Frequency of IL-2- and IFN-γ-producing CD4+ T cells (n=4 donors in 4 independent experiments). g. Anergy-related gene expression on HIV-1+CD4+ T cells in vitro infected with HIV-1 in the presence of IRS661 or a control sequence. HIV-1+ cells were sorted at day 7 after infection (n=6 donors in 6 independent experiments). h. CD4+ T cells were pre-incubated with Quin-2 AM and infected with HIV-1. Dot plots show the frequency of viable HIV-1+CD4+ T cells at day 7 after infection. Right diagram shows the kinetic analysis of 6 independent experiments performed with one donor each. i. CD4+ T cells were stimulated in the presence of two NFAT1-specific shRNA (middle and right dot plots) or a non-target shRNA as a control (left dot plot) and infected with HIV-1 two days later. Dot plots show the frequency of viable HIV-1+CD4+ T cells at day 7 after infection. Diagram on the right shows the statistical analysis of 6 independent experiments performed with one donor each. j. CD4+ T cells were pre-incubated with VIVIT peptide and infected with HIV-1. Dot plots show the frequency of viable HIV-1+CD4+ T cells at day 7 after infection. Right diagram shows the kinetic analysis of 6 independent experiments performed with one donor each, shown as mean±s.e.m. * p<0.05, ** p<0.005, *** p<0.0005.
Figure 6
Figure 6
TLR7 and NFAT knock down abolishes HIV-1 infection. a. Dot plots show a representative example of the frequency of viable HIV-1+ CD4+ T cells on non-target (left dot plot, NT) or TLR7 shRNA-transduced CD4+ T cells (middle and right dot plots, shRNA clones 3 and 4) at day 7 after infection. b. Kinetics of HIV-1NL-D infection on non-target (NT) or TLR7 shRNA-transduced CD4+ T cells (TLR7(3) and TLR7(4)) (n=5 donors in 5 independent experiments). c. Dot plots show a representative example of the frequency of viable HIV-1+ CD4+ T cells stimulated in the presence of various doses of IRS661 for two days and infected with HIV-1NL-D at day 7 after infection. d. Frequency of HIV-1+ CD4+ T cells incubated with different doses of IRS661 (n=5 donors in 5 independent experiments). e. CD4+ T cells were stimulated with anti-CD3 and anti-CD28 in the presence of two TLR7 shRNA (clones 3 and 4) or non-target control (NT) and after two days the cells were infected with HIV-1 or mock (left panel). Dot plots show a representative example of IFN-γ and IL-2 secretion after a four-hour PMA and ionomycin stimulation at day 7 after infection. f. Frequency of IL-2- and IFN-γ-producing CD4+ T cells (n=4 donors in 4 independent experiments). g. Anergy-related gene expression on HIV-1+CD4+ T cells in vitro infected with HIV-1 in the presence of IRS661 or a control sequence. HIV-1+ cells were sorted at day 7 after infection (n=6 donors in 6 independent experiments). h. CD4+ T cells were pre-incubated with Quin-2 AM and infected with HIV-1. Dot plots show the frequency of viable HIV-1+CD4+ T cells at day 7 after infection. Right diagram shows the kinetic analysis of 6 independent experiments performed with one donor each. i. CD4+ T cells were stimulated in the presence of two NFAT1-specific shRNA (middle and right dot plots) or a non-target shRNA as a control (left dot plot) and infected with HIV-1 two days later. Dot plots show the frequency of viable HIV-1+CD4+ T cells at day 7 after infection. Diagram on the right shows the statistical analysis of 6 independent experiments performed with one donor each. j. CD4+ T cells were pre-incubated with VIVIT peptide and infected with HIV-1. Dot plots show the frequency of viable HIV-1+CD4+ T cells at day 7 after infection. Right diagram shows the kinetic analysis of 6 independent experiments performed with one donor each, shown as mean±s.e.m. * p<0.05, ** p<0.005, *** p<0.0005.
Figure 7
Figure 7
Calcium-induced anergy favors HIV-1 replication. a. CD4+ T cells were stimulated in the presence of different doses of IMQ for two days and infected with HIV-1NL-D. Dot plots show a representative example of frequency of viable HIV-1+ CD4+ T cells at day 7 after infection. b. Dose-dependent effect of IMQ on the frequency of HIV-1+ CD4+ T cells (n=3 independent experiments with one donor each). c. Frequency of viable HIV-1+CD4+ T cells pre-incubated with ionomycin (right) or vehicle (left) and infected with HIV-1 at day 9 after infection. d. Kinetic analysis of the frequency of HIV-1+ CD4+ T cells pre-incubated with ionomycin (n=6 donors in 6 independent experiments). e. Frequency of viable HIV-1+CD4+ T cells pre-incubated with anti-CD3 (right) or vehicle (left) and infected with HIV-1 at day 9 after infection. f. Kinetic analysis of the frequency of HIV-1+ CD4+ T cells pre-incubated with anti-CD3 (n=6 donors in 6 independent experiments). g. CD4+ T cells were stimulated with anti-CD3 and anti-CD28 for two days and cyclosporine was added to the cultures six hours before HIV-1 infection. Diagrams show the frequency of HIV-1-infected CD4+ T cells after cyclosporine addition at different time points as mean±s.e.m. (n=6 donors in 6 independent experiments)* p<0.05, ** p<0.005, *** p<0.0005.
Figure 8
Figure 8. TLR7 inhibition decreases infection in HIV-1+ patients
a. p24 concentration at different time points in CD4+ T cells isolated from a representative HIV-1-infected patient and stimulated for 14 days in the presence of IRS661 (open circle) or control sequence (black). b. p24 concentration at day 14 in CD4+ T cells isolated from HIV-1-infected patients and stimulated in the presence of IRS661 or a control (Ctrl) sequence (9 patients in 7 independent experiments). c. p24 concentration at different time points in CD4+ T cells isolated from a representative HIV-1-infected patient and stimulated for 14 days in the presence of a non-specific target shRNA (NT) or two different TLR7 shRNA clones (TLR7 (3) and (4)). d. p24 concentration at day 14 in CD4+ T cells isolated from HIV-1-infected patients and stimulated in the presence of of a non-specific target shRNA (NT) or two different TLR7 shRNA clones (n=9 patients in 7 independent experiments). e. DNA proviral load in CD4+ T cells from five HIV-1-infected patients stimulated for 11 days in the presence of IRS661 or a control (Ctrl) sequence. f. DNA proviral load in CD4+ T cells from five HIV-1-infected patients stimulated for 11 days in the presence of a non-target shRNA (NT) or two TLR7-specific shRNAs. * p<0.05, ** p<0.005, *** p<0.0005. Errors bars represent mean ± s.e.m.

Comment in

  • A surprising role for TLR7.
    Lederman MM. Lederman MM. Nat Immunol. 2015 Jan;16(1):8-9. doi: 10.1038/ni.3051. Nat Immunol. 2015. PMID: 25521672 No abstract available.

Similar articles

Cited by

References

    1. Song DH, Lee JO. Sensing of microbial molecular patterns by Toll-like receptors. Immunological reviews. 2012;250(1):216–229. - PubMed
    1. Diebold SS, Kaisho T, Hemmi H, Akira S, Reis e Sousa C. Innate antiviral responses by means of TLR7-mediated recognition of single-stranded RNA. Science. 2004;303(5663):1529–1531. - PubMed
    1. Heil F, Hemmi H, Hochrein H, Ampenberger F, Kirschning C, Akira S, et al. Species-specific recognition of single-stranded RNA via toll-like receptor 7 and 8. Science. 2004;303(5663):1526–1529. - PubMed
    1. Kugelberg E. Innate immunity: Making mice more human the TLR8 way. Nature reviews Immunology. 2014;14(1):6. - PubMed
    1. Kawai T, Akira S. Innate immune recognition of viral infection. Nature immunology. 2006;7(2):131–137. - PubMed

Publication types

MeSH terms