Development and use of an administrative claims measure for profiling hospital-wide performance on 30-day unplanned readmission
- PMID: 25402406
- PMCID: PMC4235629
- DOI: 10.7326/M13-3000
Development and use of an administrative claims measure for profiling hospital-wide performance on 30-day unplanned readmission
Abstract
Background: Existing publicly reported readmission measures are condition-specific, representing less than 20% of adult hospitalizations. An all-condition measure may better measure quality and promote innovation.
Objective: To develop an all-condition, hospital-wide readmission measure.
Design: Measure development study.
Setting: 4821 U.S. hospitals.
Patients: Medicare fee-for-service beneficiaries aged 65 years or older.
Measurements: Hospital-level, risk-standardized unplanned readmissions within 30 days of discharge. The measure uses Medicare fee-for-service claims and is a composite of 5 specialty-based, risk-standardized rates for medicine, surgery/gynecology, cardiorespiratory, cardiovascular, and neurology cohorts. The 2007-2008 admissions were randomly split for development and validation. Models were adjusted for age, principal diagnosis, and comorbid conditions. Calibration in Medicare and all-payer data was examined, and hospital rankings in the development and validation samples were compared.
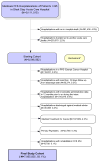
Results: The development data set contained 8 018 949 admissions associated with 1 276 165 unplanned readmissions (15.9%). The median hospital risk-standardized unplanned readmission rate was 15.8 (range, 11.6 to 21.9). The 5 specialty cohort models accurately predicted readmission risk in both Medicare and all-payer data sets for average-risk patients but slightly overestimated readmission risk at the extremes. Overall hospital risk-standardized readmission rates did not differ statistically in the split samples (P = 0.71 for difference in rank), and 76% of hospitals' validation-set rankings were within 2 deciles of the development rank (24% were more than 2 deciles). Of hospitals ranking in the top or bottom deciles, 90% remained within 2 deciles (10% were more than 2 deciles) and 82% remained within 1 decile (18% were more than 1 decile).
Limitation: Risk adjustment was limited to that available in claims data.
Conclusion: A claims-based, hospital-wide unplanned readmission measure for profiling hospitals produced reasonably consistent results in different data sets and was similarly calibrated in both Medicare and all-payer data.
Primary funding source: Centers for Medicare & Medicaid Services.
Figures


References
-
- Jencks SF, Williams MV, Coleman EA. Rehospitalizations among patients in the Medicare fee-for-service program. N Engl J Med. 2009;360(14):1418–28. - PubMed
Publication types
MeSH terms
Grants and funding
LinkOut - more resources
Full Text Sources
Other Literature Sources
Medical
