. 2014 Dec;32(12):1276-81.
doi: 10.1038/nbt.3053. Epub 2014 Nov 17.

Tunable protein degradation in bacteria

Affiliations

Tunable protein degradation in bacteria

D Ewen Cameron et al. Nat Biotechnol. 2014 Dec.

Abstract

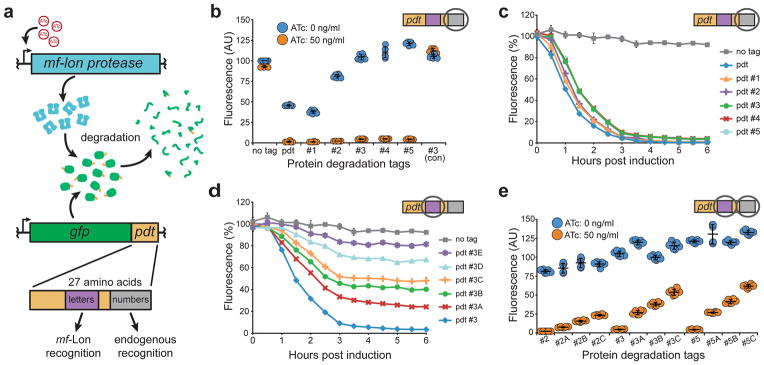
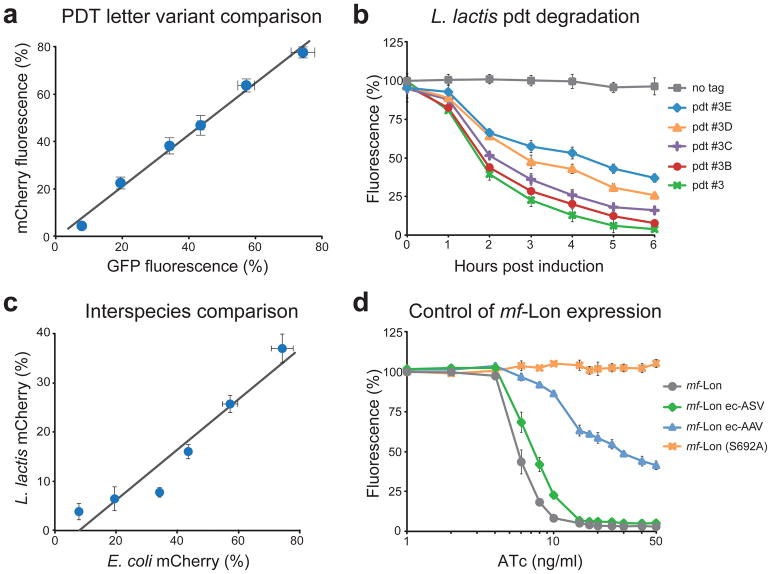
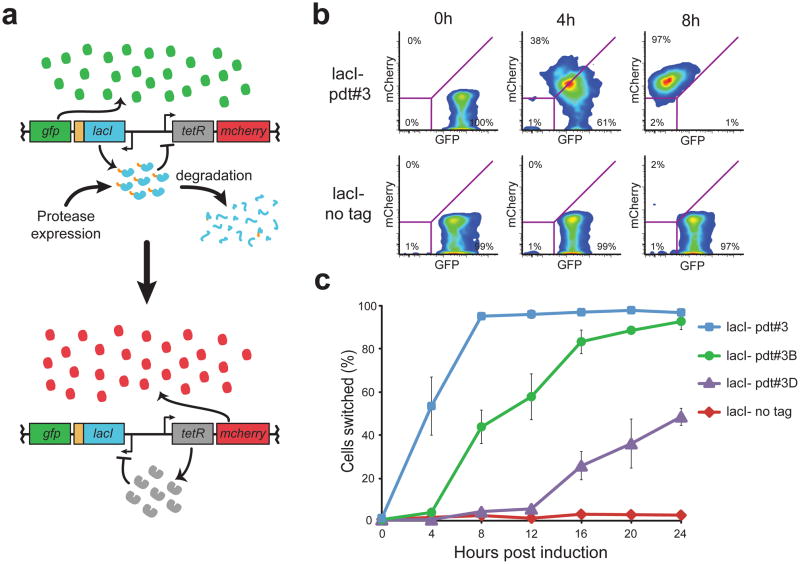
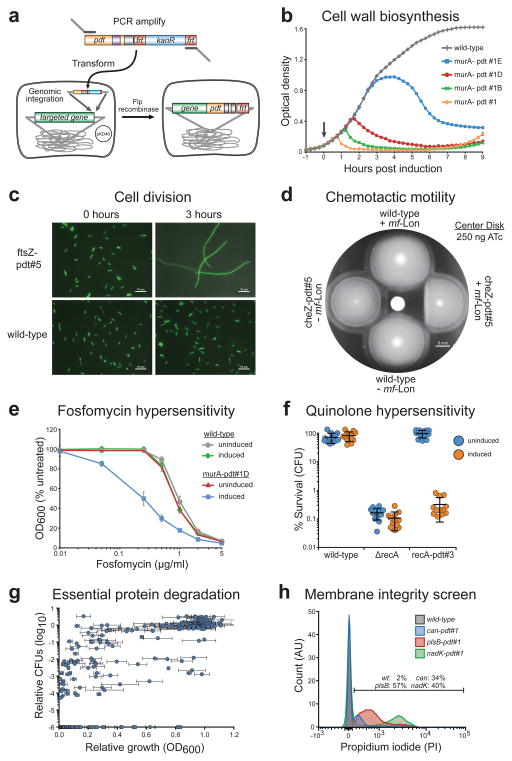
Tunable control of protein degradation in bacteria would provide a powerful research tool. Here we use components of the Mesoplasma florum transfer-messenger RNA system to create a synthetic degradation system that provides both independent control of steady-state protein level and inducible degradation of targeted proteins in Escherichia coli. We demonstrate application of this system in synthetic circuit development and control of core bacterial processes and antibacterial targets, and we transfer the system to Lactococcus lactis to establish its broad functionality in bacteria. We create a 238-member library of tagged essential proteins in E. coli that can serve as both a research tool to study essential gene function and an applied system for antibiotic discovery. Our synthetic protein degradation system is modular, does not require disruption of host systems and can be transferred to diverse bacteria with minimal modification.


Conflict of interest statement

COMPETING FINANCIAL INTERESTS STATEMENT

The authors have submitted a patent application related to the work described here.

Figures

Figure 1
Figure 1. Protein degradation tag characterization
(a) Schematic of the tunable protein degradation system where anhydrotetracycline (ATc) induced mf-Lon expression allows the protease to degrade constitutively expressed GFP in a pdt-dependent manner. Mutations in two pdt regions produced tag variants with altered recognition by mf-Lon (letters) or endogenous E. coli proteases (numbers). (b) Dot plot of pdt number variants that show altered steady-state levels. Fluorescence was measured by flow cytometry 6 hours after ATc induction of cells in exponential growth. As an experimental control, the pdt#3 variant was tested in a strain that did not contain the mf-Lon expression cassette (#3 con). Fluorescence units are arbitrary, with untagged GFP set to 100, and show the mean of six biological replicates. P < 0.001 for ATc induction of each pdt variant except #3 (con). (c–d) Flow cytometry measurements of GFP degradation following mf-Lon induction with 50 ng/ml ATc. Data show the geometric mean fluorescence of at least 5,000 cells as a percentage of the non-induced control for each pdt variant. (c) Pdt number variants maintain similar mf-Lon-mediated degradation dynamics. (d) Pdt letter variants display altered mf-Lon-mediated degradation rates. (e) Dot plot of hybrid pdt variants. Strains expressing the indicated GFP-pdt fusion were measured by flow cytometry 6 hours after ATc induction. Fluorescence units are arbitrary with untagged GFP set to 100, and show the mean of six biological replicates. P < 0.001 for ATc induction of each pdt variant. The data in all panels show the mean of at least three biological replicates, and the error bars show the standard deviation.
Figure 2
Figure 2. Pdt system characterization
(a) Comparative analysis of pdt-mediated degradation of mCherry and GFP. Pdt letter variants were fused to GFP and mCherry, and the percent fluorescence remaining after mf-Lon induction is shown (50 ng/ml ATc for 6 h). Fluorescent data were collected by flow cytometry, and the pdt variants shown are pdt#3, #3A, #3B, #3C, #3D, #3E, listed in order of increasing percent fluorescence. The best-fit line by linear regression is y=1.09× – 0.01 with an R2 value of 0.98 and standard errors of 0.03 and 0.01 for the slope and y-intercept, respectively. (b) Pdt-dependent degradation of mCherry in L. lactis. Nisin induced mf-Lon expression in L. lactis causes pdt-dependent mCherry degradation. Data show the geometric mean fluorescence as a percent of the fluorescence of uninduced cells. Nisin induction was 3 ng/ml. (c) Comparative analysis of pdt letter variants in E. coli and L. lactis. Pdt letter variants were fused to mCherry, and the percent fluorescence remaining after mf-Lon induction is shown (6 hour induction, E. coli: 50 ng/ml ATc and L. lactis: 3 ng/ml nisin). Fluorescent data were collected by flow cytometry, and the pdt variants shown are pdt#3, #3A, #3B, #3C, #3D, #3E, listed in order of increasing percent fluorescence. The best-fit line by linear regression is y=0.51× – 0.04 with an R2 value of 0.91 and standard errors of 0.03 and 0.02 for the slope and y-intercept, respectively. (d) Transcription and post-translation-based control of mf-Lon-mediated pdt degradation. Inducible transcription provides control of mf-Lon-mediated degradation of GFP-pdt#3 across a range of ATc induction levels. Fusion of the E. coli ssrA tag variants ec-AAV and ec-ASV to mf-Lon shift the GFP degradation profile, and inactivation of mf-Lon protease activity (S692A) blocks GFP degradation. Data were collected 6 hours after ATc induction using GFP-pdt#3 as the degradation target. For all panels, the data show the mean of at least three biological replicates and the error bars show the standard deviation.
Figure 3
Figure 3. Protease-driven control of a synthetic toggle switch
(a) Schematic of the synthetic toggle switch in which reciprocal transcriptional repression by TetR and LacI form a bistable circuit. GFP and mCherry serve as fluorescent reporters for the LacI+ and TetR+ toggle states, respectively. Addition of a pdt tag to LacI enables a protease-driven switch from the GFP+ to the mCherry+ state. (b) Flow cytometry scatter plots show GFP and mCherry fluorescence 0, 4 and 8 hours after mf-Lon expression from the inducible promoter PBAD. Degradation of LacI-pdt#3 causes the toggle to switch from the GFP+ state to the mCherry+ state by 8 hours, while the untagged toggle remains in the GFP+ state. Magenta lines indicate the gate parameters used to define the GFP+ and mCherry+ states: cells bounded in the lower left quadrant are considered negative for both GFP and mCherry. (c) The percentage of cells in the mCherry+ state following mf-Lon induction with 1 mM arabinose. Data collected by flow cytometry were measured using the parameters shown in (b) and represent the mean of three biological replicates. For all LacI-pdt variants, P < 0.001 when compared to untagged LacI at 24 hours after induction. Error bars show the standard deviation. See Supplementary Figure 6 for data showing that non-induced strains did not shift to mCherry+.
Figure 4
Figure 4. Tunable control of endogenous bacterial systems and antibacterial targets
(a) Schematic of our recombineering method for genomic insertion of pdt variants, adapted from Datsenko and Wanner. Red recombinase-assisted insertion of the desired pdt variant is followed by Flp recombinase-mediated excision of the accompanying kanR cassette. The resulting insertion contains the C-terminal pdt variant fusion and a 106 bp scar including the remaining FRT site. (b) Growth of strains following protease-driven depletion of MurA. Protease induction during early exponential phase growth (arrow) causes cells containing murA-pdt#1 to lyse within 1 hour, as measured by optical density (OD600). Cells containing the weakened pdt letter variants show a delayed response. Error bars show the standard deviation from the mean of six biological replicates. See Supplementary Figure 7 for data showing wild-type growth of non-induced cells. (c) DIC-fluorescence overlay images of cells after ATc induction for 3 hours. Cells containing ftsZ-pdt#5 form filaments while untagged wild-type bacteria maintain normal length. The fluorescence micrograph overlay showing constitutive GFP expression serves as a visual aid. Scale bars are 10 μm. (d) Disk diffusion assay on a chemotactic motility plate shows loss of chemotactic motility due to pdt-dependent CheZ degradation. Cells were stabbed into the chemotaxis plate following addition of 250 ng ATc to the center disk. Scale bar is 6 mm. (e) Cells containing murA-pdt#1D show increased sensitivity to fosfomycin upon simultaneous induction with 4 ng/ml ATc (induced). OD600 measurements were taken 4 hours after ATc and fosfomycin treatment and are presented as a percent of the OD600 of cells not exposed to fosfomycin (untreated). In the murA-pdt#1D strain, P < 0.001 when comparing uninduced and induced cells for fosfomycin concentrations between 0.05 and 2 μg/ml. See Supplementary Figure 8 for additional data. (f) Pdt-dependent degradation of RecA causes hypersensitivity to the quinolone norfloxacin that matches the known hypersensitivity of a recA deletion strain (ΔrecA). Where indicated, cells were induced with 50 ng/ml ATc for 2 hours before treatment with norfloxacin (25 ng/ml) for 2 hours. Survival was measured by colony forming units (CFU) and is presented as a percent of CFUs measured immediately before norfloxacin treatment. P < 0.001 for ATc induction of the recA-pdt#3 strain. (g) Scatter plot displaying the relative growth and CFU count of EPD library members after targeted mf-Lon degradation. Growth and CFU measurements are displayed as a ratio of induced/uninduced cells at 4 hours after ATc induction (50 ng/ml). CFU data points were placed at 1.0 × 10⁻⁶, the limit of detection, when colonies were not recovered from the induced well. Error bars show the standard deviation from the mean of three biological replicates. CFU ratios represent a single experiment. See Supplementary Table 2 for details. (h) Histogram of propidium iodide (PI) staining for EPD member plsB-pdt#1. PI was measured by flow cytometry 2 hours after induction with 50 ng/ml ATc. The percentage of cells that are PI+ is displayed. The data are normalized to mode and are representative of three biological replicates.

References

    1. Guzman LM, Belin D, Carson MJ, Beckwith J. Tight regulation, modulation, and high-level expression by vectors containing the arabinose PBAD promoter. Journal of bacteriology. 1995;177:4121–4130. - PMC - PubMed
    1. Lutz R, Bujard H. Independent and tight regulation of transcriptional units in Escherichia coli via the LacR/O, the TetR/O and AraC/I1-I2 regulatory elements. Nucleic Acids Res. 1997;25:1203–1210. - PMC - PubMed
    1. Isaacs FJ, et al. Engineered riboregulators enable post-transcriptional control of gene expression. Nat Biotechnol. 2004;22:841–847. - PubMed
    1. Lou C, Stanton B, Chen YJ, Munsky B, Voigt CA. Ribozyme-based insulator parts buffer synthetic circuits from genetic context. Nat Biotechnol. 2012;30:1137–1142. - PMC - PubMed
    1. Janssen BD, Hayes CS. The tmRNA ribosome-rescue system. Adv Protein Chem Struct Biol. 2012;86:151–191. - PMC - PubMed

Publication types

MeSH terms