. 2014 Dec;16(12):1180-91.
doi: 10.1038/ncb3064. Epub 2014 Nov 17.

Inactivation of the ferroptosis regulator Gpx4 triggers acute renal failure in mice

Affiliations

Inactivation of the ferroptosis regulator Gpx4 triggers acute renal failure in mice

Jose Pedro Friedmann Angeli et al. Nat Cell Biol. 2014 Dec.

Abstract

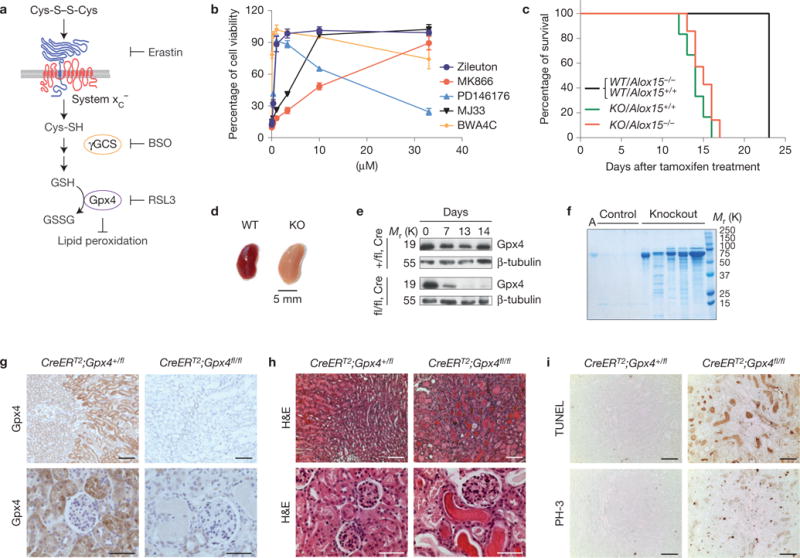
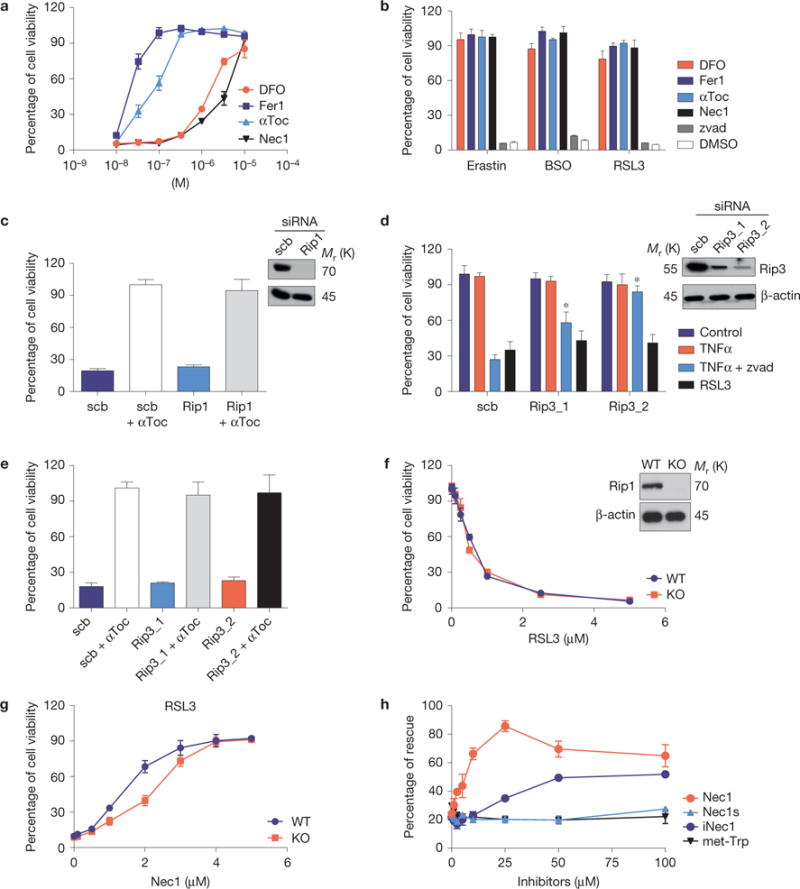
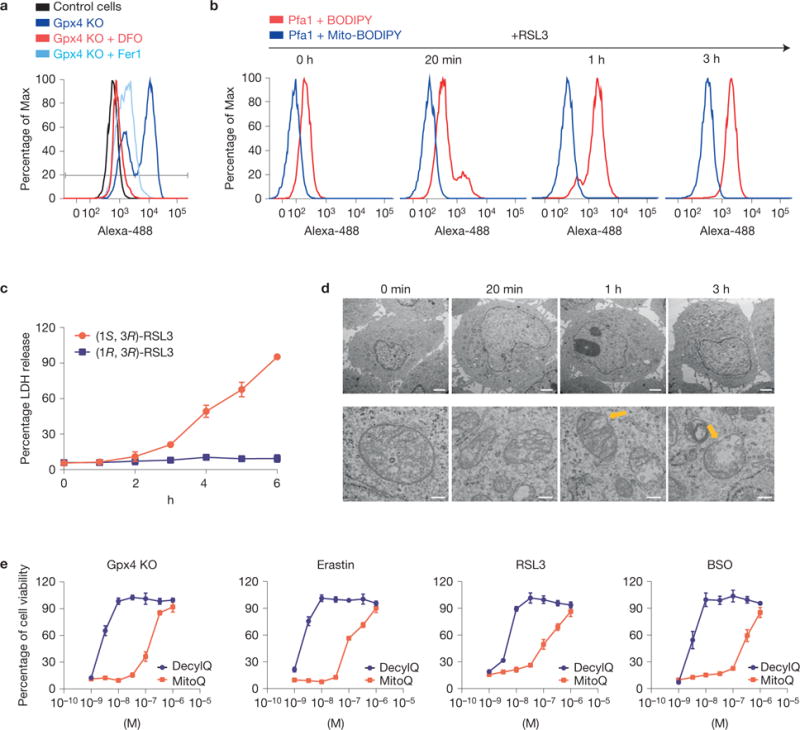
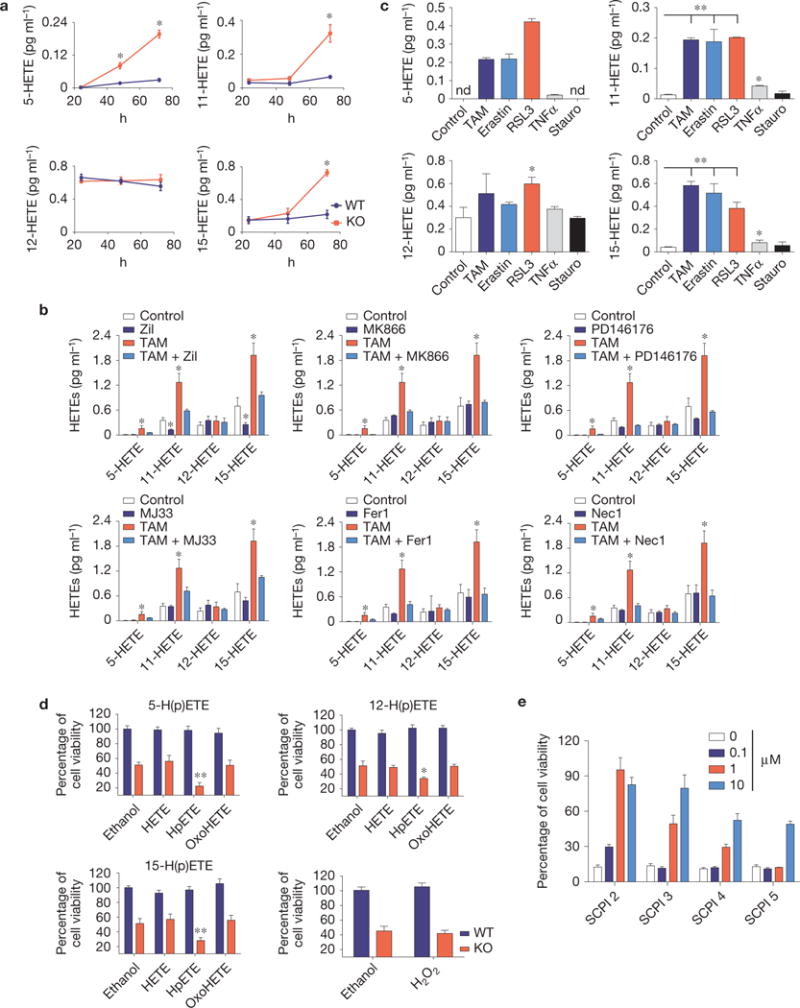
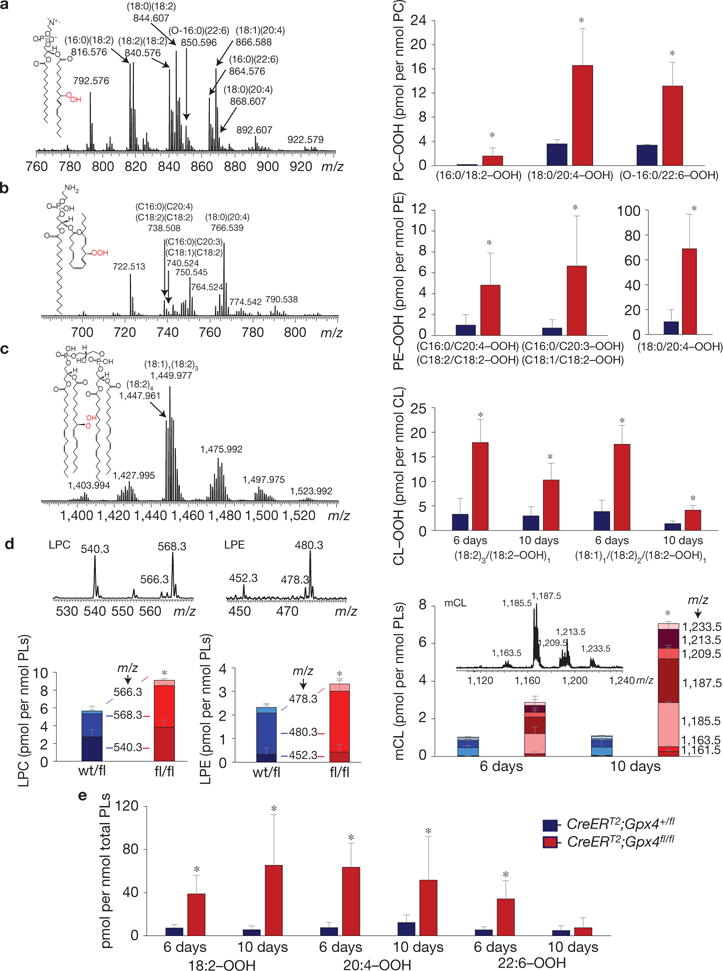
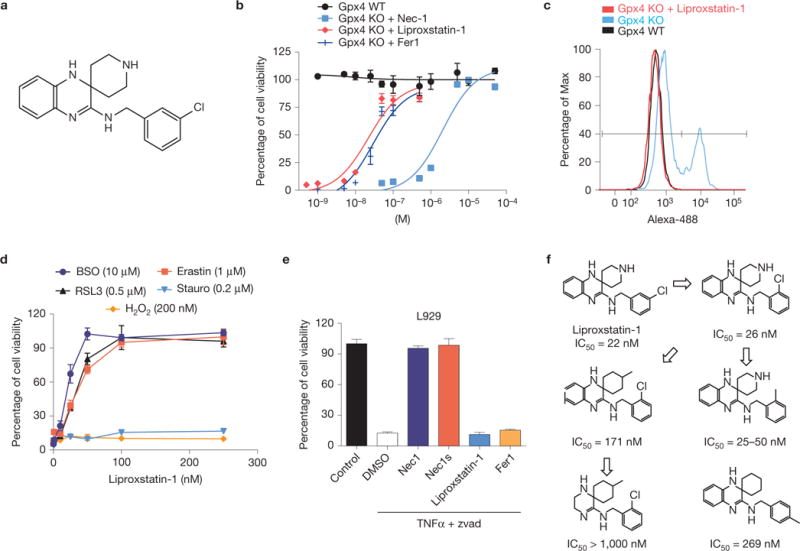
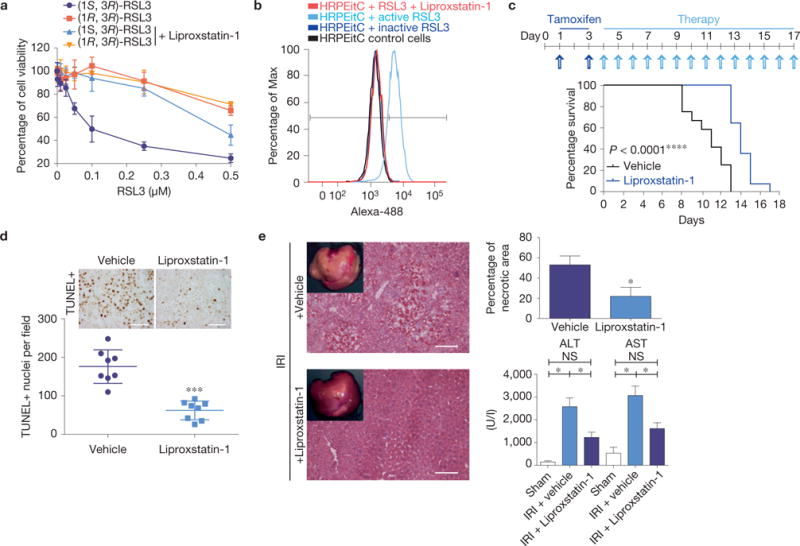
Ferroptosis is a non-apoptotic form of cell death induced by small molecules in specific tumour types, and in engineered cells overexpressing oncogenic RAS. Yet, its relevance in non-transformed cells and tissues is unexplored and remains enigmatic. Here, we provide direct genetic evidence that the knockout of glutathione peroxidase 4 (Gpx4) causes cell death in a pathologically relevant form of ferroptosis. Using inducible Gpx4(-/-) mice, we elucidate an essential role for the glutathione/Gpx4 axis in preventing lipid-oxidation-induced acute renal failure and associated death. We furthermore systematically evaluated a library of small molecules for possible ferroptosis inhibitors, leading to the discovery of a potent spiroquinoxalinamine derivative called Liproxstatin-1, which is able to suppress ferroptosis in cells, in Gpx4(-/-) mice, and in a pre-clinical model of ischaemia/reperfusion-induced hepatic damage. In sum, we demonstrate that ferroptosis is a pervasive and dynamic form of cell death, which, when impeded, promises substantial cytoprotection.


Conflict of interest statement

COMPETING FINANCIAL INTERESTS

The authors declare that a patent application has been filed for some of the compounds described in this work.

Figures

Figure 1
Figure 1
Inducible Gpx4 disruption causes ARF and death in mice. (a) A scheme showing the most important steps of glutathione (GSH) biosynthesis. αToc, α-tocopherol; BSO, L-buthionine sulphoximine; GSSG, oxidized glutathione; γGCS, γ-glutamylcysteine-synthase. (b) Inhibitors against enzymes of arachidonic acid metabolism prevent Gpx4-deletion-induced cell death in a dose-dependent manner. Gpx4 was disrupted in Pfa1 cells by the addition of 1 μM TAM in the presence of increasing concentrations of inhibitors. Cell viability was assessed by using AquaBluer 72 h after knockout induction. Data shown represent the mean ± s.d. of n = 4 of a 96-well plate from a representative experiment wells performed independently four times. (c) Mouse survival after TAM feeding. All induced Gpx4−/− (KO) mice died after approximately 2 weeks of TAM feeding regardless of Alox15 expression. None of the control mice (CreERT2;Gpx4+/fl/Alox15+/+(WT/Alox15+/+), CreERT2;Gpx4+/fl/Alox15−/−(WT/Alox15−/−)) died in the period investigated. Data are percentage of live animals; mean survival of Gpx4-null mice is 13.5 days after the onset of TAM feeding (n = 8 animals for KO/Alox15−/− and WT/Alox15−/− and n = 19 animals for KO/Alox15+/+ and WT/Alox15+/+). Gehan–Breslow–Wilcoxon test: P <0.0001). (d) Overall kidney phenotype of TAM-treated CreERT2;Gpx4fl/fl animals (KO) at time of euthanization. Left, control kidney (TAM-treated CreERT2;Gpx4+/fl, WT); right, enlarged and pale Gpx4−/− kidney. (e) Western blot of whole kidney tissue extracts showing that Gpx4 was efficiently depleted on TAM feeding in CreERT2;Gpx4fl/fl (fl/fl,Cre), but not in control CreERT2;Gpx4+/fl (+/fl,Cre) mice. (f) TAM-inducible CreERT2;Gpx4fl/fl mice present massive albuminuria and unselective proteinuria compared with control mice. Each lane represents one knockout or control animal (A, murine albumin). (g) Immunohistochemical expression analysis of Gpx4 in kidney tissue revealed that Gpx4 was efficiently depleted on TAM treatment of CreERT2;Gpx4fl/fl mice, which is in line with the immunoblot data. Note the high expression of Gpx4 in tubule cells of kidney cortex, whereas glomeruli show only faint Gpx4 expression (bars top row 100 μm and bottom row 50 μm). (h) Histological analysis of kidneys of TAM-treated CreERT2;Gpx4fl/fl animals showed widespread tubular cell death, interstitial edema and proteinaceous casts in distal tubules (bars top row 100 μm and bottom row 50 μm). (i) The number of TUNEL+ cells and mitotic cells (phosho-histone H3 staining, PH-3) is increased in kidneys of symptomatic Gpx4−/− mice (bars 100 μm). Uncropped images of blots are shown in Supplementary Fig. 8.
Figure 2
Figure 2
The inducible Gpx4 deletion in immortalized fibroblasts causes ferroptosis. (a) Cell death triggered by the inducible Gpx4 deletion in Pfa1 cells can be rescued by DFO, Fer1, αToc and Nec1 in a dose-dependent manner. Gpx4 was disrupted in Pfa1 cells as described in Fig. 1b (except for DFO, which was added 24 h after knockout induction, all inhibitors were added simultaneously along with TAM). Cell viability was assessed 72 h after knockout induction. (b) Cell death elicited in Gpx4-proficient Pfa-1 cells by the ferroptosis inducing agents (FINs) erastin (2.5 μM), BSO (20 μM) and RSL3 (20 nM) can be prevented by concomitant administration of DFO (10 μM), Fer1 (0.1 μM), αToc (1 μM) and Nec1 (20 μM), but not by the pan-caspase inhibitor Z-VAD-FMK (50 μM, zvad). Cell viability was assessed 24 h thereafter. (c) Rip1 knockdown in Pfa1 cells is unable to protect against cell death induced by Gpx4 deficiency (scrambled, scb). Cells were transfected 6 h after knockout induction and cell viability was assessed 66 h later. (d) Rip3 knockdown attenuates TNFα/Z-VAD-FMK-induced necroptosis, but not RSL3-induced ferroptosis in L929 cells (Scb, scrambled). Knockdown was performed 48 h before addition of the cell death stimuli. Cell viability was assessed 6 h after TNFα (10 ng ml−1), TNFα + zvad (50 μM) or RSL3 (1 μM) treatment. Data shown in c and d represent the mean ± s.d. of n=3 wells of a 12-well plate from a representative experiment performed five times, P = 0.05 (one-way ANOVA). (e) Rip3 knockdown in Pfa1 cells does not rescue cell death induced by Gpx4 knockout (scrambled, scb). Cells were transfected 6 h after knockout induction and cell viability was determined 66 h later. (f) Although the Rip1 inhibitor Nec1 rescued cell death triggered by FINs, Rip1-knockout (KO) cells are equally as sensitive to the Gpx4 inhibitor RSL3 as Rip1 wild-type (WT) cells; cell viability was assessed 24 h after treatment. (g) Nec1 rescues RSL3 (1 μM)-induced cell death in both Rip1 KO and WT cells in a dose-dependent manner. Cells were pre-treated with increasing concentrations of Nec1 for 6 h and viability was assessed 24 h after treatment with FIN agents. (h) Structurally related analogues of Nec1 (Nec1s, iNec) and met-Trp, an inhibitor of indoleamine 2,3-dioxygenase that is also inhibited by Nec1, present different effects on cell death induced by Gpx4 deletion. Rescue was performed by treating cells with increasing concentrations of Nec1 analogues (0–100 μM), and cell viability was assessed 72 h after knockout induction. Data shown represent the mean ± s.d. of n = 3 wells (e,h) or n = 4 wells (a,b,f,g) of a 96-well plate from a representative experiment performed independently at least three times, P= 0.05 (one-way ANOVA followed by Tukey’s multiple comparisons test).
Figure 3
Figure 3
Lipid peroxidation outside the mitochondrial matrix triggers ferroptosis in MEFs. (a) Inducible knockout of Gpx4 leads to increased lipid peroxidation that can be blunted by Fer1 and DFO. Lipid peroxidation was measured 48 h after knockout induction using the redox-sensitive dye BODIPY 581/591 C11. (b) RSL3 causes rapid lipid peroxidation outside the mitochondrial matrix as determined by BODIPY 581/591 C11 versus mitochondrial-targeted BODIPY 581/591 C11 staining; oxidation of the probe was assessed at the indicated time points. (c) Time-dependent increase in LDH release in Pfa1 cells treated with RSL3 (100 nM); supernatants were collected at the indicated time points and assayed for LDH activity. Data shown represent the mean ± s.d. of n = 3 wells of a 12-well plate from an experiment performed independently five times, P =0.05 (one-way ANOVA). (d) Electron micrographs showing a time-dependent OMM rupture (yellow arrows) on ferroptosis induction using RSL3 (50 nM; scale bars 2 μm top row, 200 nm bottom row). (e) The mitochondrial targeted antioxidant MitoQ is by far less efficient in protecting cells against ferroptotic cell death, elicited by Gpx4 knockout (KO), erastin, RSL3 or BSO, compared with the membrane-targeted antioxidant DecylQ. Ferroptosis was induced by Gpx4 knockout in Pfa1 cells by 1 μM TAM or by treatment of non-induced Pfa1 cells with FINs in the presence of increasing concentrations of the inhibitors; cell viability was determined 72 h and 24 h later, respectively. Data shown represent the mean ± s.d. of n=4 wells of a 96-well plate from a representative experiment performed independently at least three times, P =0.05 (one-way ANOVA).
Figure 4
Figure 4
Ferroptosis is characterized by the release of lipid mediators. (a) Quantification of a time-dependent release of arachidonic acid metabolites (5-HETE, 11-HETE, 12-HETE and 15-HETE) in the cell culture media after inducible Gpx4 deletion (KO) using LC–MS/MS analysis. (b) Impact of small-molecule inhibitors on HETE release on Gpx4 deletion. Quantification of released arachidonic acid metabolites was performed by LC–MS/MS. Cells were treated with zileuton (10 μM), MK866 (50 μM), PD146176 (1 μM), MJ33 (10 μM) and Fer1 (0.2 μM) at the time of knockout induction. Analysis was performed in conditioned medium collected 72 h after Gpx4 deletion. (c) Quantification of arachidonic acid metabolites released into the medium 24 h after cell death induction by erastin (2.5 μM), RSL3 (0.75 μM), TNFα (10 ng ml−1) and staurosporine (Stauro; 0.2 μM) using HPLC–MS/MS analysis. In the Gpx4−/− cells, HETE levels were determined 72 h after TAM treatment. Data shown represent the mean ± s.d. of n=3 wells of a 6-well plate from an experiment performed independently three times (a,c) or one time (b). P =0.05, ∗∗P =0.01 (one-way ANOVA, followed by Tukey’s multiple comparisons test (a) or Dunnett’s multiple comparison test (b,c)). (d) Impact of arachidonic acid metabolites on the cell death process elicited by Gpx4 loss. HETEs, HpETEs and OxoHETEs (1 μM) were added to WT or KO Pfa1 cells for Gpx4. Compounds were added 36 h after knockout induction and cell viability was measured 12 h thereafter. H2O2 was used at equimolar concentrations. Data shown represent the mean ± s.d. from n = 4 wells (HpETEs) or n = 6 wells (H2O2) of a 96-well plate from a representative experiment performed three times, P = 0.05, ∗∗P = 0.01, one-way ANOVA followed by Tukey’s multiple comparisons test. (e)=Sterol carrier protein-2 (SCP) inhibitors (SCPI) rescue Gpx4−/− cells from ferroptosis in a dose-dependent manner. Inhibitors were added concomitantly to TAM and cell viability was determined 72 h thereafter. Data shown represent the mean ± s.d. of n = 6 wells of a 96-well plate from a representative experiment performed independently two times, P =0.05 (one-way ANOVA).
Figure 5
Figure 5
LC–MS characterization of phospholipids and their oxidation products in kidneys of Gpx4-null and wild-type mice. (a) Mass spectrum of PC obtained from kidneys of Gpx4-null mice (left panel) and the levels of hydroperoxy-PC species in Gpx4-null (CreERT2;Gpx4fl/fl) and wild-type (CreERT2;Gpx4+/fl) mice (right panel). Hydroperoxy-PC species (m/z 848.575, 872.575, 876.606, 882.595, 896.575, 898.587 and 900.606) originated from PC species with m/z 816.576 (16:0/18:2), 840.576 (18:2/18:2), 844.607 (18:0/18:2), 850.596 (O-16:0/22:6), 864.576 (16:0/22:6), 866.588 (18:1/20:4) and 868.607 (18:0/20:4). Inset: structural formula of PC–OOH—(16:0/18:2–OOH). (b) Mass spectrum of PE obtained from kidney of Gpx4−/− mice and the content of hydroperoxy-PE species in Gpx4-null mice (right panel). Oxygenated species (m/z 770.507 and 772.522 and m/z 798.538) originated from major PE molecular species with m/z 738.508 (18:2/18:2 or 16:0/20:4), 740.524 (18:1/18:2 or 16:0/20:3) and 766.539 (18:0/20:4). Inset: structural formula of PE–OOH containing hydroperoxy-arachidonic acid—(18:0/20:4–OOH). (c) Mass spectrum of CL obtained from kidney of Gpx4−/− mice (left panel) and levels of hydroperoxy-CLs (m/z 1,479.932 and m/z 1,481.975) originating from species with m/z 1,447.961 (18:2)4 and 1,449.977 18:1/(18:2)3, respectively (right panel). Inset: structural formula of CL–OOH containing hydroperoxy-linoleic acid—(18:2)3/18:2–OOH. (d) Mass spectra and levels of lysophospholipids in samples from mouse kidneys. LPC, lysophosphatidylcholine; LPE, lysophosphatidylethanolamine; mCL, mono-lysocardiolipin. (e) Content of hydroperoxy-derivatives of linoleic (18:2–OOH), arachidonic (20:4–OOH) and docosahexaenoic (22:6–OOH) acids in samples from mouse kidneys. Mass spectra of PC, PE and CL were acquired using a QExactive orbitrap mass spectrometer (ThermoFisher Scientific). The resolution was set up at 140,000 corresponding to 5 ppm deviation in m/z measurement. Mass spectra of LPC, LPE and mCL were acquired by an LXQ ion trap mass spectrometer (ThermoFisher Scientific). Consequently, m/z values are presented to three and one decimal places, respectively. PC molecular ions were detected in a negative ionization mode as acetate adducts [M–H+CH3COOH]. LPC molecular ions were detected in a negative ionization mode as formate adducts [M–H+HCOOH]. PE and CL as well as LPE and mCL molecular ions were detected in a negative ionization mode as singly charged ions [M–H]. Data for hydroperoxy-species are presented as picomoles per nanomole of the parental non-oxidized species. Data shown represent the mean ± s.d. of n = 4 animals of a representative experiment performed independently two times, P =0.05 (one-way ANOVA).
Figure 6
Figure 6
Identification and characterization of ferroptosis inhibitors with in vivo efficacy. (a) Chemical structure of Liproxstatin-1. (b) Dose-dependent rescue of ferroptosis by Liproxstatin-1 in Gxp4−/− cells. On Gpx4 disruption in Pfa1 cells by TAM in the presence of Liproxstatin-1, cell viability was determined 72 h after knockout induction. (c) Liproxstatin-1 (50 nM) completely prevents lipid peroxidation in Gpx4−/− cells. Lipid peroxidation was assessed 48 h after knockout induction using the redox-sensitive dye BODIPY 581/591 C11. (d) Specificity of Liproxstatin-1 towards ferroptosis-inducing triggers. Liproxstatin-1 (200 nM) protects against FINs, such as BSO (10 μM), erastin (1 μM) and RSL3 (0.5 μM), in a dose-dependent manner, whereas it fails to rescue cell death induced by staurosporine (Stauro; 0.2 μM) and H2O2 (200 μM); cell viability was assessed 24 h after treatment. (e) Liproxstatin-1 does not prevent necroptosis. Two hours before triggering necroptosis, L929 cells were treated with Nec1 (10 μM), Nec1s (10 μM), Liproxstatin-1 (1 μM) and Fer1 (1 μM). Necroptosis was induced in L929 cells by a combination of TNFα (5 ng ml−1) and Z-VAD-FMK (50 μM) and cell viability was determined 8 h thereafter using AquaBluer. Data shown represent the mean ± s.d. of n = 4 wells (b,e) or n = 3 wells (d) of a 96-well plate from a representative experiment performed independently at least four times. (f) An initial SAR analysis including IC50 values of Liproxstatin-1 derivatives is shown. IC50 values depicted were calculated from experiments performed with inducible Gpx4−/− cells in 1 well of a 96-well plate, pooled from n=4.
Figure 7
Figure 7
Ferroptosis in human cells and in murine disease models can be targeted by Liproxstatin-1. (a) HRPTEpiCs are susceptible to Gpx4-inhibition-induced ferroptosis, which can be prevented by Liproxstatin-1 (100 nM). Dose-dependent killing of HRPTEpiCs by active (1S,3R)-RSL3 in contrast to inactive (1R,3R)-RSL3. Viability was assessed 24 h after treatment using AquaBluer. Data shown represent the mean ± s.d. of n = 3 wells of a 96-well plate from a representative experiment performed independently three times. (b) Liproxstatin-1 prevents RSL3 (0.2 μM)-induced lipid oxidation in HRPTEpiCs. Lipid peroxidation was assessed 24 h after knockout induction using the redox-sensitive dye BODIPY 581/591 C11. A representative experiment is shown performed independently four times. (c) Liproxstatin-1 retards ARF and death of mice induced by Gpx4 deletion; median survival was calculated to be 11 days for vehicle-treated (n = 12) and 14 days for Liproxstatin-1-treated mice (n = 13), Gehan–Breslow–Wilcoxon test: P <0.0001. Representative experiment shown was performed two times. Mice were injected daily with Liproxstatin-1 (10 mg kg−1, i.p.) during the course of the experiment. (d) Quantification of TUNEL cells in kidneys of vehicle- and Liproxstatin-1-treated animals at 9 +days after TAM administration. Data shown represent the mean ± s.d. of n = 4 comparable anatomical sections from a representative experiment performed two times (scale bars 50 μm). (e) The extent of tissue injury on transient ischaemia/reperfusion in liver of C57BL/6J mice can be ameliorated by the ferroptosis inhibitor Liproxstatin-1 as measured by AST/ALT (n = 17) for vehicle and for Liproxstatin-1 each) and by determining the necrotic area (n = 5). Data represent the mean ± s.e.m.; P = 0.05 or ∗∗∗P = 0.001 (one-way ANOVA) followed by Dunnett’s post-test.

References

    1. Galluzzi L, et al. Molecular definitions of cell death subroutines: recommendations of the nomenclature committee on cell death 2012. Cell Death Differ. 2012;19:107–120. - PMC - PubMed
    1. Ofengeim D, Yuan J. Regulation of RIP1 kinase signalling at the crossroads of inflammation and cell death. Nat Rev Mol Cell Biol. 2013;14:727–736. - PubMed
    1. Fulda S, Vucic D. Targeting IAP proteins for therapeutic intervention in cancer. Nat Rev Drug Discov. 2012;11:109–124. - PubMed
    1. Vanden Berghe T, Linkermann A, Jouan-Lanhouet S, Walczak H, Vandenabeele P. Regulated necrosis: the expanding network of non-apoptotic cell death pathways. Nat Rev Mol Cell Biol. 2014;15:135–147. - PubMed
    1. Vandenabeele P, Galluzzi L, Vanden Berghe T, Kroemer G. Molecular mechanisms of necroptosis: an ordered cellular explosion. Nat Rev Mol Cell Biol. 2010;11:700–714. - PubMed

Publication types

MeSH terms