. 2014 Dec;16(12):1202-14.
doi: 10.1038/ncb3062. Epub 2014 Nov 17.

Foxk proteins repress the initiation of starvation-induced atrophy and autophagy programs

Affiliations

Foxk proteins repress the initiation of starvation-induced atrophy and autophagy programs

Christopher John Bowman et al. Nat Cell Biol. 2014 Dec.

Abstract

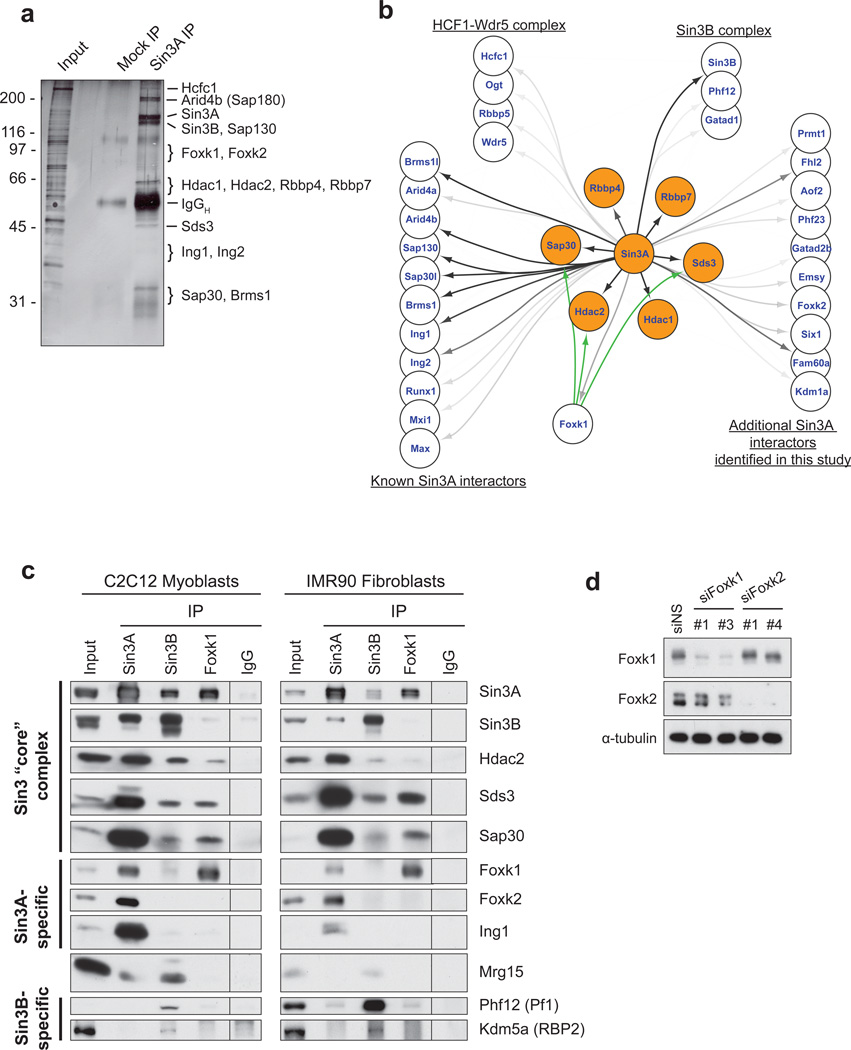
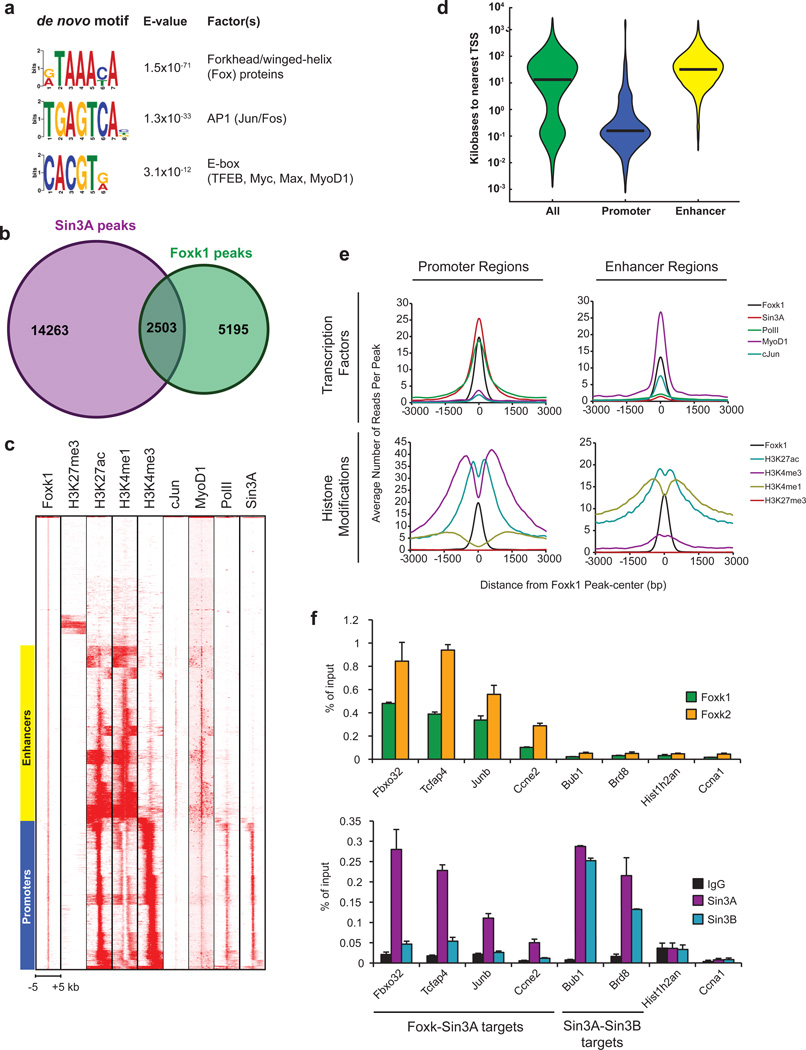
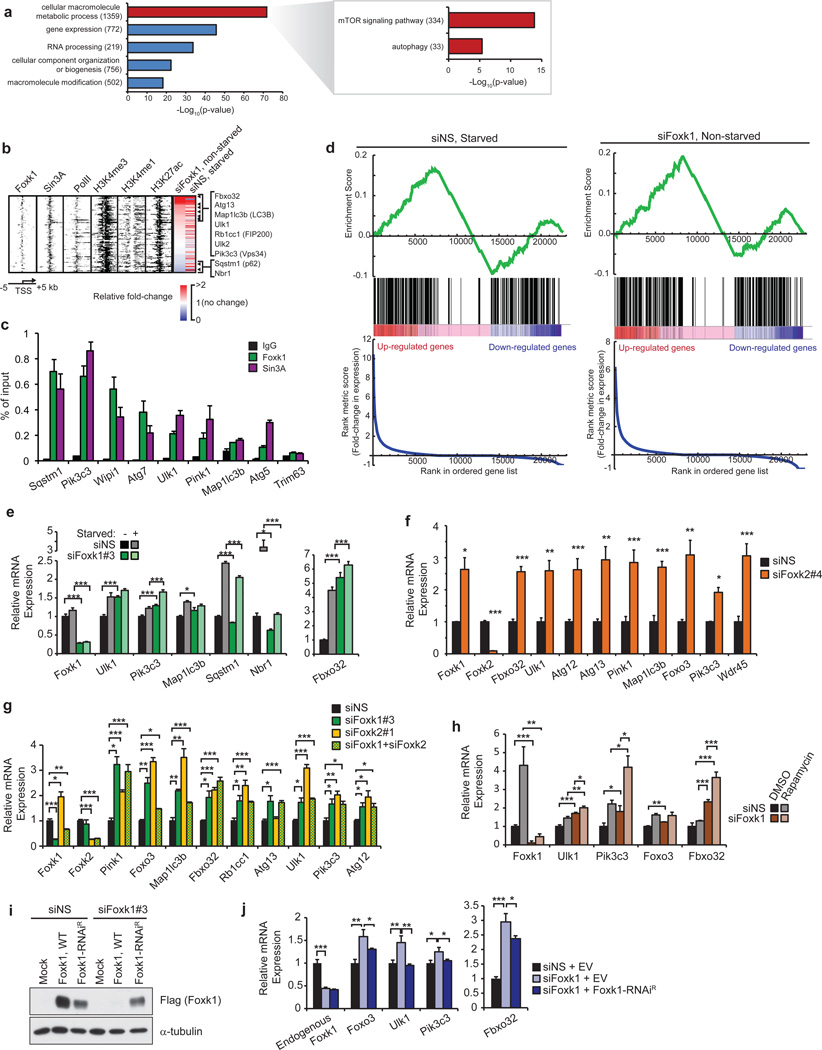
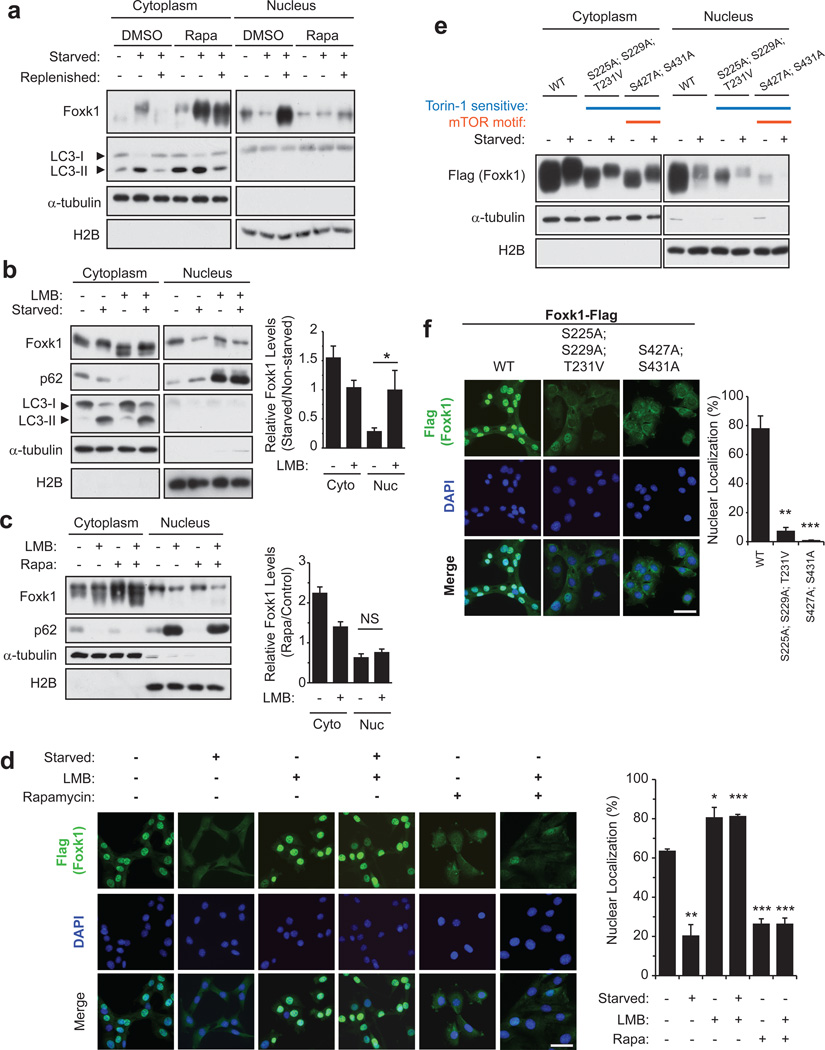
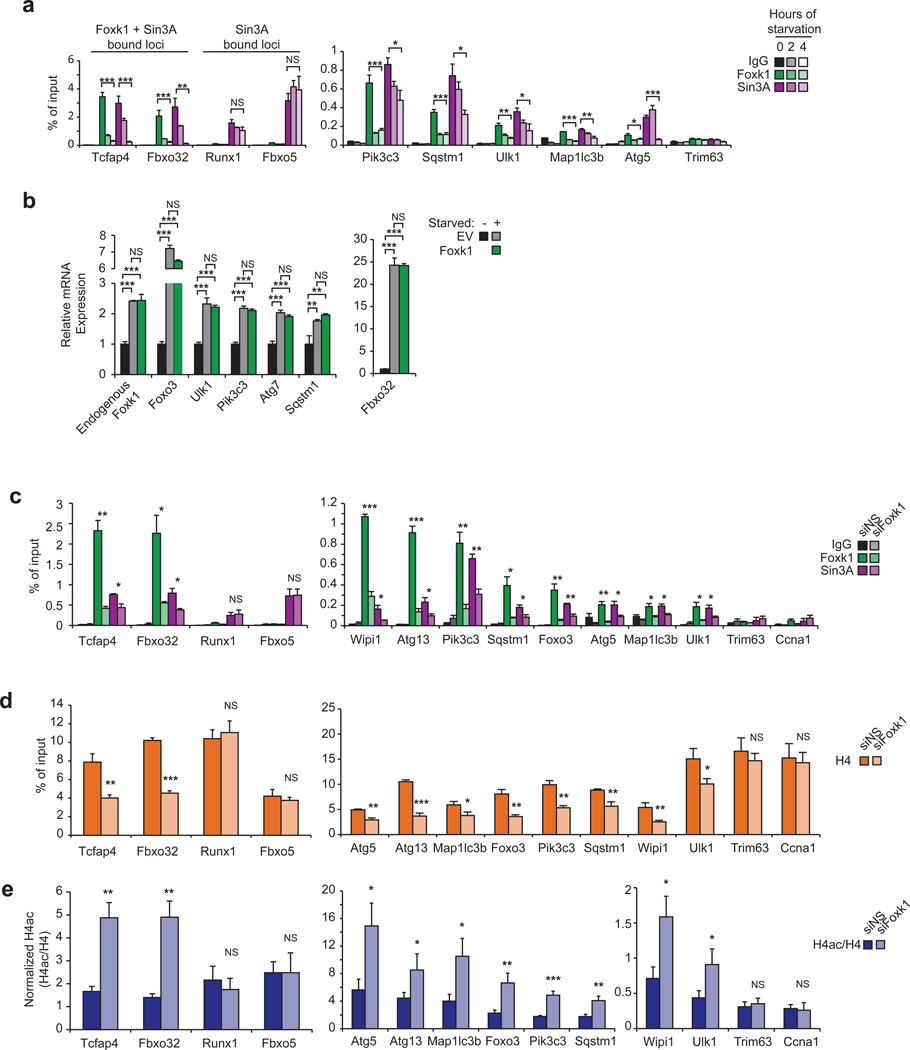
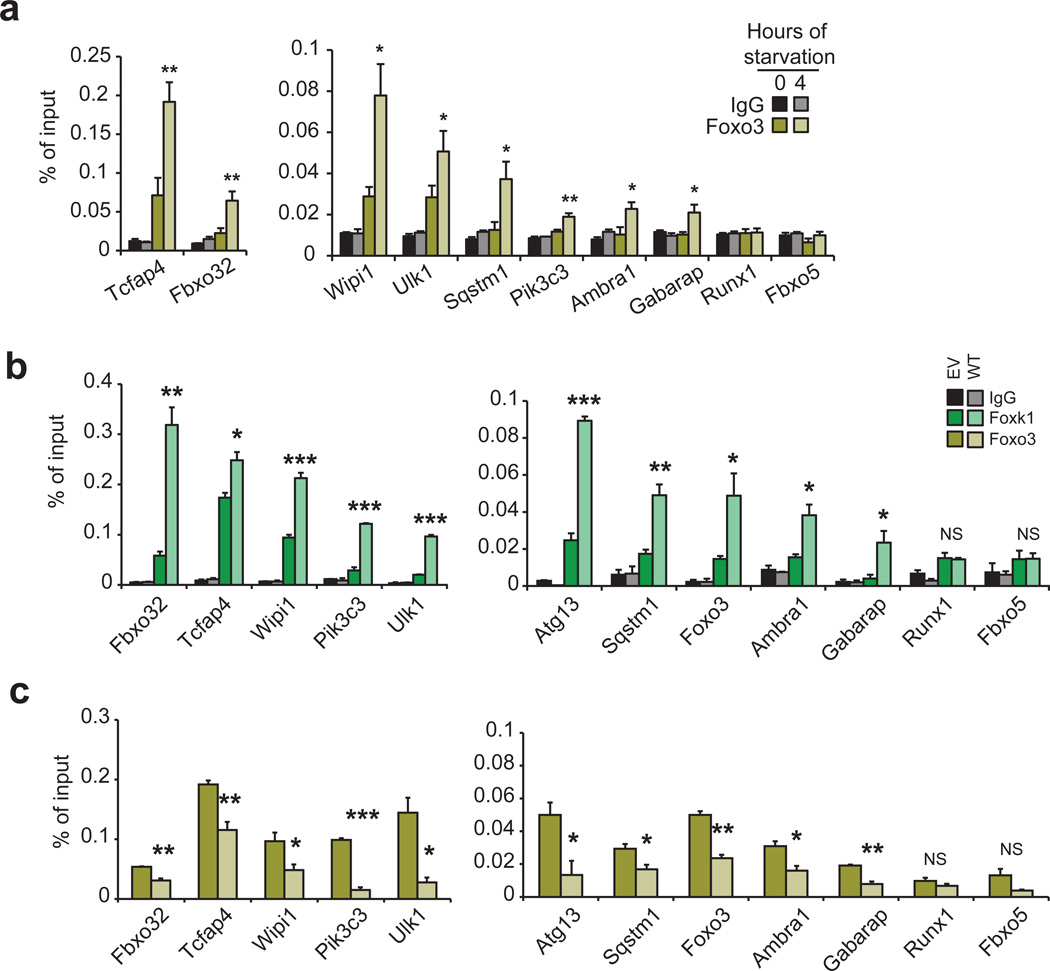
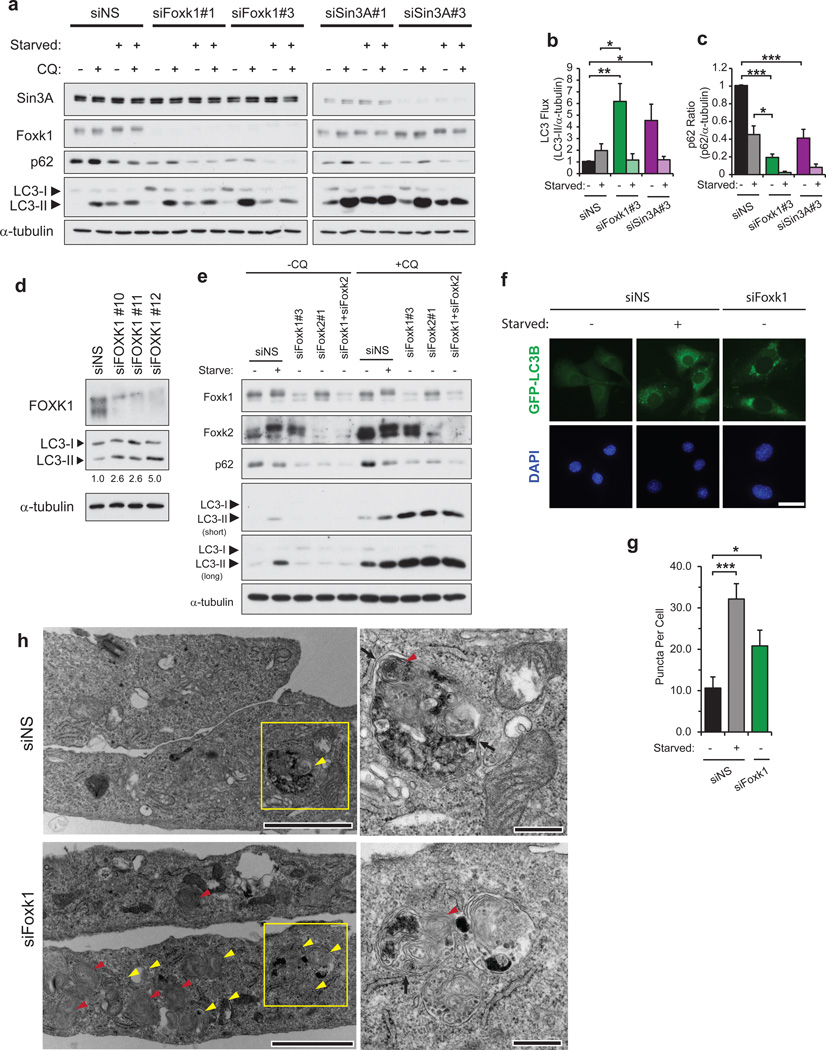
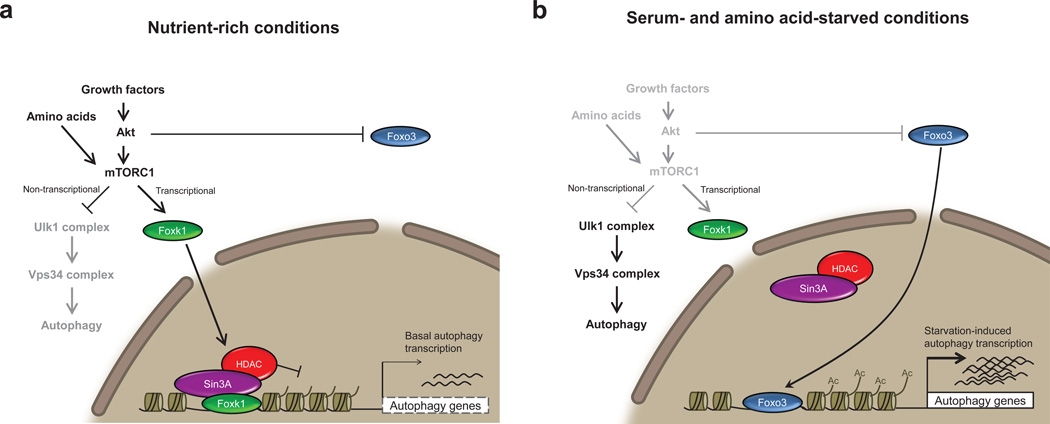
Autophagy is the primary catabolic process triggered in response to starvation. Although autophagic regulation within the cytosolic compartment is well established, it is becoming clear that nuclear events also regulate the induction or repression of autophagy. Nevertheless, a thorough understanding of the mechanisms by which sequence-specific transcription factors modulate expression of genes required for autophagy is lacking. Here, we identify Foxk proteins (Foxk1 and Foxk2) as transcriptional repressors of autophagy in muscle cells and fibroblasts. Interestingly, Foxk1/2 serve to counter-balance another forkhead transcription factor, Foxo3, which induces an overlapping set of autophagic and atrophic targets in muscle. Foxk1/2 specifically recruits Sin3A-HDAC complexes to restrict acetylation of histone H4 and expression of critical autophagy genes. Remarkably, mTOR promotes the transcriptional activity of Foxk1 by facilitating nuclear entry to specifically limit basal levels of autophagy in nutrient-rich conditions. Our study highlights an ancient, conserved mechanism whereby nutritional status is interpreted by mTOR to restrict autophagy by repressing essential autophagy genes through Foxk-Sin3-mediated transcriptional control.


Figures

Figure 1
Figure 1. Identification of Foxk1 as a component of a Sin3A complex
(a) Immuno-purification of Sin3A complexes from solubilized myoblast chromatin. (b) Sin3A interaction map showing protein-protein interactions connected by black and gray arrows. The intensity of the arrows indicates the number of peptides sequenced by mass spectrometry after Sin3A immuno-purification. Core components of Sin3 complexes are highlighted in orange. The green arrows signify additional interactors with Foxk1 as determined by IP-western in this study. (c) Nuclear Foxk1 and Foxk2 interact with Sin3A, but not Sin3B, complexes. The vertical line denotes a splice of the scanned image; immunoprecipitate from the non-specific IgG control was loaded on the same gel as all other samples. (d) siRNA-mediated depletion of Foxk1 and Foxk2. For each Foxk protein, two distinct targeting sequences yield similar knock-down efficiency. Western blotting documents the specificity of siRNAs and antibodies for the intended Foxk homologs.
Figure 2
Figure 2. Genome-wide identification of Foxk1 binding sites at promoters and enhancers
(a) Genome-wide discovery of Foxk1 binding motif and co-enrichment of additional transcription factor motifs. (b) Venn diagram depicting the number of Sin3A, Foxk1, and Sin3A-Foxk1 co-localized peaks deduced from our ChIP-seq data. The p value for co-localization of Foxk1 and Sin3A peaks (p<10−7869) was determined as outlined in the Methods section. (c) Supervised k-means clustering of Foxk1 ChIP-seq data revealed Foxk1 binding sites at promoters and enhancers. Each row represents a single 10 kb region surrounding the center of a Foxk1 enriched region (peak). (d) Promoter and enhancer regions predicted by k-means clustering are depicted as violin plots showing the distance of Foxk1 binding sites from the nearest TSS. Median distances are represented by black lines. (e) Tag densities of histone modifications and factors centered on Foxk1 peaks at promoters and enhancers. (f) qChIP analysis of Sin3 isoforms at Foxk1 and Foxk2 binding sites. Data represent n = three independent biological replicates from separate dishes and lysate preparations and are presented as mean+SEM.
Figure 3
Figure 3. Foxk1 represses transcription of genes associated with induction of atrophy and autophagy initiation
(a) GO analysis of Foxk1 targets showed enrichment of genes involved in mTOR signaling and autophagy. All indicated p-values are Bonferroni-corrected. Numbers in parentheses indicate the number of Foxk1-bound genes in the respective categories. (b) Heatmap depicting ChIP-seq data for Foxk1, Sin3A, RNA PolII, H3K27ac, H3K4me3, and H3K4me1 at 108 Foxk1-bound autophagy genes significantly deregulated upon Foxk1 knockdown in non-starved conditions. RNA-seq expression, relative to non-starved control conditions, after either starvation or Foxk1 knockdown is displayed to the right. Rows are sorted by fold-change in expression upon Foxk1 knockdown, where red indicates increased, and blue indicates decreased, gene expression. Genes displayed to the right are those known to play important roles in atrophy and autophagy processes. (c) qChIP of Foxk1 and Sin3A at the promoters of autophagy genes. The promoter of Trim63 is a negative control devoid of Foxk1 and Sin3A. (d) Gene set enrichment analysis (GSEA) of atrophy and autophagy genes in starved (left) or Foxk1-depleted (right) myoblasts. Genes are ranked by fold-change in expression relative to control, non-starved cells. Atrophy and autophagy-associated genes are denoted by black bars in the middle of the panels. A normalized enrichment score of 3.5 and 4.1 for starved and Foxk1-depleted cells, respectively, were calculated from the GSEA. Both enrichment scores have a nominal p-value < 0.0001. (e) Quantitative reverse-transcriptase PCR (qRT-PCR) of siRNA-depleted Foxk1 with or without starvation. Foxk1 depletion de-repressed a subset of autophagy genes and Fbxo32 under basal conditions, and starvation further increased expression of some genes beyond levels seen with starvation or knock-down alone. (f) Foxk2 depletion leads to de-repression of a panel of autophagy genes and Fbxo32. (g) Depletion of Foxk1 and Foxk2 alone or together leads to de-repression of autophagy genes and Fbxo32. (h) qRT-PCR of siRNA-depleted Foxk1 with or without rapamycin treatment. (i) Ectopic production of Flag-tagged RNAi-resistant Foxk1 (Foxk1-RNAiR). (j) Transfection with Flag-tagged Foxk1-RNAiR, but not empty vector (EV), restored repression of target genes. All qChIP and qRT-PCR data represent n = three independent biological replicates from separate dishes and lysate preparations, and are presented as mean+SEM. * p <0.05, ** p<0.01, *** p<0.001 (two-tailed t-test).
Figure 4
Figure 4. Nuclear import and export of Foxk1 is mTOR- and CRM1-dependent, respectively
(a) Foxk1 is transported from the nucleus to the cytoplasm during autophagy, and nuclear localization was mTOR-dependent. Cells were incubated in nutrient rich medium with or without 100 nM rapamycin for 16 h prior to starvation for 4h, which was then followed by replenishment with nutrient-rich medium for 2 h. Where indicated, cells were continuously incubated in the presence of 100 nM rapamycin. (b) Cells were treated with 1 ng/μL leptomycin B (LMB) 1 hour before and during starvation. Control cells were treated with ethanol vehicle (EtOH). Quantification of n = 4 independent experiments is shown to the right. (c) Non-starved cells were incubated with rapamycin for 16 h prior to the addition of 1 ng/μL LMB for 5 hours. Quantification (n = 3 independent experiments) is shown to the right. (d) Cells stably over-expressing Flag-tagged Foxk1were starved, treated with LMB, and/or incubated with rapamycin as in panels a-c. Quantification of at least 88 cells viewed in 5–8 random fields from n = 3 independent experiments is shown to the right. Bar, 50 µm. (e) Myoblasts were transfected with the indicated Flag-tagged Foxk1 cDNAs. WT, wild-type; S225A;S229A;T231A, Torin1-sensitive sites; S427A;S431A, mTOR motif and Torin1-sensitive sites. Data represent two independent biological replicates from separate dishes and lysate preparations. (f) Cells stably over-expressing the indicated Flag-tagged wild-type (WT) or mutant Foxk1 were grown in nutrient-rich medium. Quantification of at least 88 cells viewed in 5–8 random fields from n = 3 independent experiments is shown to the right. Bar, 50 µm. Data are presented as mean+SEM. * p <0.05, ** p<0.01, *** p<0.001(two-tailed t-test).
Figure 5
Figure 5. Starvation, via mTOR inhibition, signals the removal of Foxk1 from chromatin
(a) qChIP indicates that Foxk1 and Sin3A dissociate from chromatin during starvation. Trim63 is a negative control promoter devoid of Foxk1 and Sin3A. (b) Starved cells transfected with Foxk1 did not exhibit transcriptional differences in autophagy gene expression. (c–e) qChIP shows that Foxk1-depletion leads to removal of Foxk1 and Sin3A from chromatin (c), reduction in the levels of histone H4 (d), and enhanced acetylation of H4 (e) at autophagy genes. Data shown in panels c–e are from the same experiments, and IgG controls are presented in Fig. 5c. Trim63 and Ccna1 are negative control promoters devoid of Foxk1 and Sin3A. All qChIP and qRT-PCR data represent n = three independent biological replicates from separate dishes and lysate preparations, and are presented as mean+SEM.* p <0.05; ** p<0.01; *** p<0.001; NS, not significant (one-way ANOVA for panel 5a, two-tailed t-test for panels 5b–e).
Figure 6
Figure 6. Foxk1 and Foxo3 are recruited to the same atrophy and autophagy genes
(a) qChIP shows increased Foxo3 recruitment at Foxk1 sites during starvation. (b) Starved cells stably overexpressing wild-type Foxk1 (WT) exhibit higher levels of Foxk1 on chromatin than control cells expressing an empty vector (EV). (c) Overexpression of Foxk1 displaces Foxo3 from chromatin in starved cells. Data represent n = three independent biological replicates from separate dishes and lysate preparations, and are presented as mean+SEM. * p <0.05; ** p<0.01; *** p<0.001; NS, not significant (two-tailed t-test).
Figure 7
Figure 7. Foxk/Sin3A complexes suppress autophagic flux in nutrient-rich conditions
(a,b) Control (siNS) cells or cells depleted of either Foxk1 or Sin3A were grown in nutrient-rich or starvation medium in the presence or absence of chloroquine (CQ) for 90 min. LC3 flux was calculated as the ratio of LC3-II to α-tubulin levels in cells treated with chloroquine (CQ). LC3 and α-tubulin immunoblots correspond to the same gels in each group, and LC3-II/α -tubulin ratios were calculated from a single film containing both LC3 and the corresponding α–tubulin blots. Quantitation is from n = 3 independent experiments. (c) Foxk1 or Sin3A loss leads to reduced p62 protein levels. The ratio of p62 to α-tubulin levels was calculated using cells that were not treated with CQ. Quantitation is from n = 3 independent experiments. (d) Foxk1-depletion by siRNAs against three distinct target sequences increased autophagic flux in non-starved human IMR90 fibroblasts incubated in the presence of 30 µM CQ for 90 min. Numbers indicate LC3 flux, calculated as the ratio of LC3-II to α-tubulin levels. (e) Control (siNS) cells, cells singly depleted of either Foxk1 or Foxk2, or cells co-depleted of Foxk1 and Foxk2 were grown in nutrient-rich or starvation medium in the presence or absence of CQ for 90 min. Experiments were performed independently three times. (f) Representative images of direct fluorescence of stably-expressed GFP-LC3B in control (siNS), starved, or Foxk1-depleted myoblasts. Bar, 20 µm. (g) Quantification of the number of puncta in cells stably expressing GFP-LC3B. Puncta were counted in at least 36 cells viewed in 3–4 random fields over n = three independent experiments for each condition. (h) Foxk1 loss produced an abundance of autophagic vacuoles (yellow arrowheads) and multi-lamellar bodies (red arrowheads). Black arrows indicate double membranes of autophagosomes. Right panels are magnified views of boxed regions indicated to the left. Bars, 2 and 0.5 µm for the left and right panels, respectively. Data are presented as mean+SEM. *p<0.05, ** p<0.01, *** p<0.001 (two-tailed t-test).
Figure 8
Figure 8. Model illustrating a role for Foxk1 repression of autophagy and atrophy induction
(a) Autophagy genes are transcriptionally repressed through the direct binding of Foxk proteins and recruitment of Sin3A-HDAC complexes, resulting in the reduction of activating H4ac marks. Gene repression exerted through Foxk proteins is controlled downstream of mTOR complex 1 (mTORC1) activity, as mTORC1 inhibition, either through rapamycin or starvation treatment, prevents nuclear import of Foxk1. These observations suggest that mTORC1 negatively regulates autophagy by (1) inhibiting the activation of autophagy-initiating Ulk1 complexes, and (2) promoting the nuclear import and transcriptional repression of Foxk targets, including components of the Ulk1 and Vps34 complexes. mTORC1 thus effectively down-regulates autophagy through non-transcriptional and transcriptional means. (b) Starvation leads to the inhibition of the Akt-mTORC1-Foxk1 axis. Inhibition of mTORC1 prevents nuclear import of the Foxk proteins and, hence, leads to de-repression of autophagy and atrophy genes, mirroring depletion of Foxk. In addition, Akt inhibition permits nuclear import and subsequent binding of Foxo3 at the promoters of these same genes, leading to the upregulation of their expression.

References

    1. Mizushima N. Autophagy: process and function. Genes Dev. 2007;21:2861–2873. - PubMed
    1. Füllgrabe J, Klionsky DJ, Joseph B. The return of the nucleus: transcriptional and epigenetic control of autophagy. Nat. Rev. Mol. Cell Biol. 2014;15:65–74. - PubMed
    1. Füllgrabe J, et al. The histone H4 lysine 16 acetyltransferase hMOF regulates the outcome of autophagy. Nature. 2013;500:468–471. - PMC - PubMed
    1. Pietrocola F, et al. Regulation of autophagy by stress-responsive transcription factors. Semin. Cancer Biol. 2013;23:310–322. - PubMed
    1. Settembre C, et al. TFEB links autophagy to lysosomal biogenesis. Science. 2011;332:1429–1433. - PMC - PubMed

Publication types

MeSH terms

Associated data