An official website of the United States government
The .gov means it’s official.
Federal government websites often end in .gov or .mil. Before
sharing sensitive information, make sure you’re on a federal
government site.
The site is secure.
The https:// ensures that you are connecting to the
official website and that any information you provide is encrypted
and transmitted securely.
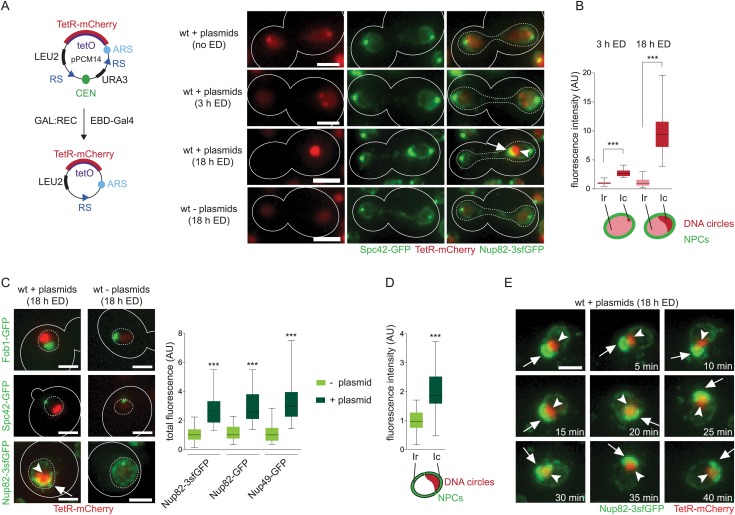
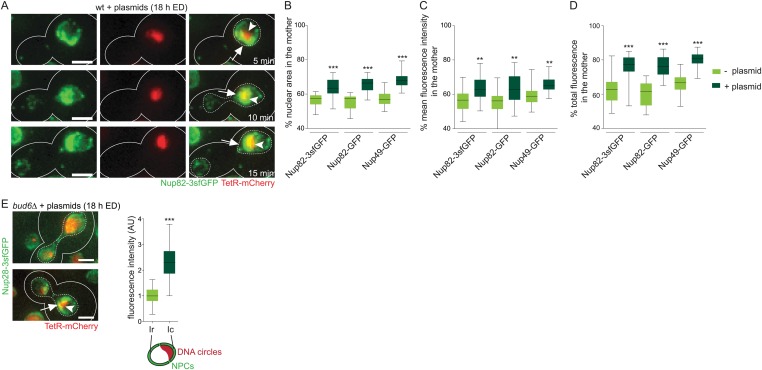
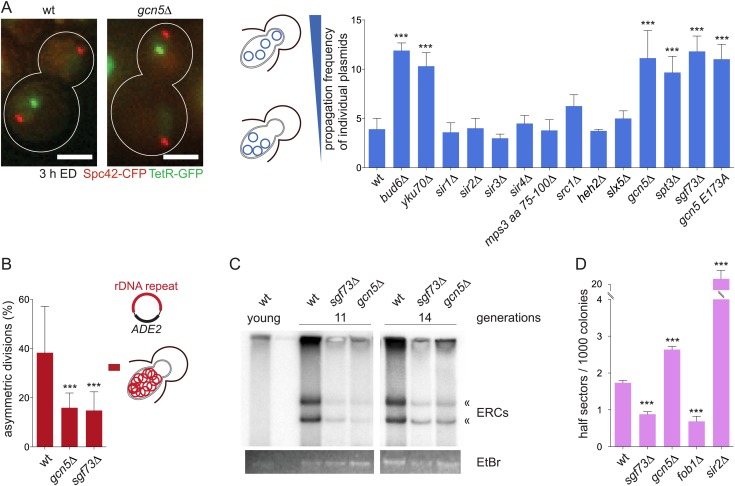
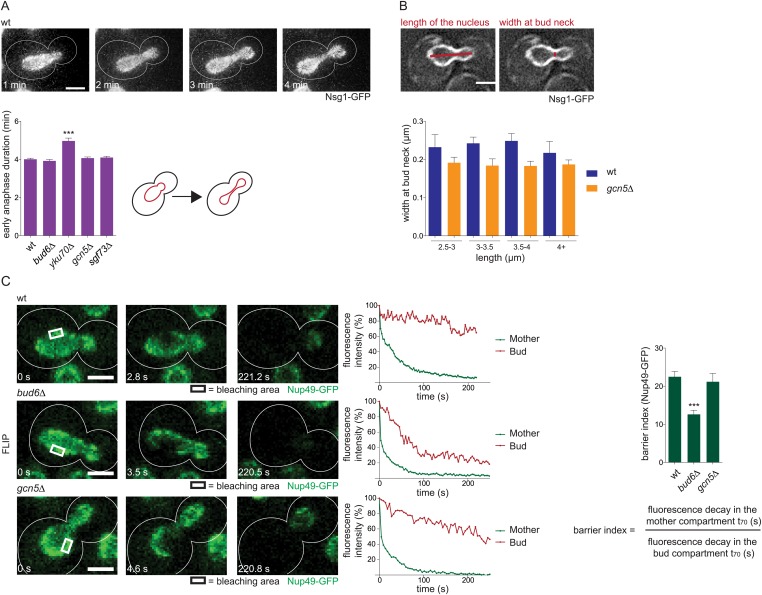
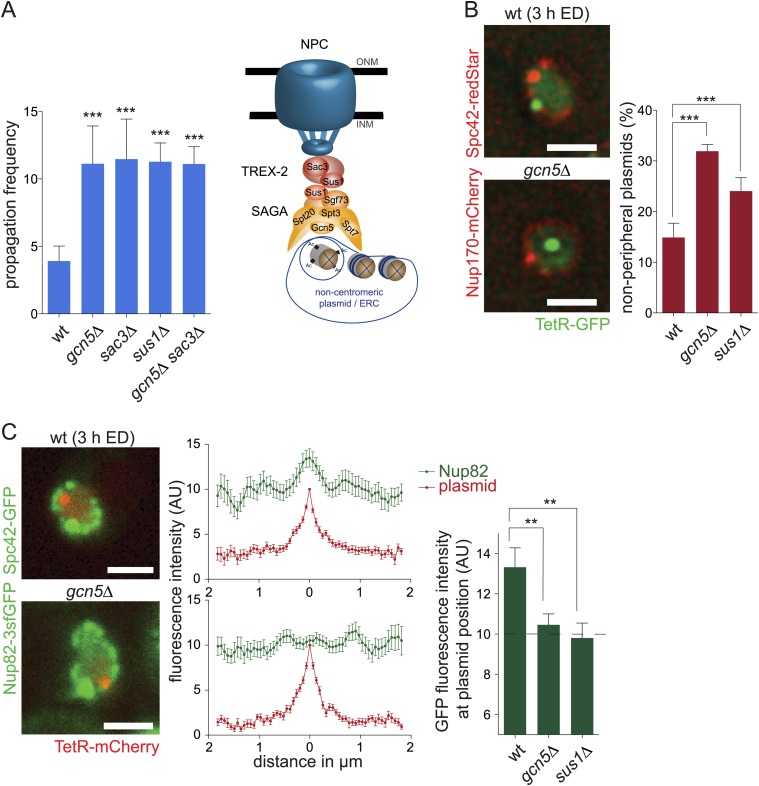
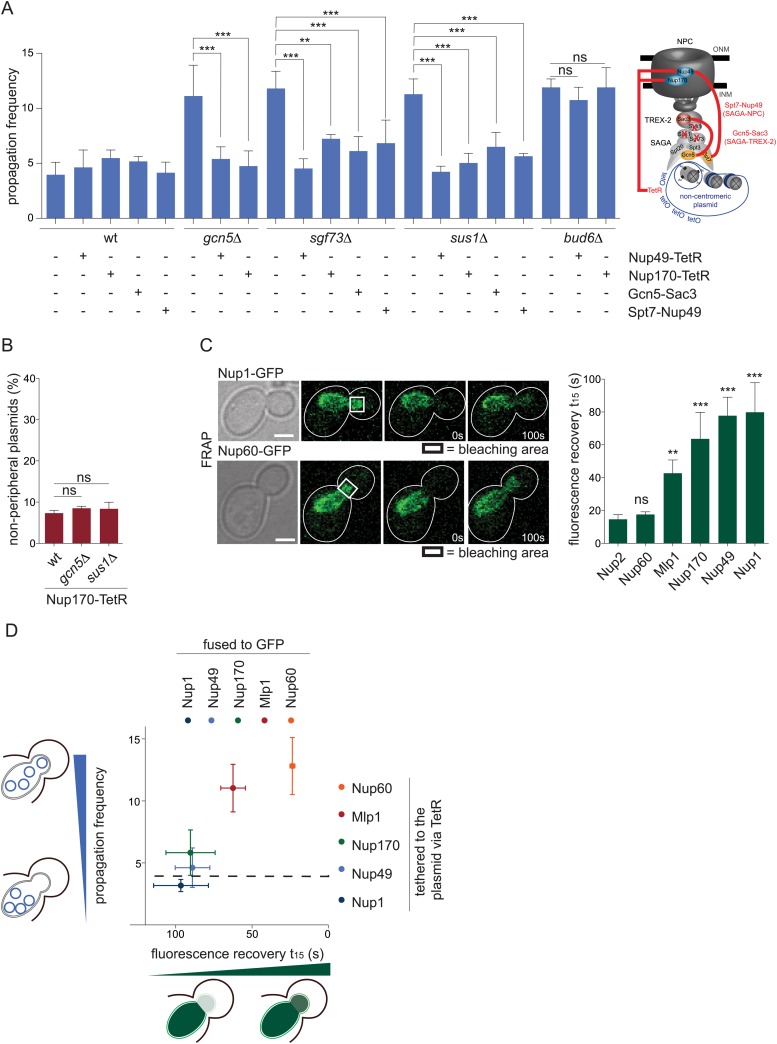
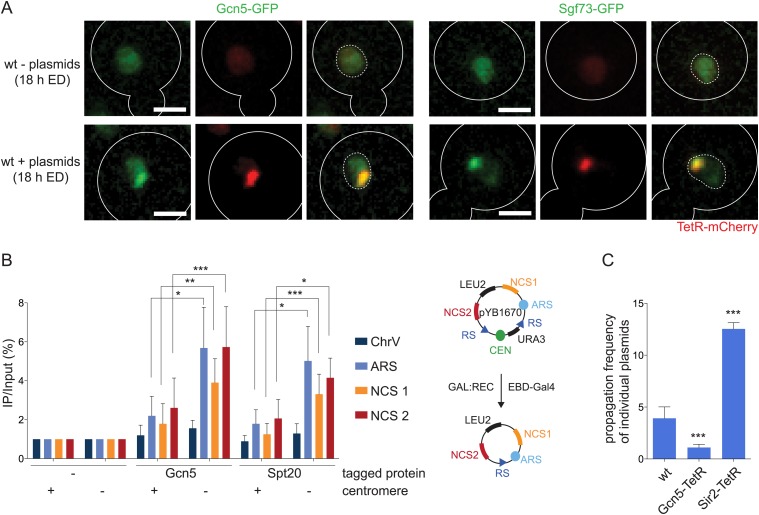
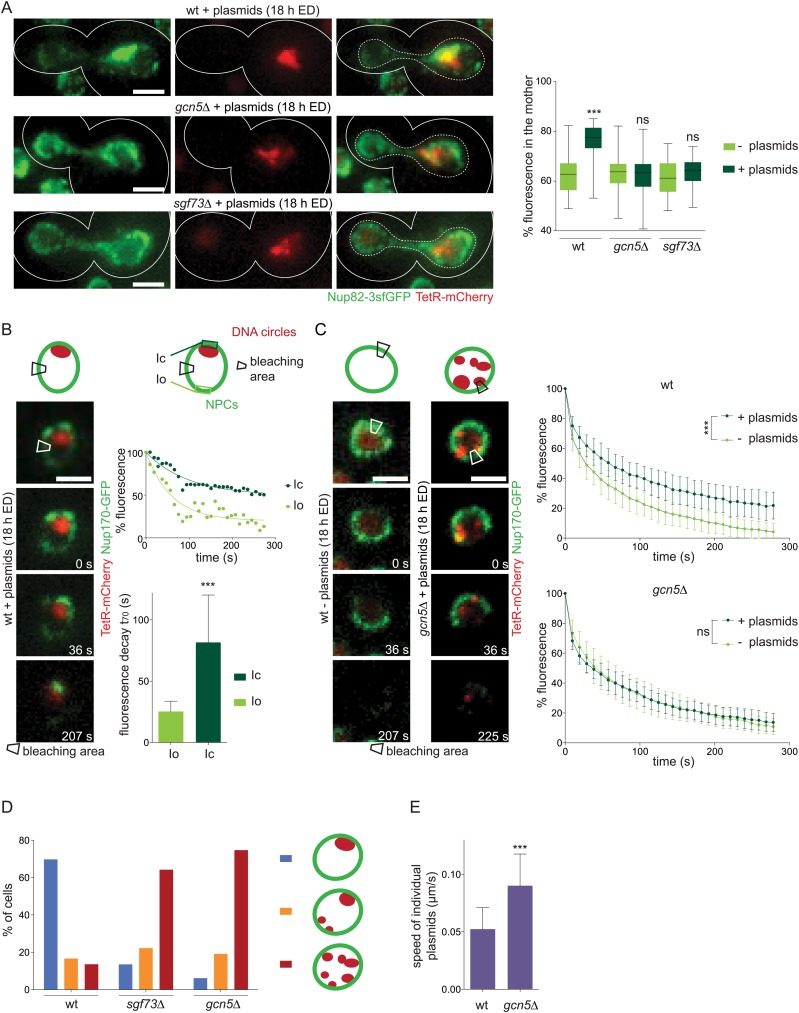
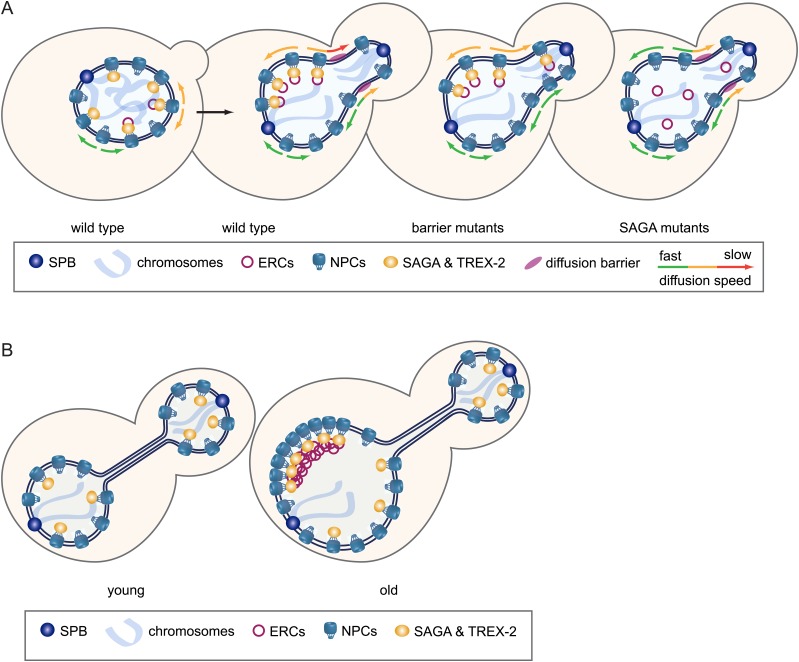
In eukaryotes, intra-chromosomal recombination generates DNA circles, but little is known about how cells react to them. In yeast, partitioning of such circles to the mother cell at mitosis ensures their loss from the population but promotes replicative ageing. Nevertheless, the mechanisms of partitioning are debated. In this study, we show that the SAGA complex mediates the interaction of non-chromosomal DNA circles with nuclear pore complexes (NPCs) and thereby promotes their confinement in the mother cell. Reciprocally, this causes retention and accumulation of NPCs, which affects the organization of ageing nuclei. Thus, SAGA prevents the spreading of DNA circles by linking them to NPCs, but unavoidably causes accumulation of circles and NPCs in the mother cell, and thereby promotes ageing. Together, our data provide a unifying model for the asymmetric segregation of DNA circles and how age affects nuclear organization.
Keywords:
S. cerevisiae; SAGA; ageing; cell biology; nuclear pores.
The authors declare that no competing interests exist.
Figures
Figure 1.. Accumulation of DNA circles induces…
Figure 1.. Accumulation of DNA circles induces the formation of an NPC cap.
( A …
Figure 1.. Accumulation of DNA circles induces the formation of an NPC cap.
(A) Schematic overview of the plasmid pPCM14 and fluorescent images of pPCM14 before and 3 or 18 hr after excision of the centromere by addition of estradiol (ED) in cells expressing TetR-mCherry, Nup82-3sfGFP, and Spc42-GFP. (B) Quantifications of the TetR-mCherry intensity in the circle area (Ic) and the residual nuclear area (Ir) 3 or 18 hr after centromere excision (all box plots represent minimum to maximum, line represents median, N ≥ 30 cells). (C) Fluorescent images of the nuclear proteins Fob1, Spc42, and Nup82 (green) in cells with or without accumulated plasmids (red, 18 hr after addition of ED). Quantifications of total fluorescence of different nuclear pore markers in cells with or without accumulated plasmids, normalized by the median of cells without plasmids (N > 30 cells). (D) Quantifications of fluorescence intensity of Nup82 in the vicinity of the DNA circle (Ic) and the rest of the nucleus (Ir), normalized by the median Ir (N = 50 cells). (E) Time lapse images of a nucleus with accumulated plasmids (red) and the NPC cap (green). Images were taken every 5 min. (A-E) ***p < 0.001; images are max Z-projections; arrow depicts the NPC cap, arrow head the accumulated circles; scale bars always represent 2 μm. DOI:http://dx.doi.org/10.7554/eLife.03790.003
Figure 2.. Accumulated plasmids retain the NPC…
Figure 2.. Accumulated plasmids retain the NPC cap in the mother cell during mitosis leading…
Figure 2.. Accumulated plasmids retain the NPC cap in the mother cell during mitosis leading to an increased asymmetric segregation of NPCs.
(A) Time lapse images of a dividing nucleus in a cell expressing Nup82-3sfGFP and containing accumulated plasmids. (B–D) Percentage of the nuclear area (B), the mean fluorescence density (C), and the total green fluorescence (D) segregated to the mother cell in telophase cells with and without plasmids using different nuclear pore markers (N > 25 cells, ***p < 0.001, **p < 0.01). (E) Representative pictures of bud6∆ cells containing plasmids and quantifications of Nup82-3sfGFP intensity in the vicinity of the DNA circle (Ic) and the rest of the nucleus (Ir) normalized by the median Ir (N = 50 cells). (A–E) Arrow depicts the NPC cap, arrow head the accumulated circles. DOI:http://dx.doi.org/10.7554/eLife.03790.006
Figure 3.. The SAGA complex mediates retention…
Figure 3.. The SAGA complex mediates retention of DNA circles including ERCs.
( A )…
Figure 3.. The SAGA complex mediates retention of DNA circles including ERCs.
(A) Representative images and quantifications of plasmid propagation frequencies (pf) in wt and different mutant cells (mean ± SD N ≥ 3 clones). (B) Mother-bud distribution of the rDNA containing plasmid pDS163 in wt, gcn5∆ and sgf73∆ mutant cells (mean ± SD N = 10 independent experiments). (C) Detection of ERC levels in wt, sgf73∆ and gcn5∆ mutant cells by Southern blotting (« depict ERCs) in 11 and 14 generations old cells. (D) Quantifications of half-sectors representing recombination events within the rDNA repeats in wt and mutant cells (mean ± SD N = 3 clones). (A–D) ***p < 0.001. DOI:http://dx.doi.org/10.7554/eLife.03790.007
Figure 4.. Previously described mechanisms for plasmid…
Figure 4.. Previously described mechanisms for plasmid retention are not affected in SAGA deficient cells.
(A) Duration of early anaphase in wt cells and cells lacking Bud6, Yku70, Gcn5, or Sgf73 (mean ± SD N ≥ 180 cells). (B) Measurements of the width of early anaphase nuclei at the bud neck, categorized by different length of the nucleus in wt and gcn5∆ mutant cells (mean ± SEM, N ≥ 70 cells). (C) Photobleaching analysis of wt, bud6∆, and gcn5∆ cells expressing Nup49-GFP. Graph shows the Barrier Index (ratio of the time to decay to 70% of initial fluorescence in the mother compartment to the bud compartment of early anaphase nuclei, mean ± SEM, N ≥ 20 cells). (A–C) ***p < 0.001. Images are max Z-projections (A) or represent one focal plane (B and C). DOI:http://dx.doi.org/10.7554/eLife.03790.008
Figure 5.. SAGA attaches DNA circles to…
Figure 5.. SAGA attaches DNA circles to NPCs via TREX-2.
( A ) pf in…
Figure 5.. SAGA attaches DNA circles to NPCs via TREX-2.
(A) pf in wt and different mutant cells (gcn5∆ from Figure 3A for comparison, mean ± SD, N ≥ 3 clones). Model of how non-centromeric plasmids including ERCs might be attached to NPCs via the SAGA and TREX-2 complexes. (B) Percentage of plasmids at a resolvable distance to the nuclear periphery in wt, gcn5∆ and sus1∆ mutant cells (mean ± SD, N = 3 clones). (C) Normalized fluorescence intensity of Nup82-3sfGFP in green (NPCs) and TetR-mCherry in red (plasmid) aligned by the peak of TetR intensity. Quantifications of average Nup82-3sfGFP intensity 130 nm around the plasmid (mean ± SEM, N = 50 cells). (A-C) ***p < 0.001, **p < 0.01. Images represent one focal plane. DOI:http://dx.doi.org/10.7554/eLife.03790.004
Figure 6.. SAGA-dependent attachment of circles to…
Figure 6.. SAGA-dependent attachment of circles to stable NPC components ensures their asymmetric segregation.
( …
Figure 6.. SAGA-dependent attachment of circles to stable NPC components ensures their asymmetric segregation.
(A) pf in wt and different mutant cells expressing Nup170 or Nup49 fused to TetR or the fusion proteins Gcn5-Sac3 or Spt7-Nup49 (mean ± SD, N ≥ 3 clones). Scheme of the fusion proteins. (B) Percentage of plasmids at a resolvable distance to the nuclear periphery in wt, gcn5∆ and sus1∆ mutant cells expressing Nup170 fused to TetR (mean ± SD, N = 3 clones) (C) Fluorescence recovery after bleaching the bud part of early anaphase nuclei measured in cells expressing several NPC components tagged with GFP. Quantification of the time to recover 15% of fluorescence intensity (t15, mean ± SEM, all compared with Nup2 for statistics). (D) Correlation between the fluorescence recovery in the bleached bud compartment (t15) of the depicted proteins fused to GFP and the pf in cells expressing the same proteins fused to TetR. Dashed line represents pf in wt cells. (A–C) ***p < 0.001, **p < 0.01. DOI:http://dx.doi.org/10.7554/eLife.03790.009
Figure 7.. SAGA preferentially interacts with non-centromeric…
Figure 7.. SAGA preferentially interacts with non-centromeric DNA circles ( A ).
Fluorescent images (deconvolved max Z-projections)…
Figure 7.. SAGA preferentially interacts with non-centromeric DNA circles (A).
Fluorescent images (deconvolved max Z-projections) of Gcn5-GFP and Sgf73-GFP (green) in cells with and without accumulated plasmids (red). (B) ChIP-qPCR analysis to test the binding of the SAGA components Gcn5 and Spt20 to three sequences on pYB1670 (ARS, non-coding sequences (NCS) 1 and 2; see scheme of plasmid) and a control sequence on chromosome V (mean ± SD, N = 5 independent experiments, ***p < 0.001, **p < 0.01, *p < 0.05). (C) pf in cells expressing Gcn5 or Sir2 fused to TetR (mean ± SD, N = 3 clones, ***p < 0.001). DOI:http://dx.doi.org/10.7554/eLife.03790.010
Figure 8.. DNA circles and NPCs reciprocally…
Figure 8.. DNA circles and NPCs reciprocally reduce their dynamics in a SAGA-dependent manner.
( …
Figure 8.. DNA circles and NPCs reciprocally reduce their dynamics in a SAGA-dependent manner.
(A) Fluorescent images of Nup82-3sfGFP (green) in cells with accumulated plasmids (red). Quantification of the percentage of NPCs segregated to the mother cell in wt, gcn5∆ and sgf73∆ cells with or without plasmids (box plots: min to max, median (line), N = 50 cells). Images are max Z-projections. (B) Time lapse images of a photobleaching experiment in wt cells expressing Nup170-GFP (green) and containing plasmids (red). Rectangle depicts the bleaching area. Plotted Nup170-GFP intensity in the circle area (Ic) and an equidistant area opposite of the circles (Io) over time, set to 100% prior to bleaching. Images represent one focal plane. Quantification of the time 30% of fluorescence decays (t70; mean ± SD, N = 20 cells). (C) Average total fluorescence of the whole nucleus plotted over time in wt and gcn5∆ mutant cells with (dark green) and without plasmids (light green), set to 100% prior to bleaching (mean ± SD, N ≥ 20 cells, ***p < 0.001). (B and C) Images represent one focal plane. (D) Quantification of plasmid clustering in wt and SAGA deficient cells. Cells were divided in 3 categories: plasmids localized always, partially, or never to one focus throughout a 1 hr time lapse movie (mean, N ≥ 160 cells). (E) Speed of individual plasmids in wt and gcn5∆ cells expressing TetR-GFP measured from time lapse movies with 3 s intervals (mean ± SD, N ≥ 50 plasmids). (A–E) ***p < 0.001. DOI:http://dx.doi.org/10.7554/eLife.03790.011
Figure 9.. NPCs segregate increasingly asymmetric with age leading to their accumulation in old cells…
Figure 9.. NPCs segregate increasingly asymmetric with age leading to their accumulation in old cells in a barrier dependent manner.
(A) Transmission image of cells trapped in the microfluidic device after 64 hr. Cells of different age are trapped (➤, °, and * depicts 0-, 27-, and 31-generation old cells, respectively). (B) Cells expressing Nup170-GFP showing a pronounced NPC cap. (C) Total fluorescence of the depicted NPC marker in the mother (dark green) and daughter cell (light green) grouped by age categories of the mother cells (N ≥ 50 cells, ***p < 0.001, **p < 0.01, *p < 0.05). (D) Percentage of NPC fluorescence segregated to the mother cell plotted against their age in wt cells expressing different NPC markers and bud6∆ cells. Lines show fitted curves; dots represent the average of 10 data points grouped by age (mean ± SD, N ≥ 50 cells). (E–G) Quantifications of total fluorescence (E), nuclear radii (F), and mean fluorescence intensity (G) in G1 cells of increasing age (mean ± SD, N ≥ 50 cells) quantified as in (D). (A–E) Numbers in white depict the age of the corresponding cell (g = generations). Images are sum Z-projections. DOI:http://dx.doi.org/10.7554/eLife.03790.013
Figure 10.. The accumulation of NPCs in…
Figure 10.. The accumulation of NPCs in old mother cells depends on ERCs and SAGA.
(A) Total Nup170-GFP intensity in G1 cells plotted against their age in wt and depicted mutant cells. (B) Percentage of fluorescence segregated to the mother cell in wt and depicted mutant cells expressing Nup170-GFP or Nup49-GFP. (A and B) Images are sum Z-projections. (C) Total fluorescence of Nup170-GFP in mother (dark green) and daughter cells (light green) grouped by age categories of the mother cells (N ≥ 50 cells, ***p < 0.001, **p < 0.01, *p < 0.05). (D) Percentage of total Nup170-GFP fluorescence segregated to the mother cell in cells lacking Sgf73 and expressing either Spt7-Nup49 or Gcn5-Sac3. (A, B, D) Lines show fitted curves; dashed lines for comparison; dots represent the average of 10 data points grouped by age (mean ± SD, N ≥ 50 cells). DOI:http://dx.doi.org/10.7554/eLife.03790.014
Figure 11.. The SAGA complex promotes ageing.
( A ) Replicative lifespan (RLS) of wt, …
Figure 11.. The SAGA complex promotes ageing.
(A) Replicative lifespan (RLS) of wt, gcn5∆, spt20∆, and sgf73∆ cells. (B) RLS of fob1∆ and gcn5∆ fob1∆ cells. (C) RLS of fob1∆ and spt20∆ fob1∆ cells. (D) RLS of wt cells expressing Gcn5-Sac3 and Spt7-Nup49. (E) RLS of cells lacking Sgf73 and expressing Gcn5-Sac3 or Spt7-Nup49. (A–D) Median lifespan is depicted in brackets; dashed lines represent RLS of depicted wt and mutant cells of (A) for comparison; N = 50–150 cells; ***p < 0.001, **p < 0.01, *p < 0.05. DOI:http://dx.doi.org/10.7554/eLife.03790.015
Figure 12.. Model.
( A ) Model…
Figure 12.. Model.
( A ) Model of how SAGA prevents DNA circles from segregating…
Figure 12.. Model.
(A) Model of how SAGA prevents DNA circles from segregating into the daughter cell: SAGA attaches DNA circles to NPCs via the TREX-2 complex, which reduces the diffusion of the circle-bound NPCs, preventing them to pass the diffusion barrier at the bud neck. (B) The retention of circle-bound NPCs leads to a SAGA-dependent accumulation of ERCs and NPCs in old mother cells. DOI:http://dx.doi.org/10.7554/eLife.03790.016
Boettcher B, Marquez-Lago TT, Bayer M, Weiss EL, Barral Y. 2012. Nuclear envelope morphology constrains diffusion and promotes asymmetric protein segregation in closed mitosis. The Journal of Cell Biology 197:921–937. doi: 10.1083/jcb.201112117.
-
DOI
-
PMC
-
PubMed
Bonnet J, Wang CY, Baptista T, Vincent SD, Hsiao WC, Stierle M, Kao CF, Tora L, Devys D. 2014. The SAGA coactivator complex acts on the whole transcribed genome and is required for RNA polymerase II transcription. Genes & Development 28:1999–2012. doi: 10.1101/gad.250225.114.
-
DOI
-
PMC
-
PubMed
Bupp JM, Martin AE, Stensrud ES, Jaspersen SL. 2007. Telomere anchoring at the nuclear periphery requires the budding yeast Sad1-UNC-84 domain protein Mps3. The Journal of Cell Biology 179:845–854. doi: 10.1083/jcb.200706040.
-
DOI
-
PMC
-
PubMed
Burtner CR, Kennedy BK. 2010. Progeria syndromes and ageing: what is the connection? Nature Reviews Molecular Cell Biology 11:567–578. doi: 10.1038/nrm2944.
-
DOI
-
PubMed
Cabal GG, Genovesio A, Rodriguez-Navarro S, Zimmer C, Gadal O, Lesne A, Buc H, Feuerbach-Fournier F, Olivo-Marin JC, Hurt EC, Nehrbass U. 2006. SAGA interacting factors confine sub-diffusion of transcribed genes to the nuclear envelope. Nature 441:770–773. doi: 10.1038/nature04752.
-
DOI
-
PubMed