. 2014 Dec;17(12):1816-24.
doi: 10.1038/nn.3866. Epub 2014 Nov 17.

Simultaneous cellular-resolution optical perturbation and imaging of place cell firing fields

Affiliations

Simultaneous cellular-resolution optical perturbation and imaging of place cell firing fields

John Peter Rickgauer et al. Nat Neurosci. 2014 Dec.

Abstract

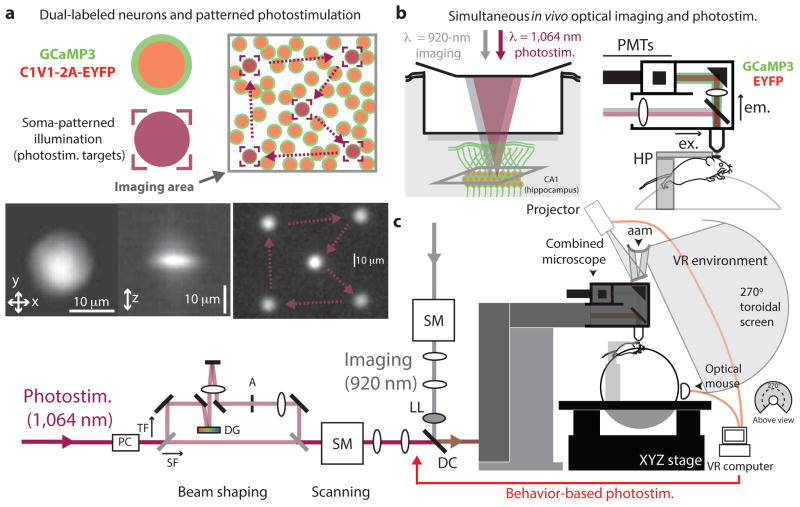
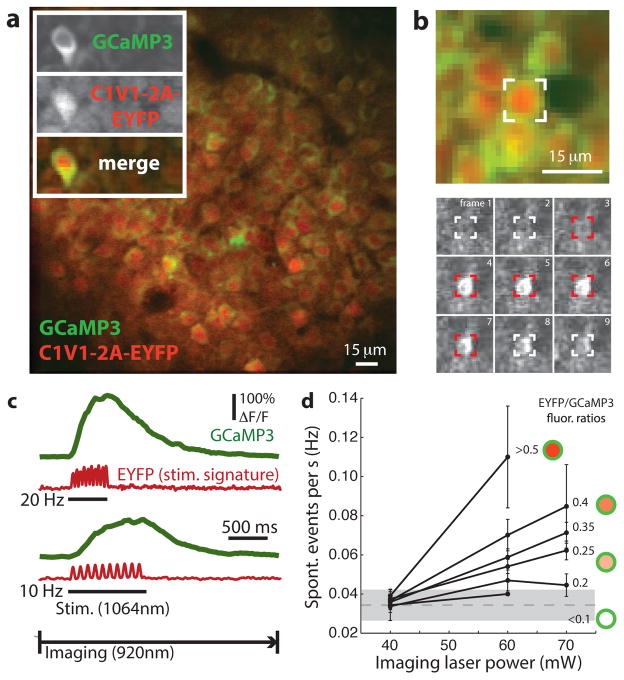
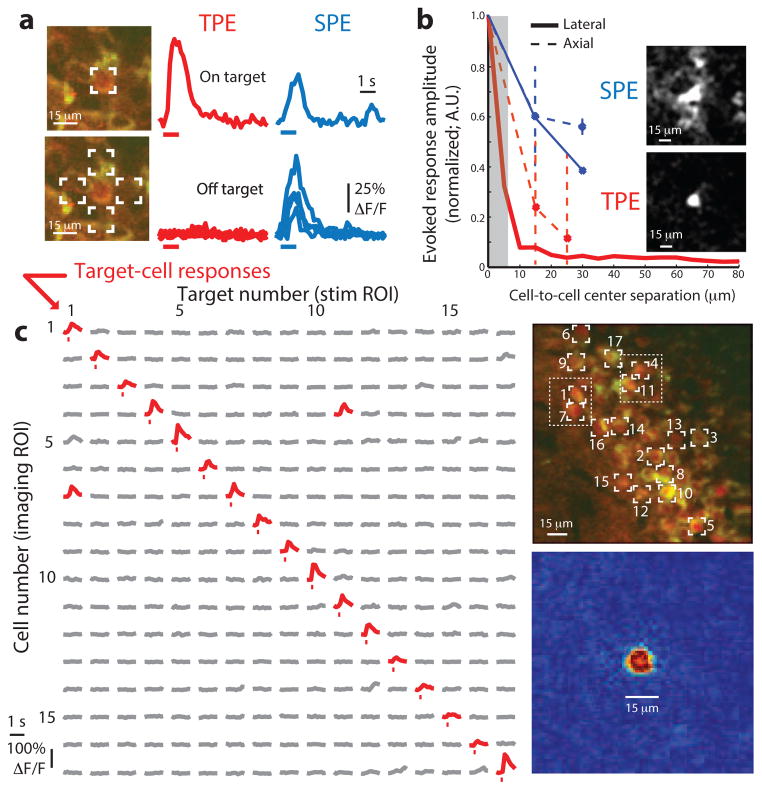
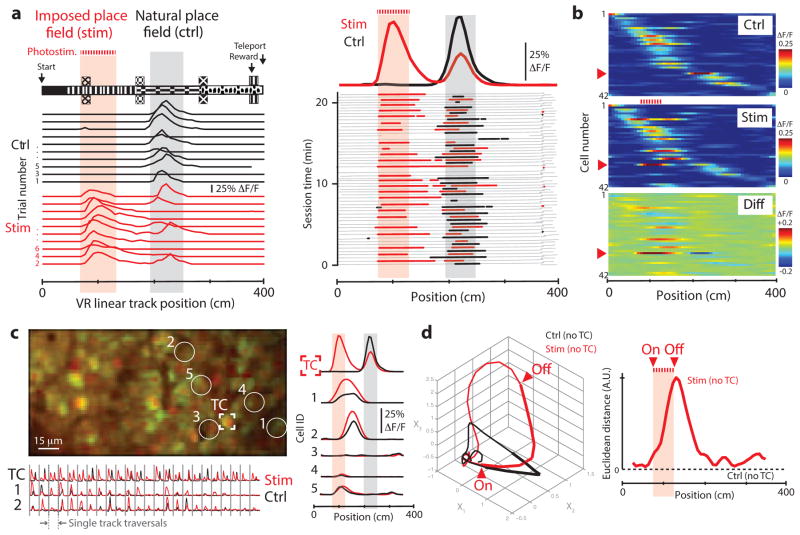
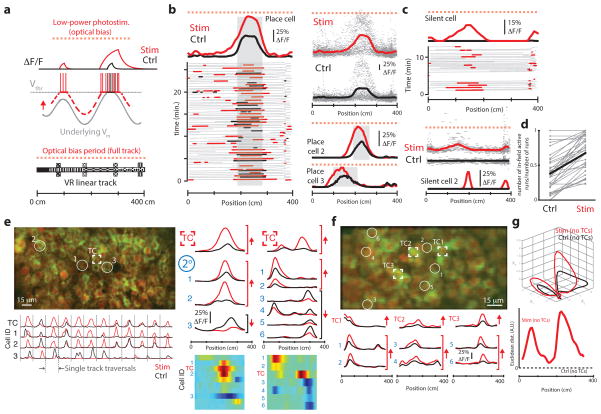
Linking neural microcircuit function to emergent properties of the mammalian brain requires fine-scale manipulation and measurement of neural activity during behavior, where each neuron's coding and dynamics can be characterized. We developed an optical method for simultaneous cellular-resolution stimulation and large-scale recording of neuronal activity in behaving mice. Dual-wavelength two-photon excitation allowed largely independent functional imaging with a green fluorescent calcium sensor (GCaMP3, λ = 920 ± 6 nm) and single-neuron photostimulation with a red-shifted optogenetic probe (C1V1, λ = 1,064 ± 6 nm) in neurons coexpressing the two proteins. We manipulated task-modulated activity in individual hippocampal CA1 place cells during spatial navigation in a virtual reality environment, mimicking natural place-field activity, or 'biasing', to reveal subthreshold dynamics. Notably, manipulating single place-cell activity also affected activity in small groups of other place cells that were active around the same time in the task, suggesting a functional role for local place cell interactions in shaping firing fields.


Conflict of interest statement

COMPETING FINANCIAL INTERESTS

The authors declare no competing financial interests.

Figures

Figure 1
Figure 1
Schematic for simultaneous cellular-resolution photostimulation and functional calcium-imaging in awake, behaving mice. (a) Neurons expressing a green calcium sensor (GCaMP3) and a red-shifted optogenetic probe (C1V1(E122T/E162T)-2A-EYFP; red) visualized in awake mice using TPE imaging were selected as targets for TPE photostimulation. Each target cell was stimulated by transient illumination with a temporally focused ‘spot’ around the size of a soma (10–15 μm). Bottom left, CCD images of TPE fluorescence illustrating in-plane (xy) and projected axial (xz) illumination profiles of the photostimulation spot. Bottom right, image of a patterned photostimulation scan (dwell time of 0.5 ms per location; CCD integration time of 1,000 ms). Arrows indicate the repeat scan trajectory between targets. (b) Two laser-scanning TPE systems (imaging and photostimulation) were combined in a custom microscope to image (λ = 920 nm) and stimulate (λ = 1,064 nm) coexpressing hippocampal CA1 neurons in awake, mobile or behaving mice. ex., excitation path; em., emitted fluorescence detection path; PMTs, photomultiplier tubes; HP, headplate holders. (c) The combined instrument (optical path schematic, left) used a VR system to create a virtual environment in which mice could be trained to perform visually guided behaviors, and large-scale optical recordings were used to characterize neuron population activity. Single neurons of interest were selected and stimulated at designated times in the behavior, synchronized using custom VR software. PC, Pockels cell; TF, temporal focusing path; SF, spatial focusing path; DG, diffraction grating; A, aperture; SM, scanning mirrors; LL, liquid lens; DC, dichroic mirror; aam, angular amplification mirror.
Figure 2
Figure 2
All-optical stimulation and recording of neural activity in awake mice. (a) TPE fluorescence image of CA1 hippocampal neurons expressing GCaMP3 (green) and C1V1(E122T/E162T)-2A-EYFP (red) in an awake mouse. Inset, images of unmixed GCaMP3 and EYFP (top panels) and a pseudocolor merge (bottom panel; image sizes 25 × 65 μm). Somatic GCaMP3 appeared to be annular from nuclear exclusion, whereas EYFP was diffuse. (b) Simultaneous optical stimulation and imaging of activity in a targeted neuron (indicated in top panel). Bottom, GCaMP3 fluorescence images during one stimulationand imaging time series (frame interval of 0.125 s, target is shown in red during a 10 Hz × 0.05-s stimulation pulse-train). 1,064-nm stimulation evoked a GCaMP3 transient in the targeted cell that was detected using 920-nm imaging. (c) Somatic ΔF/F traces (GCaMP3, green) recorded during photostimulation using two-channel fluorescence detection and linear unmixing (five-trial average, 10 × 0.05-s pulses at 20 and 10 Hz during underlined periods). Evoked GCaMP3 transients were separable from optical stimulation artifacts (EYFP fluorescence, red traces), allowing continuous imaging during stimulation. (d) Estimate of activity induced by imaging opsin-expressing neurons. Rates of spontaneous activity versus imaging laser power for several neuron populations with increasing C1V1 expression (estimated by EYFP/GCaMP3 intensity and depicted by soma cartoons). Low-power imaging (≈40 mW) produced minimal changes in spontaneous activity in coexpressing neurons compared withneurons with little or no detectable C1V1 -EYFP expression (error bars indicate mean ± s.d.; mean ± s.d. of lowest-expressing group at 40 mW is shown in shaded area).
Figure 3
Figure 3
Cellular-resolution photostimulation in awake mice. (a) Specificity of cell-targeted photostimulation using focused single-photon excitation (SPE) versus TPE. Left, images of an isolated coexpressing CA1 neuron with the 1,064- or 473-nm target positions overlaid. Right, GCaMP3 ΔF/F traces measured during stimulation targeting those locations using TPE or SPE (all traces are averages of >3 trials). TPE and SPE both evoked responses when the cell was targeted, whereas only SPE evoked responses when it was not. (b) Spatial resolution of TPE and SPE photostimulation. Evoked response amplitudes for different displacements between target cells and neighboring cells laterally (as in a; solid lines) or axially (dashed lines; error bars indicate mean ± s.d.). Lateral resolution measurements (solid lines) include trials based on cellular fluorescence changes in nearby cells in densely labeled tissue (five cells, SPE; 101 cells, including 27 and 74 temporal and spatial focusing targets, TPE). Inset, representative responses from one cell (centered in images) included in this measurement. Images represent post-stimulation minus pre-stimulation GCaMP3 fluorescence in each case (three-trial average). TPE and SPE evoked similar responses in targeted neurons, but responses were better confined to the target cell using TPE. (c) Matrix of TPE-stimulated responses from 17 cellular targets (indicated at right), with significant responses shown in red (Online Methods). Each entry shows activity in one cell (given by row number) during stimulation targeting one cell (column number). Most responsive cells could be stimulated independently (two exceptions here are indicated in the image). Bottom right, TPE stimulation–triggered response profile (analogous to a point-spread function in imaging), shown as an image (normalized post- minus pre-stimulation GCaMP3 fluorescence, averaged across stimulation trials targeting 101 different cells).
Figure 4
Figure 4
Optical perturbation of a place cell during virtual navigation. (a) Schematic and experimental examples of place cell perturbation. A trained mouse ran along a 400-cm VR track (upper left). A neuron with a place field in this environment (gray shaded region) was stimulated while the mouse ran through a different part of the track (red shaded region). Single-trial examples of place-cell activity (ΔF/F traces) are shown below for imaging-only and stimulation traversals. Right, activity in the targeted place cell throughout the behavior session (alternating control (ctrl) and stimulation (stim) traversals are shown in black and red, respectively). Position in the environment (gray) and periods of significant transients (colored dots) are shown below, with session averages above (bold lines). Place-specific stimulation mimicked the activity observed in the place field. (b) Intensity maps of spatially modulated activity in neurons from the recorded population (shown in c). Red arrowhead indicates the targeted cell. (c) Secondary effects of stimulation. Left, image of the neurons recorded in this session (target cell, TC). Right, spatial activity profile in the TC, two other cells that showed significantly increased in-field activity during stimulation trials (cells 1 and 2, P = 0.015 and P = 0.028) and three other cells (no difference). Stimulating one place cell increased activity in other neurons with nearby place fields. Concatenated single-trial ΔF/F traces for three cells are shown below. (d) Neuronal circuit trajectories. Left, mean state-space trajectories of population activity during stimulation and control trials (41 cells, TC excluded), visualized using the first three common factors (Online Methods). Right, Euclidean distance between control and stimulation trial trajectories. Stimulating this place cell perturbed activity in other place cells during navigation.
Figure 5
Figure 5
Low-power biasing to measure underlying dynamics in neurons and networks. (a) Schematic. Low-power stimulation biases a neuron, producing ΔF/F transients preferentially when Vm is near Vthr. (b) Biasing place cells. Left, place cell activity (field shaded gray) during imaging versus low-power biasing traversals (black and red). Averaged across trials (above), biasing increased activity asymmetrically, leading up to the place field. Top right, activity overlaid across all trials (gray dots, lines are averages). Bottom right, two additional examples of place cells biased by low-power stimulation. (c) Biasing silent cells. Data are presented as in b, but show activity arising from biasing two silent cells (no spatial field during imaging trials). Biasing was able to reveal spatial receptive fields (here, centered around 140 and 190 cm). (d) Fraction of receptive field traversals with in-field activity (30 cells) in imaging versus biasing traversals (field locations for silent cells determined using stimulation trials). Thick lines are the group average. (e) Secondary responses to biasing. Left, FOV from one place-cell biasing experiment (target cell and three others are indicated). Right, ΔF/F traces of neurons with significantly different activity in bias versus control trials (arrows indicate sign of the change). Difference maps (below) represent stimulation minus control for all affected cells in the population. A separate example (including all affected cells) is presented in the second column. Biasing one place cell affected activity in others with nearby fields. (f) Data are presented as in e, but low-power stimulation was applied to three cells at once (TC1–3). Average traces (below) are selected from 24 non-targeted cells differing significantly in bias versus control trials. (g) Neuronal circuit trajectories. Data are presented as in Figure4 d, but comparing imaging-only versus bias traversals (54 cells analyzed, 3 target cells excluded). Biasing three place cells perturbed population activity around the firing fields of those cells.

References

    1. Denk W, Strickler JH, Webb WW. Two-photon laser scanning fluorescence microscopy. Science. 1990;248:73–76. - PubMed
    1. Greenberg DS, Houweling AR, Kerr JN. Population imaging of ongoing neuronal activity in the visual cortex of awake rats. Nat Neurosci. 2008;11:749–751. - PubMed
    1. Dombeck DA, Harvey CD, Tian L, Looger LL, Tank DW. Functional imaging of hippocampal place cells at cellular resolution during virtual navigation. Nat Neurosci. 2010;13:1433–1440. - PMC - PubMed
    1. Petreanu L, et al. Activity in motor-sensory projections reveals distributed coding in somatosensation. Nature. 2012;489:299–303. - PMC - PubMed
    1. Adamantidis AR, Zhang F, Aravanis AM, Deisseroth K, de Lecea L. Neural substrates of awakening probed with optogenetic control of hypocretin neurons. Nature. 2007;450:420–424. - PMC - PubMed

Publication types