. 2014 Dec 15;211(13):2519-35.
doi: 10.1084/jem.20140455. Epub 2014 Nov 17.

CCDC88B is a novel regulator of maturation and effector functions of T cells during pathological inflammation

Affiliations

CCDC88B is a novel regulator of maturation and effector functions of T cells during pathological inflammation

James M Kennedy et al. J Exp Med. .

Abstract

We used a genome-wide screen in mutagenized mice to identify genes which inactivation protects against lethal neuroinflammation during experimental cerebral malaria (ECM). We identified an ECM-protective mutation in coiled-coil domain containing protein 88b (Ccdc88b), a poorly annotated gene that is found expressed specifically in spleen, bone marrow, lymph nodes, and thymus. The CCDC88B protein is abundantly expressed in immune cells, including both CD4(+) and CD8(+) T lymphocytes, and in myeloid cells, and loss of CCDC88B protein expression has pleiotropic effects on T lymphocyte functions, including impaired maturation in vivo, significantly reduced activation, reduced cell division as well as impaired cytokine production (IFN-γ and TNF) in response to T cell receptor engagement, or to nonspecific stimuli in vitro, and during the course of P. berghei infection in vivo. This identifies CCDC88B as a novel and important regulator of T cell function. The human CCDC88B gene maps to the 11q13 locus that is associated with susceptibility to several inflammatory and auto-immune disorders. Our findings strongly suggest that CCDC88B is the morbid gene underlying the pleiotropic effect of the 11q13 locus on inflammation.


Figures

Figure 1.
Figure 1.
An ENU-induced mutation in the Ccdc88b gene protects mice from P. berghei ANKA-induced cerebral malaria. (A) Breeding scheme used to identify recessive, chemically (ENU)-induced mutations that protect mice against lethal experimental cerebral malaria (ECM). (B) Survival plot of P. berghei–infected G3 animals generated by independent mating of the Deric G1 male to G2 females Renée and Lilyan (10 ECM-resistant in 35 G3 mice tested). Renee, n = 8; Lilyan, n = 27; B6, n = 21. (C) Genome-wide linkage mapping in 27 G3 mice (9R, 18S) from G2 female Lilyan detects linkage of the ECM-resistance trait to Chr.19. (LOD = 2.9; P = 0.144). (D) Haplotype analysis for proximal Chr.19 markers (A, mutant B6 homozygote; B, WT B10 homozygote; H, mutant B6/B10 heterozygote). (E) Schematic representation of CCDC88B protein showing the N-terminal microtubule-binding domain (N), two central CCDs and the C-terminal organelle binding domain (top). Exon-intron structure of the Ccdc88b gene, highlighting exons 21 and 22 where an ENU-induced mutation is located (middle). Sequence alignment of the genomic DNA segment overlapping exons 21/22 (boxed) and intron 21 donor splice site (lower case) from WT controls (B6) and from Deric-derived G3 mice (Ccdc88b Hmz Mut); the mutated nucleotide is identified (bold, star), and the position of the alternate donor splice site used to produce the Ccdc88bm1PGrs mRNA transcript is shaded. The sequence of Ccdc88b mRNA (from RT-PCR sequencing) produced by the WT and G1-derived mutant alleles are shown, along with the predicted amino acid sequence of the encoded polypeptides, and associated termination codons at positions 1483 (for WT), and 1286 (Ccdc88bm1PGrs; bottom). (F) Effect of G1-male–derived B6 Chr. 19 haplotypes on survival of F2S mice bred by intercrossing to 129S1 mice illustrates genetic background independence of the ECM resistance trait. Homozygotes, n = 15; heterozygotes, n = 15; 129S1, n = 8; B6, n = 16.
Figure 2.
Figure 2.
Organ and cell-specific expression of Ccdc88b mRNA and CCDC88B protein. Cryosections prepared from newborn (post-natal day 10, p10) (A) and adult male (B) and female (C) mice were used for in situ hybridization. Following hybridization, sections were exposed to photographic emulsion and developed. Parallel sections were stained with cresyl violet (CV), and are shown as references (with scale bar). Ccdc88b mRNA expression is detected in thymus (Th), spleen (Spl), LNs, and BM. Higher magnification images of hybridization signals (longer exposures) detected in the spleen (D), LNs (E), and thymus (F). In the spleen, Ccdc88b mRNA is expressed in the lymphatic nodules (LN) and germinal centers (GC), whereas in thymus it is detected in the medulla (Me) and the cortex (Cx). In LNs, Ccdc88b is expressed in the medulla (Me). Cryosections from spleen, LNs, and thymus were stained and analyzed by immunofluorescence for organ (G) and cell-specific (H) expression of CCDC88B (CCDC; red) and T lymphocyte–specific marker CD3 (CD3; green), showing that CD3+ cells in these organs express CCDC88B. (I) Parallel analysis of the same organs stained with the B lymphocyte marker B220 (green) show a lack of localization of CCDC88B to B220+ B lymphocytes zones (last column). Bars: (A–C) 1 cm; (D–F), 1 mm; (G) 100 µm; (H) 25 µm; (I) 100 µm. Abbreviations used: Adr, adrenal gland; Ar, artery; B, bone; Br, brain; Cb, cerebellum; H, heart; In, incisor; KB, knee bone; Ki, kidney; Li, liver; LI, large intestine; Lu, lung; Ov, ovary; Ovi, oviducts; PB, pelvis bone; R, ribs; Sk, skin; SI, small intestine; SM, skeletal muscle; Spl, spleen; St, stomach; Th, thymus; U, uterus; Ve, vertebrae.
Figure 3.
Figure 3.
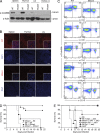
The CCDC88B protein is expressed in CD8+ and CD4+ T lymphocytes and in NK cells of WT mice and is lost in mutant mice. (A) Immunoblotting analysis of total organ extracts from spleen, thymus, LNs, and kidney (used as a negative control) prepared from WT B6 controls (WT) and from Ccdc88bm1PGrs mice (Mutant), and probed with anti-CCDC88B antibody shows absence of CCDC88B protein in mutant animals. Similar loading was verified by probing the same immunoblot with an anti-actin antibody. (B) Immunofluorescence analysis of primary tissues from WT and mutant animals with the anti-CCDC88B antiserum fails to detect expression of CCDC88B protein in tissues from mutants, compared with WT controls. Nuclei were stained with DAPI to localize the cells. Bars, 100 µm. (C) CCDC88B protein expression in primary cells determined by FACS analysis of spleen cell suspensions from WT B6 controls and Ccdc88bm1PGrs mutant mice. Single-cell suspensions were incubated with a cocktail of antibodies directed against T lymphocytes (CD3, CD4, and CD8), B lymphocytes (CD19), and NK cells (NKp46), and then intracellularly stained with the anti-CCDC88B affinity purified antiserum. Numbers in each quadrant indicate the percentage of the total cell population. (D) Survival of bone marrow chimeric mice after infection with PbA (mutant to B6, n = 14; B6 to B6, n = 14; B6 to mutant, n = 4; Mutant to mutant, n = 4). (E) Whole splenocyte and total T cell transfer into Jak3−/− mice (Spl., splenocytes; C57BL6J WT, n = 5; B6 T cells to Jak3−/−, n = 5; Mutant T cells to Jak3−/−, n = 5; Mutant Spl. in Jak3−/−, n = 5; B6 Spl. in Jak3−/−, n = 3; Jak3−/−, n = 5).
Figure 4.
Figure 4.
CCDC88B is required for maturation of T lymphocytes. Spleen cell suspensions from WT and from Ccdc88bm1PGrs mutant mice were incubated with a cocktail of antibodies including T cell–specific anti-CD3, anti-CD4, and anti-CD8, as well as markers of T cell maturation CD44 and CD62L. (A) Expression of CD44 within TCRβ+ CD8+ T cells population (left), total numbers (right), and proportion of CD44hi CD8+ T cells (center) in the gated areas of histograms is shown for WT (B6) and Ccdc88bm1PGrs (Mutant) animals. Similarly, the effect of the Ccdc88b mutation on the expression of CD44 on TCRβ+ CD4+ T cells is shown in B. (C and D) Spleen cells were stained as in A and B for the expression of CD62L and CD44. Dot plots (left) identify naive T cells as CD62L+CD44low (bottom right quadrant). Total numbers (right) and proportion of CD62L+CD44low cells (center) in the gated areas of the dot plot is shown for WT (B6) and Ccdc88bm1PGrs (Mutant) animals for CD4+ and CD8+ T cells. n = 6 for all experiments. Data are representative of at least two independent experiments. Data are represented as mean ± SD. Results are considered significant at P < 0.05 when comparing WT B6 mice to the Ccdc88bm1PGrs mutants (two-tailed Students t test: *, P < 0.05; ***, P < 0. 001).
Figure 5.
Figure 5.
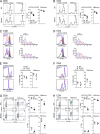
Reduced activity of Ccdc88bm1PGrs mutant T cells in response to nonspecific stimuli or to engagement of T cell receptor. (A and B) Splenocytes from WT (B6) and Ccdc88bm1PGrs mutants were incubated with either PMA/Iono or with anti-CD3 and anti-CD28 antibodies for 6 h. Spleen cells were examined for expression of the activation marker CD69, before (gray line), and after (black line) stimulation CD8+ T cells (A), and CD4+ (B) T cells (n = 4). (C and D) Cells were incubated with CFSE and cell proliferation in response to indicated stimuli was analyzed by FACS for CD8+ (C) and CD4+ (D) T cells after PMA/Iono treatment or TCR engagement (red traces compared with blue traces; n = 3); Quantification is provided using the same color code. (E and F) Cell death was analyzed using a fixable viability, live/dead stain, and gated on live cells. Each peak representing viable (left) and nonviable (right) cells (n = 3). CD8+ (G) and CD4+ (H) T cells from spleen of WT (B6) and Ccdc88bm1PGrs mutants were incubated with either PMA/Iono or with anti-CD3 and anti-CD28 antibodies for 6 h, followed by intracellular staining of TNF and IFN-γ. Results are quantified and expressed as percentage of CD8+ (G) or CD4+ (H) T cells that are positive for TNF, IFN-γ (graphs at the right), or both (from scatter plot) for indicated stimuli. Data are representative of at least two independent experiments. Data are represented as mean ± SD. Results are considered significant at P < 0.05 when comparing WT B6 mice to the Ccdc88bm1PGrs mutants (two-tailed Student’s t test: *, P < 0.05; **, P < 0.01; *** P < 0.001).
Figure 6.
Figure 6.
Reduced T cell activation in Ccdc88bm1PGrs mutant mice during P. berghei–induced ECM. Mice were infected with P. berghei and 5 d later, splenocytes were harvested and incubated with indicated stimuli (anti-CD3/anti-CD28; PMA/Iono) and T cell activation (CD69 expression) was assessed in CD8+ (A) and CD4+ (B) T cells, as described Fig. 5. Intracellular production of TNF, and IFN-γ in CD8+ (C) and CD4+ (D) was also measured in the same cells. All results are quantified and expressed as percentage of CD8+ (A and C) or CD4+ (B and D) T cells that are positive for CD69, TNF, and/or IFN-γ (graphs at the right) for the indicated stimuli. n = 4 in all experiments. Data are representative of at least two independent experiments. Data are represented as mean ± SD. Results are considered significant at P < 0.05 when comparing WT B6 mice to the Ccdc88bm1PGrs mutants (two-tailed Student’s t test: *, P < 0.05; **, P < 0.01; ***, P < 0.001).
Figure 7.
Figure 7.
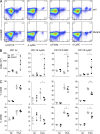
Expression of CCDC88B in myeloid cells and effect of Ccdc88bm1PGrs deficiency. (A) Immunophenotyping of subsets of myeloid cell populations in WT and Ccdc88bm1PGrs mutant mice was as described in Fig. 3 C. Spleen cells from WT and Ccdc88bm1PGrs mutants were stained with a cocktail of anti-CCDC88B, anti-CD11b, anti-Ly6G, anti-F4/80, and anti-Ly6C, and were analyzed by FACS. (B and C) Splenocytes from control (NI) and from P. berghei–infected mice (PbA) were stained with a cocktail of antibodies against myeloid cells (CD11b, Ly6G, Ly6C, and F4/80) markers (A), and the number of each cell type (B) and the proportion of these cells expressing CD40 and CD80 (C) was analyzed. Data are representative of two independent experiments. n = 4 in all experiments. Data are represented as mean ± SD. Results are considered significant at P < 0.05 when comparing WT mice to the Ccdc88bm1PGrs mutants (two-tailed Student’s t test: *, P < 0.05; ***, P < 0.001).
Figure 8.
Figure 8.
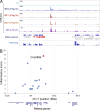
Candidate gene analysis of the human 11q13 locus associated with susceptibility to inflammatory diseases. (A) Chromatin immunoprecipitation sequencing (ChIP-seq) identifies IFN-γ–induced binding peaks for Irf1, Irf8, and Stat1, and LPS-induced binding peaks for p65 (NF-κB) predominantly in the 5′ region of the Ccdc88b gene. (B) An Inflammatory score was calculated for each of the 22 human genes with mouse orthologues in the 600Mb 11q13 locus. This score is based in part on the presence and on the intensity of binding peaks for proinflammatory transcription factors Irf1, Irf8, Stat1, and p65 (NF-κB) as determined by ChIP-seq, as well as expression in inflammatory cells (RNA-seq) and as described in Table S1. The position of each of the genes in the locus listed in Table S1 is shown as exon/intron arrangement and the inflammatory score is indicated at position of their transcriptional start site.

Comment in

Similar articles

Cited by

References

    1. Barish G.D., Yu R.T., Karunasiri M., Ocampo C.B., Dixon J., Benner C., Dent A.L., Tangirala R.K., and Evans R.M.. 2010. Bcl-6 and NF-κB cistromes mediate opposing regulation of the innate immune response. Genes Dev. 24:2760–2765 10.1101/gad.1998010 - DOI - PMC - PubMed
    1. Beecham A.H., Patsopoulos N.A., Xifara D.K., Davis M.F., Kemppinen A., Cotsapas C., Shah T.S., Spencer C., Booth D., Goris A., et al. . International IBD Genetics Consortium (IIBDGC). 2013. Analysis of immune-related loci identifies 48 new susceptibility variants for multiple sclerosis. Nat. Genet. 45:1353–1360 10.1038/ng.2770 - DOI - PMC - PubMed
    1. Berghout J., Langlais D., Radovanovic I., Tam M., MacMicking J.D., Stevenson M.M., and Gros P.. 2013. Irf8-regulated genomic responses drive pathological inflammation during cerebral malaria. PLoS Pathog. 9:e1003491 10.1371/journal.ppat.1003491 - DOI - PMC - PubMed
    1. Bongfen S.E., Rodrigue-Gervais I.-G., Berghout J., Torre S., Cingolani P., Wiltshire S.A., Leiva-Torres G.A., Letourneau L., Sladek R., Blanchette M., et al. . 2012. An N-ethyl-N-nitrosourea (ENU)-induced dominant negative mutation in the JAK3 kinase protects against cerebral malaria. PLoS ONE. 7:e31012 10.1371/journal.pone.0031012 - DOI - PMC - PubMed
    1. Broman K.W., Wu H., Sen S., and Churchill G.A.. 2003. R/qtl: QTL mapping in experimental crosses. Bioinformatics. 19:889–890 10.1093/bioinformatics/btg112 - DOI - PubMed

Publication types

MeSH terms