. 2014 Dec 15;211(13):2567-81.
doi: 10.1084/jem.20140457. Epub 2014 Nov 17.

CXCR4 and a cell-extrinsic mechanism control immature B lymphocyte egress from bone marrow

Affiliations

CXCR4 and a cell-extrinsic mechanism control immature B lymphocyte egress from bone marrow

Thomas C Beck et al. J Exp Med. .

Abstract

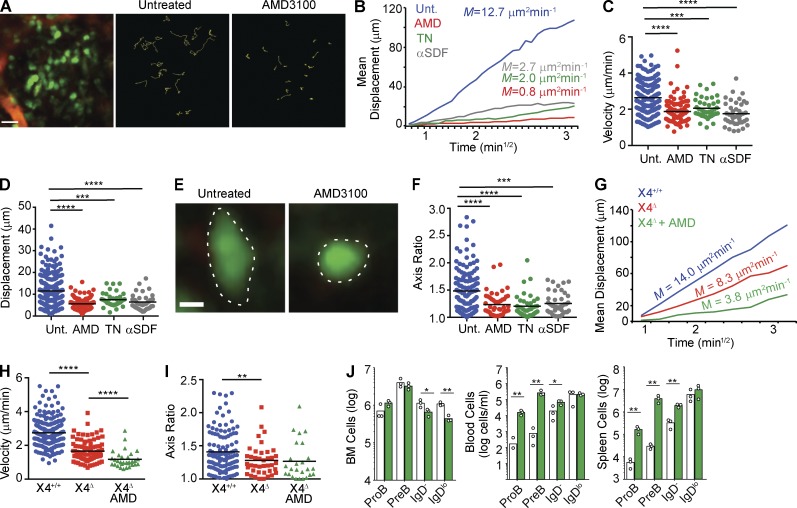
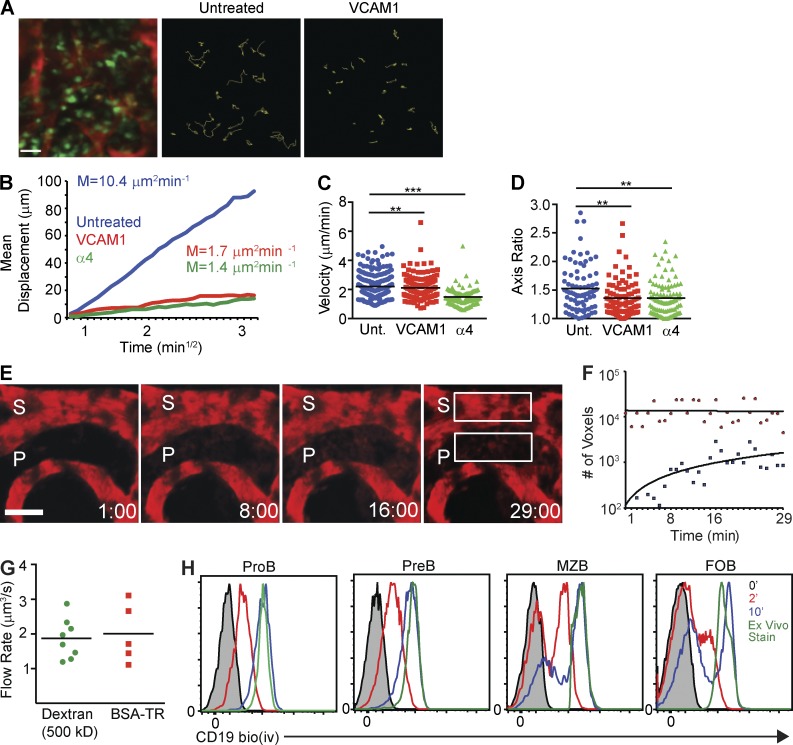
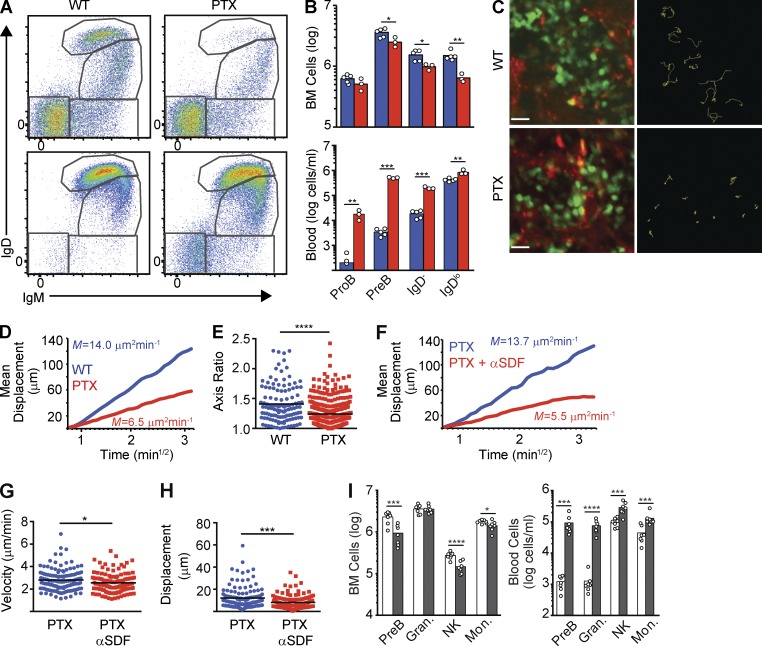
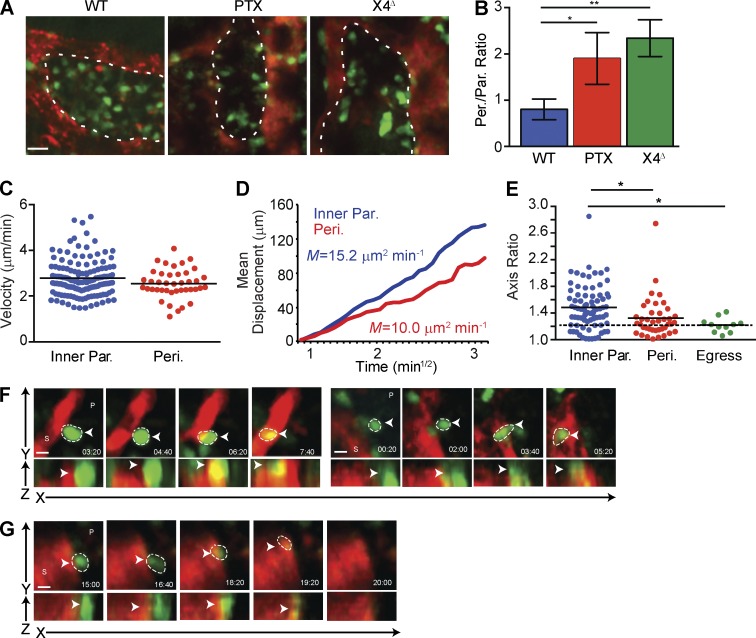
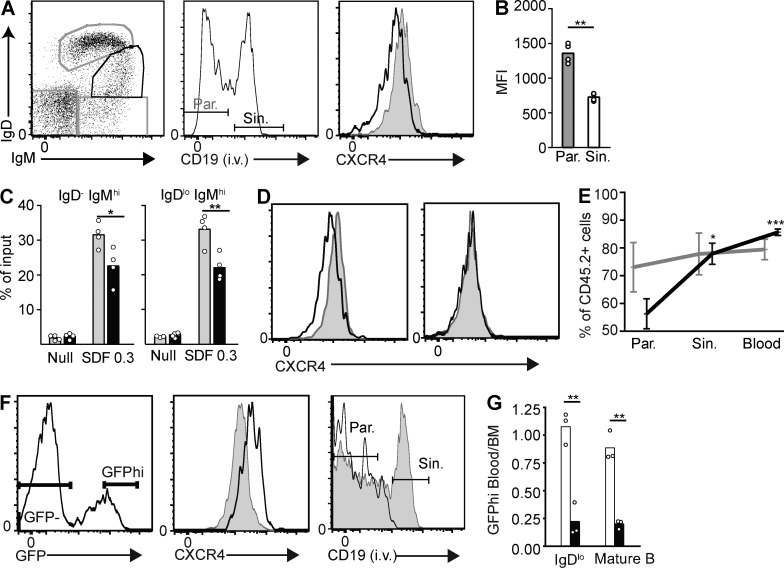
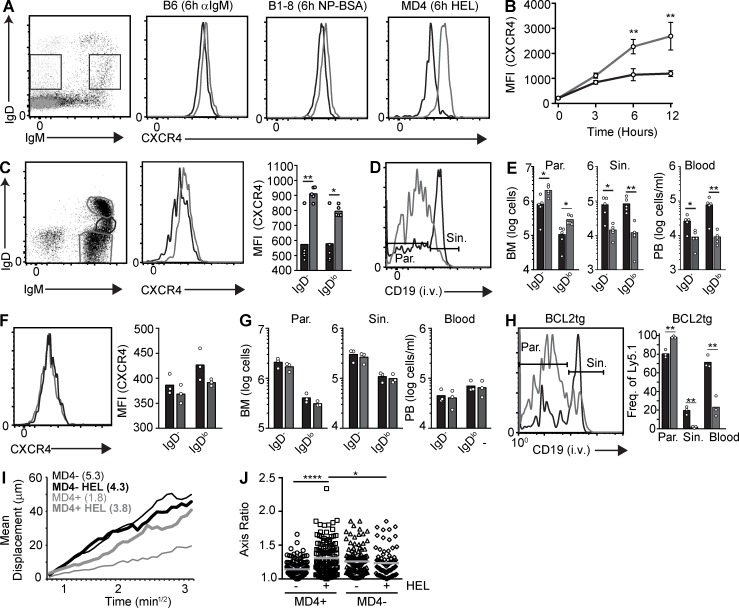
Leukocyte residence in lymphoid organs is controlled by a balance between retention and egress-promoting chemoattractants sensed by pertussis toxin (PTX)-sensitive Gαi protein-coupled receptors (GPCRs). Here, we use two-photon intravital microscopy to show that immature B cell retention within bone marrow (BM) was strictly dependent on amoeboid motility mediated by CXCR4 and CXCL12 and by α4β1 integrin-mediated adhesion to VCAM-1. However, B lineage cell egress from BM is independent of PTX-sensitive GPCR signaling. B lineage cells expressing PTX rapidly exited BM even though their motility within BM parenchyma was significantly reduced. Our experiments reveal that when immature B cells are near BM sinusoids their motility is reduced, their morphology is predominantly rounded, and cells reverse transmigrate across sinusoidal endothelium in a largely nonamoeboid manner. Immature B cell egress from BM was dependent on a twofold CXCR4 down-regulation that was antagonized by antigen-induced BCR signaling. This passive mode of cell egress from BM also contributes significantly to the export of other hematopoietic cells, including granulocytes, monocytes, and NK cells, and is reminiscent of erythrocyte egress.


Figures

Figure 1.
Figure 1.
CXCR4 antagonism inhibits B lineage cell migration in BM. (A–F) Rag1GFP/+ mice were injected i.v. with AMD3100, TN14003, or anti-CXCL12 antibody. Blood vessels were labeled with 2,000-kD dextran-rhodamine injected i.v. Cell movement was tracked by IVM of calvaria immediately before and after treatment. (A, left) Distribution of GFP+ B cells (green) in BM. (middle and right) Movement of GFP+ B cells tracked for 30 min before and after AMD3100 treatment, respectively. Colored lines represent cell trajectories. Data are representative of three individual experiments. (B) Mean motility coefficient of B lineage cells before (blue) and after (red) treatment with CXCR4 antagonists. Cell displacement from starting coordinates is plotted against the square root of time. Lines depict the average mean motility coefficient calculated from three individual experiments. (C) Median velocity (µm/min). (D) Displacement (µm). (E) Morphology of GFP+ B lineage cells before (left) and after (right) AMD3100 treatment. Dotted lines depict the cells’ borders. Bars: (A) 20 µm; (E) 30 µm. (F) Measurement of cell axis ratio of GFP+ B lineage cells before (blue) and after (red) treatment with CXCR4 inhibitors. (G–I) WT (Mb1Cre/+) and CXCR4 KO (Mb1Cre/+ Cxcr4Fl/−) were treated as in A–F. (G) Mean motility coefficient of WT (blue) and CXCR4 KO (red) B lineage cells before (red) and after (green) treatment with AMD3100. Colored lines depict average mean motility coefficient calculated from three independent datasets. (H) Median cell velocity of WT (blue) and CXCR4 KO (red) B lineage cells before (red) and after (green) treatment with AMD3100. (I) Cell axis ratio of GFP+ (Mb1Cre/+, blue) and CXCR4 KO (Mb1Cre/+ Cxcr4Fl/−, red) B lineage cells. (G–I) Data are representative of two independent experiments. (C, D, F, H, and I) Lines indicate mean. (J) Enumeration of B lineage cells in BM, blood, and spleen of Mb1Cre/+ Cxcr4+/+ (open bars) and Mb1Cre/+ Cxcr4Fl/− (green bars) mice. Bars indicate mean, and circles indicate individual mice. Data are representative of three independent experiments. *, P < 0.05; **, P < 0.005; ***, P < 0.0005; ****, P < 0.00005 by unpaired Student’s t test.
Figure 2.
Figure 2.
Developing B cell motility in BM parenchyma is strictly dependent on α4β1 integrin–mediated adhesion to VCAM-1. (A–D) Rag1GFP/+ were injected (i.v.) with integrin α4 or VCAM-1 blocking antibodies, and calvarial BM was imaged before and immediately after treatment. Blood vessels were labeled with 2,000-kD dextran-rhodamine injected i.v. (A, left) Distribution of GFP+ B cells (green) in BM. (middle and right) Movement of GFP+ B cells tracked for 30 min before and after treatment with anti–VCAM-1 antibody. Colored lines represent cell trajectories. (B) Mean motility coefficient of B lineage cells before (blue line) and after VCAM-1 (red) and α4 blockade (green). Lines depict the average mean motility coefficient calculated from three independent experiments. (C) Median velocity (µm/min). (D) Cell axis ratios before (blue) and after treatment with VCAM-1 (red) and α4 (green) blocking antibodies. The data are representative of three independent experiments. (C and D) Lines indicate mean. (E) Mice were injected with 50 µg of 500-kD FITC-conjugated dextran (i.v.), and calvaria BM was imaged before and after treatment. BM vasculature (S) and parenchyma (P) are indicated. White boxes delineate regions of interest used for measurements of dextran perfusion. Time is shown in each panel (mm:ss). (A and E) Bars, 20 µm. (F) FITC-conjugated dextran perfusion of BM parenchyma and vasculature (red fluorescent voxels; y axis) over 30 min (time; x axis). Data are representative of >10 independent experiments. (G) Interstitial fluid flow rate (µm3/s) determined after injection (i.v.) of FITC-dextran (500 kD; green) or BSA–Texas red (red). Lines indicate the mean; symbols represent regions of interest obtained from three mice (FITC-dextran) or from two mice (BSA–Texas red). (H) In vivo staining of pro-B and pre-B cells in BM and of marginal zone (MZB) and follicular (FOB) B cell subsets in spleen with biotin–anti-CD19 antibody administered i.v. for 2 (red) or 10 (blue) min. Saturation with anti-CD19 antibody was determined by ex vivo staining with excess antibody (green). Data are representative of three independent experiments. **, P < 0.005; ***, P < 0.0005 by unpaired Student’s t test.
Figure 3.
Figure 3.
B cells egress BM independently of GPCR-mediated migration. (A) IgM and IgD expression in live gated (DAPI) B220+ cells in BM (top) and PB (bottom) of Mb1Cre/+ (WT, left) and Mb1Cre/+ Rosa26PTX/+ mice (PTX, right). (B) Quantification of developing B cell subsets in BM (top) and PB (bottom) of Mb1Cre/+ mice (blue bars) and Mb1Cre/+ Rosa26PTX/+ mice (red bars). Bars indicate mean, and circles depict individual mice analyzed. Data are representative of more than three independent experiments. (C) IVM of PTX-expressing B lineage cells in calvaria BM. Blood vessels were visualized with BSA–Texas red. (top) Distribution of GFP+ B cells (left) and the movement of GFP+ B cells tracked for 30 min in BM (right) of Mb1Cre/+ mice (WT). (bottom) Distribution of GFP+ B cells (left) and the movement of GFP+ B cells tracked for 30 min in BM (right) of Mb1Cre/+ Rosa26PTX/+ mice (PTX). Colored lines represent cell trajectories. The data are representative of at least three independent experiments. Bars, 20 µm. (D) Mean motility coefficient of WT and PTX-expressing B lineage cells. Lines depict the average mean motility coefficient calculated from three independent mice. (E) Cell axis ratios of WT and PTX-expressing cells. (F–H) Analysis of the mean motility coefficient (F), median velocity (µm/min; G), and displacement (µm; H) of PTX-expressing B lineage cells before (blue) and after treatment with 250 µg anti-CXCL12 antibody (αSDF, red). M indicates mean motility coefficient in µm2/min. Lines depict the average mean motility coefficient calculated from datasets obtained by IVM of three different mice. (E, G, and H) Lines indicate mean. (I) Numbers of pre-B cells, NK cells, granulocytes (Gran.) and inflammatory monocytes (Mon.) in BM and PB of WT mice treated with saline (open bars) or with 1 µg PTX for 24 h (gray bars). Data are representative of more than three independent experiments. *, P < 0.05; **, P < 0.005, ***, P < 0.0005; ****, P < 0.00005 by unpaired Student’s t test.
Figure 4.
Figure 4.
Morphology and motility of developing B cells during BM egress. (A) Distribution of B lineage (Rag1GFP/+) cells in BM of Mb1Cre/+ Rosa26+/+ mice (WT, left), Mb1Cre/+ Rosa26PTX/+ mice (PTX, middle), and Mb1Cre/+ Cxcr4Fl/− mice (X4Δ, right). Dotted lines indicate border between sinusoids and parenchyma. (B) Ratio of B lineage cells proximal (<10 µm) and distal (>10 µm) to BM sinusoids. Data depicted were from >90 B lineage cells analyzed in three WT, PTX, and X4Δ mice. Bars indicate mean (±SEM). (C–E) Cell motility parameters of developing B cells in parenchyma and in perisinusoidal space. (C) Median velocity (µm/min). (D) Mean motility coefficient of Rag1GFP/+ B lineage cells in inner parenchyma (Inner Par. blue) and in perisinusoidal areas (Per. red). Mean cell displacement from starting coordinates is plotted against the square root of time. Lines depict the average mean motility coefficient of >70 inner parenchyma and 40 perisinusoidal areas GFP+ B cells. (E) Axis ratio (x/y). Dotted line depicts the mean axis ratio of Mb1Cre/+ Rosa26PTX/+ B cells in BM parenchyma (1.2). (C and E) Lines indicate means. (F and G) Two WT GFP+ B cells (F) and one PTX-expressing GFP+ B cell (G) exiting from BM parenchyma (P) into sinusoids (S). Arrowheads point to cell egress. Time is shown in mm:ss. WT and PTX-expressing cell egress examples were captured from more than 10 and 4 independent experiments, respectively. Bars: (A) 19 µm; (F and G) 5 µm. *, P < 0.05; **, P < 0.005 by unpaired Student’s t test. Unpaired Student’s t test with Welch’s correction was used in E.
Figure 5.
Figure 5.
CXCR4 expression in egress-competent immature B lymphocytes. (A) CXCR4 expression in B220+ immature IgM+ IgDlo B cells positioned in BM parenchyma (Par.) and sinusoids (Sin.). (left) IgM and IgD expression in B220+ BM cells. (middle) Distribution of B220+ CD93+ IgM+ IgDlo B cells in BM parenchyma (CD19-PE) and sinusoids (CD19-PE+). (right) CXCR4 expression in B220+ immature IgM+ IgDlo B cells in parenchyma (gray) and sinusoids (black line). (B) Geometric mean fluorescence intensity (MFI) of CXCR4 surface expression in BM parenchyma and sinusoid immature CD93+ IgM+ IgDlo B cells from C57BL/6 mice (n = 4). Bars indicate the mean; circles indicate individual mice. Data are representative of >10 independent experiments. (C) Cell migration through 5-µm transwells. Cxcr4+/+ (gray bars) and Cxcr4+/− (black bars) immature CD93+ IgMhi IgD (left) and IgDlo (right) cells were allowed to migrate toward 0.3 µg/ml CXCL12 for 3 h. Bars indicate mean, and circles indicate replicates. Data were pooled from two independent experiments. (D, left) CXCR4 surface expression in Mb1Cre/+ Cxcr4Fl/+ immature IgM+ IgDlo cells overlaid with Mb1Cre/+ Cxcr4+/+ immature IgM+ IgDlo cells in BM parenchyma. (right) CXCR4 surface expression in Ly5.1+ Mb1Cre/+ Cxcr4Fl/+ immature IgM+ IgDlo cells in BM parenchyma overlaid with Ly5.2+ (Cxcr4+/+) immature IgM+ IgDlo cells residing in sinusoids. (E) Distribution of B220+ CD93+ IgM+ IgDlo immature B cells in BM parenchyma, sinusoids, and PB of lethally irradiated mice reconstituted with a mixture of Ly5.1+ Mb1Cre/+ Cxcr4+/+ and Ly5.2+ WT cells (gray) or with Ly5.1+ Mb1Cre/+ Cxcr4Fl/+ and Ly5.2+ WT cells (black). Error bars indicate ±SEM. (F) Overexpression of truncated CXCR4 (R334X WHIM mutation) in BM cell subsets reported by GFP expression. (left) GFP expression in gated B220+ CD93+ IgM+ IgDlo immature B cells. (middle) CXCR4 surface expression in gated GFP (gray) and GFP+ (black line) B220+ CD93+ IgM+ IgDlo immature B cells. (right) Distribution of CXCR4-transduced (GFP+) B220+ CD93+ IgM+ IgDlo immature B cells in BM parenchyma and sinusoids. (G) Ratio of the frequencies of GFPhi immature IgDlo and mature B cells in PB and in BM. Bars indicate mean; circles indicate individual mice. Data were pooled from three independent experiments. *, P < 0.05; **, P < 0.005; ***, P < 0.0005 by unpaired Student’s t test.
Figure 6.
Figure 6.
BCR signaling increases CXCR4 expression, promotes B lymphocyte motility, and prevents BM egress. (A) IgM and IgD expression in unstimulated and BCR-stimulated B220+ cells (left and right gates, respectively). (B) CXCR4 mean fluorescence intensity (MFI) in IgM+ IgDlo CD93+ MD4 B cells untreated (black) or stimulated with 1 mg/ml HEL (gray) for the indicated time periods. Lines indicate mean (±SEM) of three independent experiments. (C) CXCR4 surface expression in unstimulated (black) and in vivo HEL-stimulated (6 h; gray) immature (CD93+) MD4 B cell subsets. (D) MD4 immature IgM+ IgDlo CD93+ B cell distribution in BM before and after HEL i.v. treatment for 6 h. (E) Quantification of immature B cell subsets in BM parenchyma (Par.), sinusoids (Sin.), and PB of MD4 mice treated with HEL for 6 h. (F) CXCR4 surface expression in WT immature IgM+ IgDlo CD93+ B cells stimulated with PBS (black) or with HEL i.v. (gray). (right) CXCR4 MFI on unstimulated (black) and HEL-stimulated (gray) immature IgM+ IgDlo CD93+ B cells from WT mice. (G) Quantification of immature B cell subsets in BM parenchyma, sinusoids, and PB of WT mice treated with HEL for 6 h. (H, left) Distribution of immature IgM+ IgDlo CD93+ MD4 B cells overexpressing Bcl2 in BM parenchyma (CD19-PE) and in sinusoids (CD19-PE+). (right) Immature CD93+ IgM+ IgDlo B cell numbers in BM parenchyma, sinusoids, and PB of MD4.BCL2 transgenic mice treated with HEL. (E, G, and H) Bars indicate mean, and circles depict individual mice. Data are representative of two independent experiments. (I) Mean motility coefficient of MD4+ and MD4 Cd19Cre/+ Rosa26ZsGreen/+ B lineage cells before and 6 h after treatment with HEL i.v. Lines depict the average mean motility coefficient calculated from datasets obtained by IVM of two to three mice. (J) Axis ratio (x/y) of MD4+ and MD4 Cd19Cre/+ Rosa26ZsGreen/+ B lineage cells before and 6 h after HEL treatment i.v. Circles, unstimulated MD4+ B cells; squares, HEL-stimulated MD4+ B cells; triangles, HEL-stimulated MD4 B cells; diamonds, MD4 unstimulated B cells. Lines indicate mean. Data are representative of three independent experiments. *, P < 0.05; **, P < 0.005; ****, P < 0.00005 by unpaired Student’s t test.

References

    1. Allende M.L., Tuymetova G., Lee B.G., Bonifacino E., Wu Y.P., and Proia R.L.. 2010. S1P1 receptor directs the release of immature B cells from bone marrow into blood. J. Exp. Med. 207:1113–1124 10.1084/jem.20092210 - DOI - PMC - PubMed
    1. Alon R., and Feigelson S.W.. 2009. Chemokine signaling to lymphocyte integrins under shear flow. Microcirculation. 16:3–16 10.1080/10739680802026076 - DOI - PubMed
    1. Arnon T.I., Horton R.M., Grigorova I.L., and Cyster J.G.. 2013. Visualization of splenic marginal zone B-cell shuttling and follicular B-cell egress. Nature. 493:684–688 10.1038/nature11738 - DOI - PMC - PubMed
    1. Bai A., Hu H., Yeung M., and Chen J.. 2007. Kruppel-like factor 2 controls T cell trafficking by activating L-selectin (CD62L) and sphingosine-1-phosphate receptor 1 transcription. J. Immunol. 178:7632–7639 10.4049/jimmunol.178.12.7632 - DOI - PubMed
    1. Bernardini G., Sciumè G., Bosisio D., Morrone S., Sozzani S., and Santoni A.. 2008. CCL3 and CXCL12 regulate trafficking of mouse bone marrow NK cell subsets. Blood. 111:3626–3634 10.1182/blood-2007-08-106203 - DOI - PubMed

Publication types