. 2015 Jan;59(1):642-9.
doi: 10.1128/AAC.04180-14. Epub 2014 Nov 17.

Radioiodinated DPA-713 imaging correlates with bactericidal activity of tuberculosis treatments in mice

Affiliations

Radioiodinated DPA-713 imaging correlates with bactericidal activity of tuberculosis treatments in mice

Alvaro A Ordonez et al. Antimicrob Agents Chemother. 2015 Jan.

Abstract

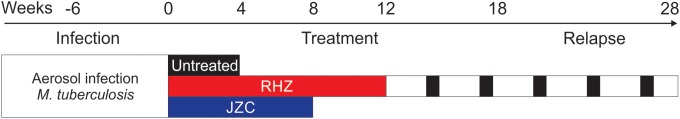
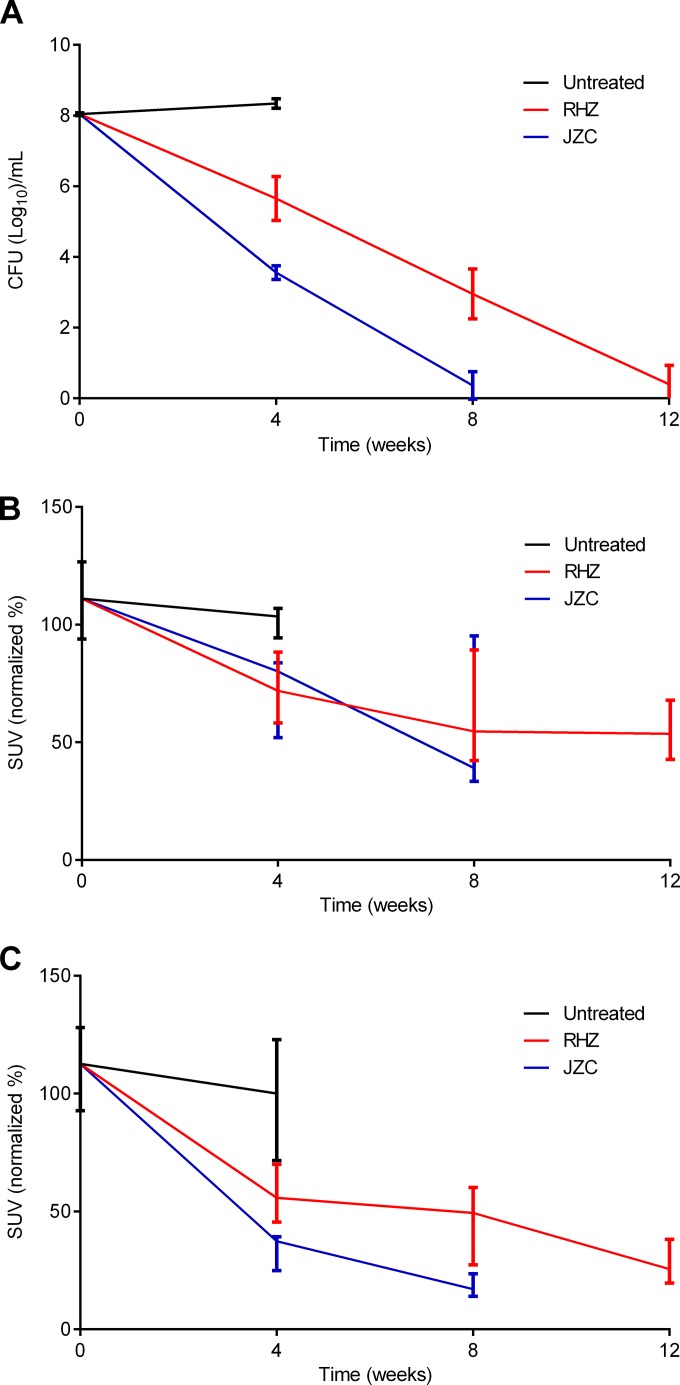
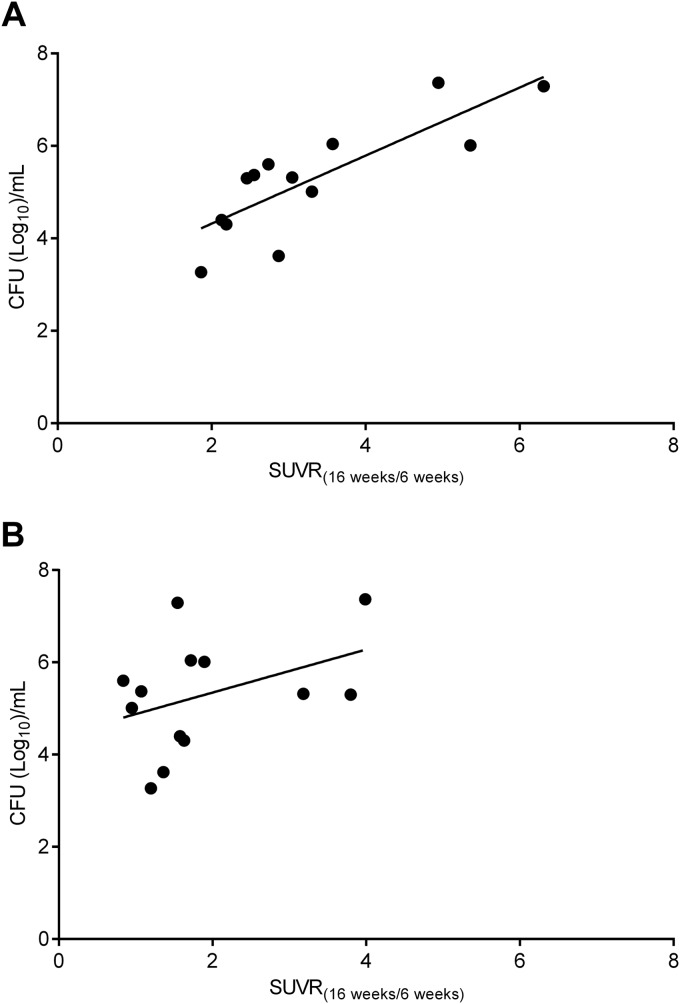
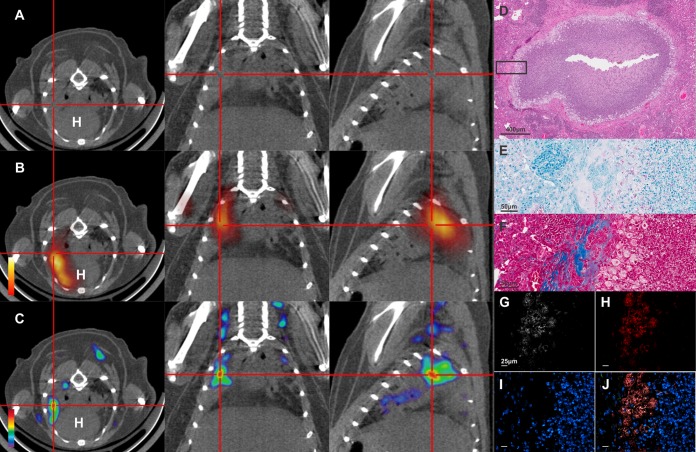
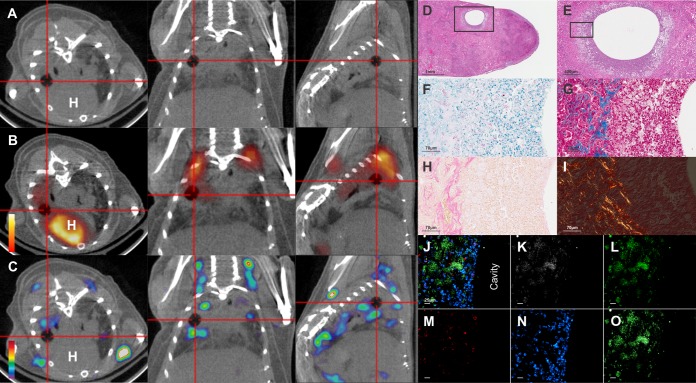
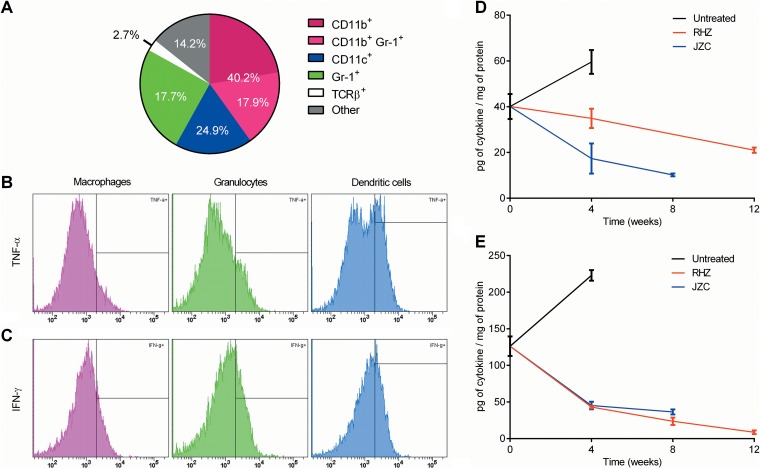
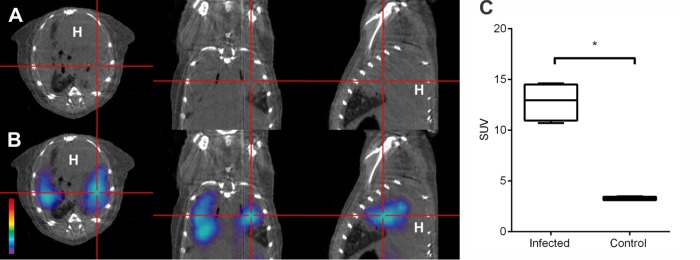
Current tools for monitoring response to tuberculosis treatments have several limitations. Noninvasive biomarkers could accelerate tuberculosis drug development and clinical studies, but to date little progress has been made in developing new imaging technologies for this application. In this study, we developed pulmonary single-photon emission computed tomography (SPECT) using radioiodinated DPA-713 to serially monitor the activity of tuberculosis treatments in live mice, which develop necrotic granulomas and cavitary lesions. C3HeB/FeJ mice were aerosol infected with Mycobacterium tuberculosis and administered either a standard or a highly active bedaquiline-containing drug regimen. Serial (125)I-DPA-713 SPECT imaging was compared with (18)F-fluorodeoxyglucose ((18)F-FDG) positron emission tomography (PET) and standard microbiology. Ex vivo studies were performed to characterize and correlate DPA-713 imaging with cellular and cytokine responses. Pulmonary (125)I-DPA-713 SPECT, but not (18)F-FDG PET, was able to correctly identify the bactericidal activities of the two tuberculosis treatments as early as 4 weeks after the start of treatment (P < 0.03). DPA-713 readily penetrated the fibrotic rims of necrotic and cavitary lesions. A time-dependent decrease in both tumor necrosis factor alpha (TNF-α) and interferon gamma (IFN-γ) levels was observed with treatments, with (125)I-DPA-713 SPECT correlating best with tissue TNF-α levels (ρ = 0.94; P < 0.01). (124)I-DPA-713 was also evaluated as a PET probe and demonstrated a 4.0-fold-higher signal intensity in the infected tuberculous lesions than uninfected controls (P = 0.03). These studies provide proof of concept for application of a novel noninvasive imaging biomarker to monitor tuberculosis treatments, with the potential for application for humans.


Figures

FIG 1
FIG 1
Timeline and experimental scheme. Six weeks after aerosol infection with Mycobacterium tuberculosis, mice were randomly divided into treatment groups. Different animal cohorts received either the standard (RHZ) or a highly active bedaquiline-containing regimen (JZC). Animals receiving standard treatment were also followed for 16 weeks after the completion of treatment to monitor for relapse. Mice were serially imaged at weeks 0, 4, 8, and 12 to assess the bactericidal activity. A separate cohort of 13 animals which received 12 weeks of standard (RHZ) treatment were followed for the development of relapse and imaged at weeks 18 and 28 (6 and 16 weeks after cessation of TB treatment). The pulmonary bacterial burdens from a separate cohort of similarly infected and treated mice were determined using standard microbiology at each time point.
FIG 2
FIG 2
125I-DPA-713 SPECT imaging correlates with bactericidal activity of TB treatments. Four-to-six-week-old female C3HeB/FeJ mice were aerosol infected with M. tuberculosis. Mice were sacrificed to determine the bacillary burden of whole lungs 1 day after infection and at each time point. A separate group of identically infected mice were used for imaging studies. Six weeks after infection, mice were randomly divided into treatment groups and orally administered (five times per week) either the standard RHZ or a highly active JZC regimen for 12 and 8 weeks, respectively. (A) Consistent with the higher bactericidal activity of bedaquiline-containing regimens, 8 weeks of treatment with JZC cleared the infection in the majority of mice, versus 12 weeks required to achieve the same bacterial killing with the standard (RHZ) treatment. (B) Pulmonary 18F-FDG PET imaging correlated with the pulmonary bacterial burden (Spearman's ρ = 0.78; P < 0.01) but was unable to correctly identify the bactericidal activities of the two TB treatments (P > 0.49). (C) Pulmonary 125I-DPA-713 SPECT imaging correlated well with the pulmonary bacterial burden (Spearman's ρ = 0.92; P < 0.01) and also correctly identified the bactericidal activities of the two TB regimens as early as 4 weeks after the start of treatment (P < 0.03). CFU data are presented on a logarithmic scale as means and standard deviations. The SUV are presented as percentages of the signal noted at the initial time point (start of treatment) on a linear scale, expressed as medians and interquartile ranges.
FIG 3
FIG 3
Correlation between imaging and bacterial burden during relapse. M. tuberculosis-infected mice were serially imaged 16 weeks after completion of standard (RHZ) TB treatment to monitor relapse. The correlation between the change in the standardized uptake value ratio (SUVR) between 6 and 16 weeks after cessation of TB treatment (SUVR16week/6week) and postmortem pulmonary bacterial burdens at the final imaging time point is shown. Each data point represents an independent animal. A significant correlation was found between 125I-DPA-713 SPECT results and bacterial burden (Spearman's ρ = 0.79; P < 0.01) (A) but not between 18F-FDG PET imaging and bacterial burden (Spearman's ρ = 0.34; P = 0.26) (B).
FIG 4
FIG 4
Imaging of necrotic pulmonary TB lesions. The transverse (left), coronal (middle), and sagittal (right) views from an M. tuberculosis-infected mouse (8 weeks after infection; no TB treatment) demonstrating a necrotic TB lesion (cross-hairs) are shown. (A) The TB lesion is visible as a radiodense area on the CT images. (B) The 18F-FDG PET signal localizes at the site of the TB lesion. (C) The 125I-DPA-713 SPECT signal also colocalizes with the TB lesion. H, heart. (D) Postmortem histopathology (hematoxylin and eosin staining [H&E]) demonstrates a necrotic granuloma with a cellular rim. (E) Both intracellular and extracellular bacilli are seen on acid-fast stain. (F) Masson's trichrome stain demonstrates collagen deposition (blue) at the fibrotic rim of the necrotic granuloma. Immunofluorescence demonstrates signal from DPA-713-IRDye680LT (G), CD11b+ macrophages (H), and Hoechst stain for nuclei (I). (J) Overlay of all channels shows that DPA-713-IRDye680LT penetrates the fibrotic lesion and colocalizes with the CD11b+ signal.
FIG 5
FIG 5
Imaging of cavitary pulmonary TB lesions. The transverse (left), coronal (middle), and sagittal (right) views from an M. tuberculosis-infected mouse demonstrating a cavitary TB lesion (cross-hairs) are shown. (A) The cavitary lesion is visible as a radiolucency on the CT images. (B) The 18F-FDG PET signal localizes at the rim of the cavity. (C) The 125I-DPA-713 SPECT signal also colocalizes with the rim of the cavitary lesion. H, heart. (D and E) Postmortem histopathology (H&E) demonstrates a cavity with a cellular rim. (F) Both intracellular and extracellular bacilli are seen on acid-fast stain. (G and H) Collagen deposition is noted on Masson's trichrome (blue [G]) and reticulin (pink [H]) stains at the fibrotic rim of the cavity. (I) Picrosirius red stain observed under circularly polarized light microscopy demonstrates both mature (red) and immature (yellow; birefringence) collagen fibers surrounding the cavity. Immunofluorescence demonstrates signal from DPA-713-IRDye680LT (K), CD11b (L) CD3 (M) and Hoechst stain for nuclei (N). (O) Overlay of the DPA-713-IRDye680LT and CD11b channels demostrates colocalization of the signals. (J) Overlay of all channels demonstrating that DPA-713-IRDye680LT penetrates the fibrotic lesion and colocalizes with the CD11b+ signal.
FIG 6
FIG 6
Correlation with cellular and cytokine responses. To confirm and characterize the phenotype of DPA-713+ cells, multicolor flow-cytometric analyses were performed in whole-lung homogenates from M. tuberculosis-infected animals (8 weeks postinfection). (A) Pie chart depicting the percentages of CD11b+ (macrophages), CD11b+ Gr-1+ (inflammatory macrophages), Gr-1+ (granulocytes), CD11c+ (dendritic cells), TCR-β+ (T cells), and other cells within the parent DPA-713+ gate. (B and C) Respective histograms showing the proportion of DPA-713+ CD68+ cells with intracellular expression of TNF-α and IFN-γ by cell subset. (D and E) Tissue cytokine levels in whole-lung homogenates from animals receiving TB treatments for TNF-α and IFN-γ. Cytokine data are presented on a linear scale as means and standard errors of the means. Five biological samples were used for each analyses.
FIG 7
FIG 7
Pulmonary 124I-DPA-713 PET imaging. The transverse (left), coronal (middle), and sagittal (right) views from an M. tuberculosis-infected mouse (8 weeks after infection; no TB treatment) demonstrating a TB lesion (cross-hairs) are shown. (A and B) CT and 124I-DPA-713 PET demonstrate colocalization of the PET signal with the TB lesion observed on the CT image. (C) The pulmonary 124I-DPA-713 PET signal from M. tuberculosis-infected mice is significantly higher than the signals from uninfected (control) animals (P = 0.03). Standardized uptake values (SUV) are represented as box plots, where central bars represent medians, the edges of the boxes represent quartiles, and whiskers show the upper and lower limits of the range. At least four mice were imaged for each group.

References

    1. Dye C, Williams BG. 2008. Eliminating human tuberculosis in the twenty-first century. J R Soc Interface 5:653–662. doi:10.1098/rsif.2007.1138. - DOI - PMC - PubMed
    1. Boehme CC, Nabeta P, Hillemann D, Nicol MP, Shenai S, Krapp F, Allen J, Tahirli R, Blakemore R, Rustomjee R, Milovic A, Jones M, O'Brien SM, Persing DH, Ruesch-Gerdes S, Gotuzzo E, Rodrigues C, Alland D, Perkins MD. 2010. Rapid molecular detection of tuberculosis and rifampin resistance. N Engl J Med 363:1005–1015. doi:10.1056/NEJMoa0907847. - DOI - PMC - PubMed
    1. Centers for Disease Control and Prevention. 2006. Emergence of Mycobacterium tuberculosis with extensive resistance to second-line drugs—worldwide, 2000-2004. MMWR Morb Mortal Wkly Rep 55:301–305. doi:10.1037/e566482006-002. - DOI - PubMed
    1. Velayati AA, Masjedi MR, Farnia P, Tabarsi P, Ghanavi J, Ziazarifi AH, Hoffner SE. 2009. Emergence of new forms of totally drug-resistant tuberculosis bacilli: super extensively drug-resistant tuberculosis or totally drug-resistant strains in Iran. Chest 136:420–425. doi:10.1378/chest.08-2427. - DOI - PubMed
    1. Davis SL, Nuermberger EL, Um PK, Vidal C, Jedynak B, Pomper MG, Bishai WR, Jain SK. 2009. Noninvasive pulmonary [18F]-2-fluoro-deoxy-d-glucose positron emission tomography correlates with bactericidal activity of tuberculosis drug treatment. Antimicrob Agents Chemother 53:4879–4884. doi:10.1128/AAC.00789-09. - DOI - PMC - PubMed

Publication types