. 2015 Feb;244(2):181-210.
doi: 10.1002/dvdy.24229. Epub 2014 Dec 16.

Microarray identification of novel genes downstream of Six1, a critical factor in cranial placode, somite, and kidney development

Affiliations

Microarray identification of novel genes downstream of Six1, a critical factor in cranial placode, somite, and kidney development

Bo Yan et al. Dev Dyn. 2015 Feb.

Abstract

Background: Six1 plays an important role in the development of several vertebrate organs, including cranial sensory placodes, somites, and kidney. Although Six1 mutations cause one form of branchio-otic syndrome (BOS), the responsible gene in many patients has not been identified; genes that act downstream of Six1 are potential BOS candidates.

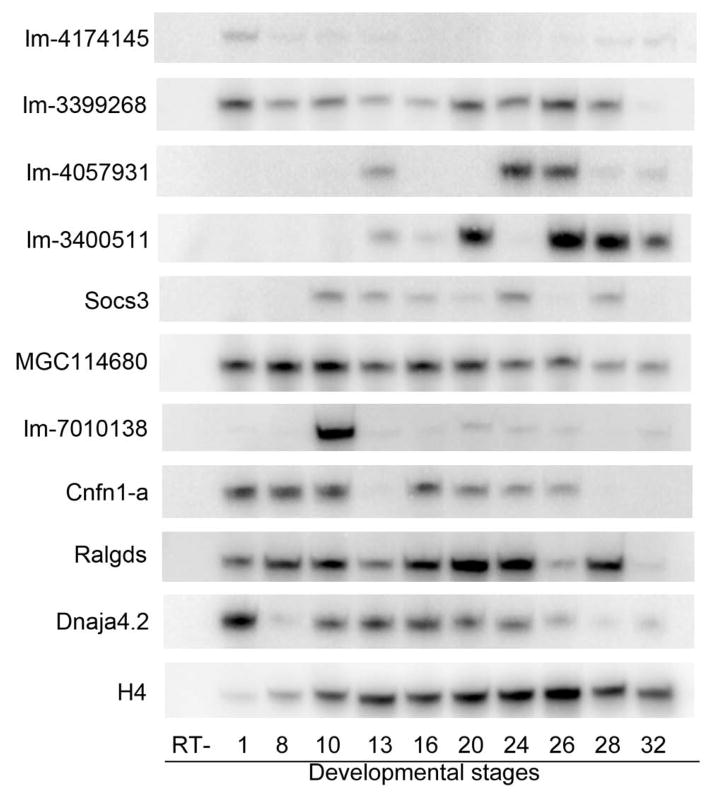
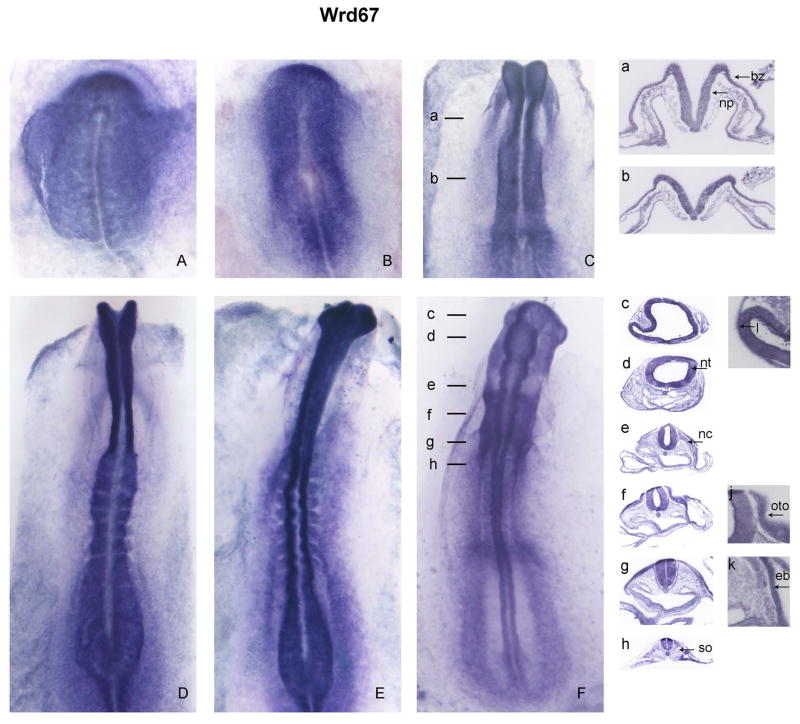
Results: We sought to identify novel genes expressed during placode, somite and kidney development by comparing gene expression between control and Six1-expressing ectodermal explants. The expression patterns of 19 of the significantly up-regulated and 11 of the significantly down-regulated genes were assayed from cleavage to larval stages. A total of 28/30 genes are expressed in the otocyst, a structure that is functionally disrupted in BOS, and 26/30 genes are expressed in the nephric mesoderm, a structure that is functionally disrupted in the related branchio-otic-renal (BOR) syndrome. We also identified the chick homologues of five genes and show that they have conserved expression patterns.

Conclusions: Of the 30 genes selected for expression analyses, all are expressed at many of the developmental times and appropriate tissues to be regulated by Six1. Many have the potential to play a role in the disruption of hearing and kidney function seen in BOS/BOR patients.

Keywords: BOR syndrome; BOS syndrome; cranial ganglia; olfactory; otocyst; pan-placodal region; preplacodal ectoderm.


Figures

Figure 1
Figure 1
Gene Ontology analysis of the genes whose expression levels in animal cap explants were significantly altered >2 fold by Six1 in a microarray analysis. A. The proportions of genes up-regulated by Six1 in each of several GO functional classes. B. The proportions of genes down-regulated by Six1 in each of several GO functional classes.
Figure 1
Figure 1
Gene Ontology analysis of the genes whose expression levels in animal cap explants were significantly altered >2 fold by Six1 in a microarray analysis. A. The proportions of genes up-regulated by Six1 in each of several GO functional classes. B. The proportions of genes down-regulated by Six1 in each of several GO functional classes.
Figure 2
Figure 2
Examples of changes in gene expression of putative Six1 targets after knock-down of endogenous Six1 levels by injection of antisense morpholino oligonucleotides (Six1 MOs), increased levels of wild type Six1 by mRNA injection (Six1 WT), activation of Six1 targets by mRNA injection of an activating construct (Six1-VP16), or repression of Six1 targets by mRNA injection of a repressive construct (EnR-Six1) (see Brugmann et al., 2004 for validation of these constructs). Six1 MOs: Expression of Cdca7l in the segmenting somites (arrows on control [ctrl] side) is lost on the injected (inj) side (side views, anterior to left). Expression of HoxA3 in the neural crest (nc) is greatly reduced on the injected side, whereas hindbrain (hb) expression is maintained (side views, anterior to left). Expression of Ism1 is lost in the midbrain (arrow) (frontal view, dorsal to the top). Expression of IMAGE 3399268 is expanded in the neural plate (line depicts width from midline to lateral border) on the injected side (dorsal view, anterior to the bottom). Expression patterns of Cnfn1-a in the hatching gland (arrows) and of Snail1 in the migrating neural crest are reduced and disrupted on the injected sides (frontal views, dorsal to the top). Six1 WT: Expression of BG022063 is broader in the neural plate (line) and neural crest (bracket) on the injected side (frontal view, dorsal to the top). Expression of Nfya is broader in the neural tube (line) on the injected side (dorsal view, anterior to the top). Expression of IMAGE 3399268 in the segmented somites (arrows, ctrl side) is lost on the injected side (side views, anterior to left). Expression of IMAGE 4057931 in the neural crest (bracket), otocyst (oto) and trigeminal ganglion (arrow) is greatly diminished on the injected side (side views, anterior to left). Six1-VP16: Expression of Frizzled10b, Pbx1 and Zic2 in the neural plate is expanded (line) on the injected side (frontal views, dorsal to the top). EnR-Six1: Expression of Frizzled10b in the neural plate is reduced (line) on the injected side (frontal view, dorsal to the top). Expression of IMAGE 4057931 is reduced in the PPR (arrows on the control side; frontal view, dorsal to the top). Expression of Zic2 and Otx1 in the neural tube is reduced (line) on the injected sides (arrows; frontal views, dorsal to the top). In MO-injected embryos, injected sides were confirmed by the use of lysamine-labeled MOs (not shown). In mRNA-injected embryos, injected sides were confirmed by the presence of nuclear β-galactosidase lineage labeling (pink dots visible in most images).
Figure 3
Figure 3
Semi-quantitative RT-PCR assays illustrate the temporal expression patterns of previously uncharacterized up-regulated (A) and down-regulated (B) genes in normal, unmanipulated Xenopus embryos. RT-, minus RT step; numbers across the bottom indicate the developmental stages. H4 is an internal control. Im, IMAGE
Figure 3
Figure 3
Semi-quantitative RT-PCR assays illustrate the temporal expression patterns of previously uncharacterized up-regulated (A) and down-regulated (B) genes in normal, unmanipulated Xenopus embryos. RT-, minus RT step; numbers across the bottom indicate the developmental stages. H4 is an internal control. Im, IMAGE
Figure 4
Figure 4
Whole mount in situ hybridization assays at early developmental stages illustrating the common expression patterns of 14 up-regulated genes. A: Nrp1, Arrb2, BG022063, LOC100037047, BQ399495, Hrpt1, Rbm42-6. B: LOC414689, Uncx4.1, Xxylt1, Nfya, Tbc1d31, Cdca7l, Papd4-a. For all genes, expression is enhanced in the animal cells (an) of cleavage and blastula embryos (side views). At gastrula stages, expression is throughout the ectoderm, occasionally enhanced in the animal cells (e.g., Arrb2) or the dorsal cells (e.g., Nrp1) (side views). At early neural plate stages, all genes are expressed in the epidermis (epi), often more intensely on the dorsal (d) side, including neural plate (np) and border zone (bz) (all except Nrp1 are side views with anterior [a] to the left; Nrp1 is an anterior view with dorsal to the top). At late neural plate and neural tube stages, expression is strongest in the neural crest (nc), preplacodal region (ppr), neural tube (nt) and occasionally cement gland (cem) (all are anterior views). For Nrp1, embryos were sectioned in the horizontal plane to demonstrate that the ppr stripe in the whole embryo is due to expression in the deep (d) layer of the ectoderm, not the superficial (s) layer of the ectoderm or the pharyngeal endoderm (phe); ph, lumen of pharynx.
Figure 4
Figure 4
Whole mount in situ hybridization assays at early developmental stages illustrating the common expression patterns of 14 up-regulated genes. A: Nrp1, Arrb2, BG022063, LOC100037047, BQ399495, Hrpt1, Rbm42-6. B: LOC414689, Uncx4.1, Xxylt1, Nfya, Tbc1d31, Cdca7l, Papd4-a. For all genes, expression is enhanced in the animal cells (an) of cleavage and blastula embryos (side views). At gastrula stages, expression is throughout the ectoderm, occasionally enhanced in the animal cells (e.g., Arrb2) or the dorsal cells (e.g., Nrp1) (side views). At early neural plate stages, all genes are expressed in the epidermis (epi), often more intensely on the dorsal (d) side, including neural plate (np) and border zone (bz) (all except Nrp1 are side views with anterior [a] to the left; Nrp1 is an anterior view with dorsal to the top). At late neural plate and neural tube stages, expression is strongest in the neural crest (nc), preplacodal region (ppr), neural tube (nt) and occasionally cement gland (cem) (all are anterior views). For Nrp1, embryos were sectioned in the horizontal plane to demonstrate that the ppr stripe in the whole embryo is due to expression in the deep (d) layer of the ectoderm, not the superficial (s) layer of the ectoderm or the pharyngeal endoderm (phe); ph, lumen of pharynx.
Figure 5
Figure 5
Whole mount in situ hybridization assays at tail bud to larval stages illustrating more divergent expression patterns of 14 up-regulated genes. A: Nrp1, Arrb2, BG022063, LOC100037047, BQ399495. B: Hrpt1, Rbm42-6, LOC414689, Uncx4.1, Xxylt1. C: Nfya, Tbc1d31, Cdca7l, Papd4-a. Side views at tail bud (left column) and larval (middle column) stages, with anterior to the left and dorsal to the top, and transverse sections at larval stages (right side) with dorsal to the top. Abbreviations: ba, branchial arches; cem, cement gland; ep, epibranchial placodes; epi, epidermis; fb, forebrain; h, heart; hb, hindbrain; IX/Xg, glossopharyngeal/vagal ganglion; l, lens; mb, midbrain; ne, nephric mesoderm; olf, olfactory placode; oto, otocyst; p, pineal; r, retina; spcd, spinal cord; so, somites; Vg, trigeminal ganglion; VIIg, facial ganglion.
Figure 5
Figure 5
Whole mount in situ hybridization assays at tail bud to larval stages illustrating more divergent expression patterns of 14 up-regulated genes. A: Nrp1, Arrb2, BG022063, LOC100037047, BQ399495. B: Hrpt1, Rbm42-6, LOC414689, Uncx4.1, Xxylt1. C: Nfya, Tbc1d31, Cdca7l, Papd4-a. Side views at tail bud (left column) and larval (middle column) stages, with anterior to the left and dorsal to the top, and transverse sections at larval stages (right side) with dorsal to the top. Abbreviations: ba, branchial arches; cem, cement gland; ep, epibranchial placodes; epi, epidermis; fb, forebrain; h, heart; hb, hindbrain; IX/Xg, glossopharyngeal/vagal ganglion; l, lens; mb, midbrain; ne, nephric mesoderm; olf, olfactory placode; oto, otocyst; p, pineal; r, retina; spcd, spinal cord; so, somites; Vg, trigeminal ganglion; VIIg, facial ganglion.
Figure 6
Figure 6
Whole mount in situ hybridization assays illustrating the expression patterns of previously characterized genes up-regulated (Trhd-a, Pbx1b, Ism1, Arnt, HoxA3) or down-regulated (Foxi1-Xema) genes at stages previously unpublished. Abbreviations are as in Figures 4 and 5.
Figure 7
Figure 7
Four examples of cleavage stage gene expression in embryos that were bisected prior to the in situ hybridization protocol to facilitate probe access to all of the cells. In each case the probe was detected in the animal pole blastomeres (a) and in marginal zone animal blastomeres (arrows), but not in vegetal blastomeres (v).
Figure 8
Figure 8
Examples of embryos bisected after the in situ hybridization protocol to reveal expression patterns in internal cells. BQ399495: At blastula (left image, sagittal section), expression is primarily in the animal cap (AC) cells, and barely detected in the equatorial (eq) zone. At neural plate stages (right image, transverse section), expression is observed in the neural plate (np), somites (so) and epidermis (epi). Hprt1: At blastula (left image, sagittal section), expression is in both animal cap and equatorial cells. At gastrula stages (right image, sagittal section, anterior to the left), expression is observed in the surface ectoderm (ecto) and involuting mesoderm (meso); bl, dorsal blastoporal lip. Xxylt1: At blastula (left image, sagittal section), expression is in both animal cap and equatorial cells. At neural plate stages (right image, sagittal section, anterior to the left), expression is observed in the neural plate and underlying dorsal mesoderm (meso). IMAGE 3399268: At blastula (left image, sagittal section), expression is in both animal cap and equatorial cells. At gastrula stages (right image, sagittal section, anterior to the left), expression is observed in the animal ectoderm, but barely detected in the involuting mesoderm. Cnfn1-a: At gastrula stages (sagittal section, anterior to the left), expression is observed in the animal ectoderm, but not in the involuting mesoderm. IMAGE 7010138: At blastula (left image, sagittal section), expression is primarily in the animal cap cells, and barely detected in the equatorial zone. At gastrula stages (middle image, sagittal section, anterior to the left), there is strong expression in both the ectoderm and involuting mesoderm. At neural plate stages (right image, sagittal section, anterior to the left), weak expression is observed in both the neural plate and underlying dorsal mesoderm.
Figure 9
Figure 9
Examples of Xenopus embryos hybridized with sense RNA probes to evaluate the extent of non-specific staining at the early stages when expression patterns are diffuse (cf. Figures 4, 5, 6, 10).
Figure 10
Figure 10
Whole mount in situ hybridization assays at early stages illustrating common expression patterns of 10 down-regulated genes. A: IMAGE 4174145, IMAGE 3399268, IMAGE 4057931, IMAGE 3400511, Socs3. B: MGC 114680, IMAGE 7010138, Cnfn1-a, Ralgds, Dnaja4.2. For all genes, expression is enhanced in the animal cells (an) of cleavage and blastula embryos, and is throughout the ectoderm at gastrula stages (side views). At early neural plate stages, all genes are expressed in the epidermis (epi), often more intensely on the dorsal (d) side, including neural plate (np) and border zone (bz) (all except IMAGE 3400511 are side views with anterior [a] to the left; IMAGE 3400511 is an anterior view). At later neural plate and neural tube stages, expression is strongest in the neural crest (nc), preplacodal region (ppr), neural tube (nt) and epidermis (epi) (anterior views). Cnfn1-a is uniquely expressed in the hatching gland (hg).
Figure 10
Figure 10
Whole mount in situ hybridization assays at early stages illustrating common expression patterns of 10 down-regulated genes. A: IMAGE 4174145, IMAGE 3399268, IMAGE 4057931, IMAGE 3400511, Socs3. B: MGC 114680, IMAGE 7010138, Cnfn1-a, Ralgds, Dnaja4.2. For all genes, expression is enhanced in the animal cells (an) of cleavage and blastula embryos, and is throughout the ectoderm at gastrula stages (side views). At early neural plate stages, all genes are expressed in the epidermis (epi), often more intensely on the dorsal (d) side, including neural plate (np) and border zone (bz) (all except IMAGE 3400511 are side views with anterior [a] to the left; IMAGE 3400511 is an anterior view). At later neural plate and neural tube stages, expression is strongest in the neural crest (nc), preplacodal region (ppr), neural tube (nt) and epidermis (epi) (anterior views). Cnfn1-a is uniquely expressed in the hatching gland (hg).
Figure 11
Figure 11
Whole mount in situ hybridization assays at tail bud to larval stages illustrating more divergent expression patterns of 10 down-regulated genes. A: IMAGE 4174145, IMAGE 3399268, IMAGE 4057931, IMAGE 3400511, Socs3. B: MGC 114680, IMAGE 7010138, Cnfn1-a, Ralgds, Dnaja4.2. Side views at tail bud (left column) and larval (middle column) stages, with anterior to the left and dorsal to the top, and transverse sections at larval stages (right side) with dorsal to the top. Abbreviations are as in Figure 10. For Cnfn1-a: hg, hatching gland; clo, cloaca.
Figure 11
Figure 11
Whole mount in situ hybridization assays at tail bud to larval stages illustrating more divergent expression patterns of 10 down-regulated genes. A: IMAGE 4174145, IMAGE 3399268, IMAGE 4057931, IMAGE 3400511, Socs3. B: MGC 114680, IMAGE 7010138, Cnfn1-a, Ralgds, Dnaja4.2. Side views at tail bud (left column) and larval (middle column) stages, with anterior to the left and dorsal to the top, and transverse sections at larval stages (right side) with dorsal to the top. Abbreviations are as in Figure 10. For Cnfn1-a: hg, hatching gland; clo, cloaca.
Figure 12
Figure 12
Whole mount in situ hybridization for Pbx1 from primitive streak to 14-somite stages. Rostral is to the top, caudal to the bottom of the images. Lines in C and E indicate the levels of sections shown in a–h; i–k are higher magnifications of the placode areal shown in c, f and g respectively. bz, border zone; eb, epibranchial placode; l, lens placode; nc, neural crest; np, neural plate; oto, otic placode; so, somite.
Figure 13
Figure 13
Whole mount in situ hybridization for Arnt from primitive streak to 14-somite stages. Rostral is to the top, caudal to the bottom of the images. Lines in C and E indicate the levels of sections shown in a–h; i–k are higher magnifications of the placode area shown in c, f and g respectively. Abbreviations are as in Figure 12.
Figure 14
Figure 14
Whole mount in situ hybridization for XXYLT1 from primitive streak to 14-somite stages. Rostral is to the top, caudal to the bottom of the images. Lines in B and F indicate the levels of sections shown in a–h; i–k are higher magnifications of the placode areal shown in c, f and g respectively. Abbreviations are as in Figure 12.
Figure 15
Figure 15
Whole mount in situ hybridization for Wrd67 from primitive streak to 14-somite stages. Rostral is to the top, caudal to the bottom of the images. Lines in C and F indicate the levels of sections shown in a–h; i–k are higher magnifications of the placode areal shown in c, f and g respectively. Abbreviations are as in Figure12.
Figure 16
Figure 16
Whole mount in situ hybridization for DNAJA1 from primitive streak to 14-somite stages. Rostral is to the top, caudal to the bottom of the images. Lines in C and E indicate the levels of sections shown in a–h; i–k are higher magnifications of the placode areal shown in c, f and g respectively. Abbreviations are as in Figure 12.
Figure 17
Figure 17
Examples of chick embryos hybridized with sense RNA probes to evaluate the extent of non-specific staining (cf. Figures 12 – 16). A, D, F, I: primitive streak stages. G, head fold stage. B, E, J: 3–4 somite stage. C, 14-somite stage.

Similar articles

Cited by

References

    1. Abdelhak S, Kalatzis V, Heilig R, Compain S, Samson D, Vincent C, Weil D, Cruaud C, Sahly I, Leibovici M, Bitner-Glindzicz M, Francis M, Lacombe D, Vigneron J, Charachon R, Boven K, Bedbeder P, Van Regemorter N, Weissenbach J, Petit C. A human homologue of the Drosophila eyes absent gene underlies Branchio–Oto–Renal (BOR) syndrome and identifies a novel gene family. Nature Genet. 1997;15:157–164. - PubMed
    1. Ahrens K, Schlosser G. Tissues and signals involved in the induction of placodal Six1 expression in Xenopus laevis. Dev Biol. 2005;288:40–59. - PubMed
    1. Anderson AM, Weasner BM, Weasner BP, Kumar JP. Dual transcriptional activities of SIX proteins define their roles in normal and ectopic eye development. Development. 2012;139:991–1000. - PMC - PubMed
    1. Bailey AP, Streit A. Sensory organs: making and breaking the pre-placodal region. Curr Top Dev Biol. 2006;72:167–204. - PubMed
    1. Bailey AP, Bhattacharyya S, Bronner-Fraser M, Streit A. Lens specification is the ground state of all sensory placodes, from which FGF promotes olfactory identity. Dev Cell. 2006;11:505–517. - PubMed

Publication types

LinkOut - more resources