Rapid neurogenesis through transcriptional activation in human stem cells
- PMID: 25403753
- PMCID: PMC4299601
- DOI: 10.15252/msb.20145508
Rapid neurogenesis through transcriptional activation in human stem cells
Abstract
Advances in cellular reprogramming and stem cell differentiation now enable ex vivo studies of human neuronal differentiation. However, it remains challenging to elucidate the underlying regulatory programs because differentiation protocols are laborious and often result in low neuron yields. Here, we overexpressed two Neurogenin transcription factors in human-induced pluripotent stem cells and obtained neurons with bipolar morphology in 4 days, at greater than 90% purity. The high purity enabled mRNA and microRNA expression profiling during neurogenesis, thus revealing the genetic programs involved in the rapid transition from stem cell to neuron. The resulting cells exhibited transcriptional, morphological and functional signatures of differentiated neurons, with greatest transcriptional similarity to prenatal human brain samples. Our analysis revealed a network of key transcription factors and microRNAs that promoted loss of pluripotency and rapid neurogenesis via progenitor states. Perturbations of key transcription factors affected homogeneity and phenotypic properties of the resulting neurons, suggesting that a systems-level view of the molecular biology of differentiation may guide subsequent manipulation of human stem cells to rapidly obtain diverse neuronal types.
Keywords: gene regulatory networks; microRNAs; neurogenesis; stem cell differentiation; transcriptomics.
© 2014 The Authors. Published under the terms of the CC BY 4.0 license.
Figures
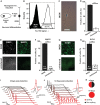
A General scheme of Neurogenin 1+2 induction to yield differentiated neurons from human iPS cells after 4 days.
B Proportion of uninduced (white) and 4 days induced (black) iNGN cells analyzed by flow cytometry for the pluripotency marker Tra-1/60, demonstrating a nearly complete differentiation of iPS cells.
C Representative transmission light microscopy image of a bipolar-shaped iNGN cell at day 4 of differentiation.
D Quantification of bipolar-cell-shaped morphology on day 4, 78 cells analyzed in total.
E Immunostaining for MAP2 and nuclear DAPI staining of neurons induced for 4 days (upper row) and uninduced iPS cells (lower row).
F Quantification of MAP2-expressing cells. n refers to the number of cells from three independent experiments as in (E).
G Immunostaining for SYN1 of neurons induced for 4 days (upper row) and uninduced iPS cells (lower row).
H Quantification of SYN1-expressing cells. n refers to the number of cells from three independent experiments performed as in (G).
I, J Characterization of action potentials across 10 cells recorded at 4 days (I) or 14 days (J) postinduction. Traces show response to a 20 pA injected current over 0.5 s. Inset shows a representative action potential waveform (in red) with corresponding dV/dt trace (in gray), highlighting threshold and width parameters. Left scale bar: 50 ms/20 mV. Inset scale bar gray: 5 ms/25 mV/ms, red: 25 mV.
K Percentage spiking and non-spiking cells at 4 days and 14 days postinduction.
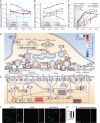
A–C Gene expression levels of (A) stem cell markers, (B) neural markers and (C) transcription factors previously used for transdifferentiation experiments, as measured by RNA-Seq. Error bars represent the 95% confidence interval of mRNA abundance.
D, E There was a rapid transcriptional induction of the synaptic machinery in iNGN cells over the time course of differentiation. Heatmaps represent the Z-score for expression levels for all isoforms over the four time points assayed. A schematic outline of presynaptic terminal components (D) shows a general trend of upregulation during iNGN development. Similarly, postsynaptic components and their contributions to neuronal function are shown in (E). Cellular processes are color-coded and indicated in the figure.
F Immunostainings for vGLUT1 and ChAT of iNGN cells at day 4.
G Quantification of vGLUT1- and ChAT-positive iNGN cells (in triplicates); error bar, SEM.
H The signals co-localize, indicating the presence of a homogeneous neuronal population with abilities to co-transmit glutamate and acetylcholine.
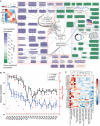
Gene Ontology (GO) annotation was used to identify gene classes containing an overrepresentation of genes that were differentially expressed between day 0 and day 4 in iNGN cells. The majority of GO terms with an overrepresentation of downregulated genes (green) are related to cell cycle and nucleic acid metabolism, while GO terms with many upregulated genes (purple) include classes related to neuron development and physiology. For example, most genes in the Gene Ontology classification of ‘regulation of neurogenesis’ (inset) including neural progenitor markers are significantly upregulated as shown in the heatmap.
RNA-Seq data of uninduced iNGN (day 0, blue) and iNGN cells (day 4, black) are compared to the Allen BrainSpan data, by computing the Pearson's correlation coefficients between the iNGN cells and all brain samples at each developmental time point. This shows that iNGN gene expression is more consistent with prenatal brain gene expression, and the correlation is significantly higher for day 4 iNGN cells, compared to day 0 cells (one-sided two-sample t-test, with P-values shown in red dots).
Pearson's correlation coefficients were subsequently computed between day 4 iNGN cells and profiles for brain regions at each time point. The 500 most highly upregulated genes in day 4 iNGN cells were used as a neuronal signature. At each time point, Z-scores were computed for each brain region to assess their relative similarity to the iNGN signature, in comparison with the remaining brain regions. This demonstrated less similarity of iNGN cells to cortical brain structures and indicated higher similarities to the mediodorsal nucleus of thalamus, amygdaloid complex, hippocampus and cerebellar cortex. Pcw, postconception weeks.
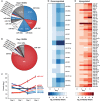
A, B Relative abundance of microRNAs in (A) uninduced and (B) 4-days differentiated iNGN cells. The miRNAs associated with stem cell fate are indicated in blue, while the neuronal miRNAs are in red.
C Dynamic miRNA changes of representative miRNAs during the differentiation of iNGN cells. Error bars, SEM. miR-124X refers to estimated counts from qRT–PCR.
D, E Heatmaps of all significantly (D) down- and (E) upregulated miRNAs within the first 4 days of iNGN differentiation, rank-ordered by expression levels (ANOVA q-values < 0.05).
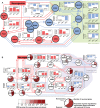
Within this network, there is a subnetwork of transcription factors that represses stem cell factors following Neurogenin activation. The downstream genes regulated by each transcription factor were used to determine whether each transcription factor was activated (positive activation Z-score; red) or inhibited (negative activation Z-score; blue), based on differential gene expression changes seen each day (i.e., day 0 versus day 1, day 1 versus day 3, and day 3 versus day 4).
Neuronal transcription factors in our network were identified by looking for a significant overrepresentation (hypergeometric test, q < 0.05) of neuronal genes among their known target genes (using a list of 1,295 neuronal genes based on Gene Ontology). The fraction of neuronal gene targets for each transcription factor is shown in the pie charts, with the significance of overrepresentation of neuronal genes shown with color intensity. A minimal subnetwork linking all neuronal transcription factors back to the Neurogenins was identified, showing that the Neurogenins activate proneural transcription factor cascades and suppress transcription factors inhibiting neuronal genes.
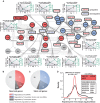
A Validated transcription factor targets for differentially expressed miRNAs were identified from miRTarBase. The miRNA interactions (black) have been superimposed on the previously generated regulatory network (light gray). Most interactions involved upregulated miRNAs that suppress stem cell factors in our network. Inset plots show cases with significant anticorrelation between miRNAs (green) and their transcription factor targets (black).
B, C The miRNAs and transcription factors regulate many additional downstream (B) neuronal and (C) stem cell genes during iNGN differentiation. Neuronal and stem cell genes were determined based on GO terms listed in Supplementary Table S7.
D The fold changes of downstream-regulated genes by neuronal miRNAs (red) and selected neuronal transcription factors in our network (black) were compared and indicated that regulation by transcription factors exhibits a higher impact, that is, broader range of fold change, than seen for miRNA targets (Levene's test).
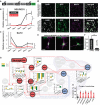
A The NEUROD1-shRNA knockdown construct was stably integrated in iNGN cells via lentiviral gene transfer. The shRNA was under a U6 promoter, the puromycin selection marker used an SV40 promoter, and GFP was driven from a CMV promoter. Control iNGN cells were tagged with a scrambled non-functional hairpin construct.
B, C Quantitative RT–PCR (qRT–PCR) was conducted for (B) NEUROD1 and (C) its target SLIT2 of knockdown (sh-NEUROD1, red) and control (sh-CTRL, black) samples over the time course of differentiation in biological triplicates (normalized to ACTB).
D Immunostainings for DAPI, GFP, MAP2, and merged channels for day 4 puromycin-selected iNGN cells are shown for sh-NEUROD1 (top) and sh-CTRL (bottom).
E, F Significant increases of non-bipolar-cell-shaped neurons were seen in sh-NEUROD1-treated iNGN cells. Three examples of altered iNGN cell morphology upon NEUROD1 knockdown (E); GFP and MAP2-staining overlay is shown. Fraction of non-bipolar iNGN cells after NEUROD1 knockdown (F); n refers to the number of analyzed cells of > 3 biological replicates.
G Transient siRNA knockdowns of individual (NEUROD1, NEUROD2, POU3F2, and ZEB1) and combinations (NEUROD1/NEUROD2 and NEUROD1/PAX6) of contributing regulators result in gene expression changes of downstream targets as suggested by IPA. These were measured by qRT–PCR (column bar inlays) on day 1 (yellow) and day 3 (green) in biological triplicates and normalized to ACTB. Control iNGN cells were transfected with scrambled siRNAs.
H All siRNA knockdowns significantly increased the fraction of non-bipolar neurons, demonstrating that the transcription factors contribute to iNGN differentiation; numbers refer to the number of analyzed cells.
References
-
- Akerblom M, Jakobsson J. MicroRNAs as neuronal fate determinants. Neuroscientist. 2013;20:235–242. - PubMed
-
- Ashburner M, Ball CA, Blake JA, Botstein D, Butler H, Cherry JM, Davis AP, Dolinski K, Dwight SS, Eppig JT, Harris MA, Hill DP, Issel-Tarver L, Kasarskis A, Lewis S, Matese JC, Richardson JE, Ringwald M, Rubin GM, Sherlock G. Gene ontology: tool for the unification of biology. The Gene Ontology Consortium. Nat Genet. 2000;25:25–29. - PMC - PubMed
-
- Barde I, Salmon P, Trono D. Production and titration of lentiviral vectors. Current Protocols in Neuroscience. 2010;53:4.21.1–4.21.23. - PubMed
Publication types
MeSH terms
Substances
Grants and funding
LinkOut - more resources
Full Text Sources
Other Literature Sources
Molecular Biology Databases
Research Materials

