. 2014;43 Suppl 1(Suppl 1):91-103.
doi: 10.1007/s13280-014-0564-1.

Half a century of changing mercury levels in Swedish freshwater fish

Affiliations

Half a century of changing mercury levels in Swedish freshwater fish

Staffan Akerblom et al. Ambio. 2014.

Abstract

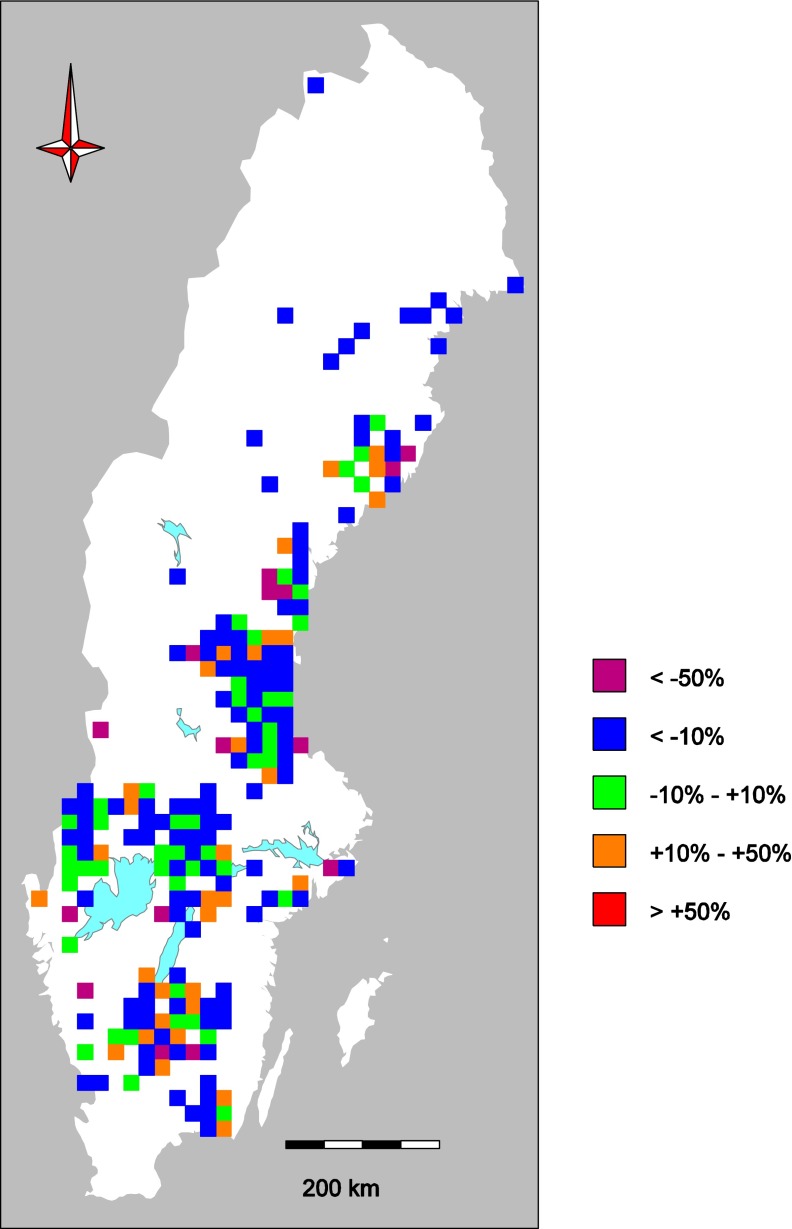
The variability of mercury (Hg) levels in Swedish freshwater fish during almost 50 years was assessed based on a compilation of 44 927 observations from 2881 waters. To obtain comparable values, individual Hg concentrations of fish from any species and of any size were normalized to correspond to a standard 1-kg pike [median: 0.69 mg kg⁻¹ wet weight (ww), mean ± SD: 0.84 ± 0.67 mg kg⁻¹ ww]. The EU Environmental Quality Standard of 0.02 mg kg⁻¹ was exceeded in all waters, while the guideline set by FAO/WHO for Hg levels in fish used for human consumption (0.5-1.0 mg kg⁻¹) was exceeded in 52.5 % of Swedish waters after 2000. Different trend analysis approaches indicated an overall long-term decline of at least 20 % during 1965-2012 but trends did not follow any consistent regional pattern. During the latest decade (2003-2012), however, a spatial gradient has emerged with decreasing trends predominating in southwestern Sweden.


Figures

Fig. 1
Fig. 1
Distribution of fish total ww Hg concentrations (mg Hg kg−1 ww) in Swedish lakes over five decades. The map color represents the mean of lake means within a grid cell (European Environment Agency reference grid, 100 km). Lake means were obtained after normalizing individual Hg concentrations in fish of all species and sizes to represent Hg in a typical 1-kg pike (see “Materials and methods” section). The leftmost map is based on all data from 1965 to 2012; 42 000 individual fish from 2655 waters, including the lakes within the national monitoring and ISELAW programs (position shown in map). The four maps to the right illustrate the spatial distribution of sampling efforts (dots representing lakes sampled) and Hg concentrations during different time periods. Histograms show distributions of pike and perch Hg concentration before (upper row) and after normalization to 1-kg pike. The red reference lines denote the EU and FAO/WHO health advisory guideline for Hg in fish as food
Fig. 2
Fig. 2
Reported observations from national monitoring, ISELAW, and regional monitoring/survey or other studies
Fig. 3
Fig. 3
Total Hg concentrations in Swedish fish 1965–2012. a Normalized (1-kg pike) Hg concentrations of 10 176 catches; each point represents the mean from a single date and site. A linear regression model (black dashed line) and a GAM (red line ± SE) were applied to all data to visualize temporal patterns. The parallel dashed lines are separate GAMs fitted either to limed lakes (upper green dashed line) or to never-limed lakes (lower blue dashed line). The black step lines indicate the geometric mean Hg concentrations between 1976–1990 (0.74 mg kg−1 ww) and 1996–2010 (0.52 mg kg−1 ww). b Temporal pattern of untransformed Hg concentrations in medium-sized perch (total length 140–220 mm) from 11 national monitoring lakes during 1998–2012 (years 1998 and 1999 only represented by one and two lakes, respectively). Box-plots depict median, 25/75 and 2.5/97.5 percentiles, based on the distribution of residual Hg concentrations, i.e., deviation of annual log Hg from the within-lake mean for the period
Fig. 4
Fig. 4
Change in normalized (1-kg pike) total ww Hg concentrations based on 514 resampled lakes visited both 1965–1990 and 1991–2012. Colors show the mean change within 20 × 20 km areas containing at least one resampled site. The average change was −20 %
Fig. 5
Fig. 5
Recent trends of total ww Hg concentrations in medium-sized perch (total length 140–220 mm) from 27 national monitoring lakes during the period 2003 (red dots, cf. Fig. 3b) or 2005/2006/2007 (black dots) to 2012. The lakes are ordered by latitude. Trends were estimated by linear regression on log-transformed Hg concentration normalized site specifically for fish age and body length. The bar color represents the probability of individual trends being equal to zero (t test). Blue bars highly significant, red bars not significant. Note the variable timing with respect to overall fluctuations such as the peak preceding 2005 (Fig. 3b)

References

    1. Ackefors H. Mercury pollution in Sweden with special reference to conditions in the water habitat. Proceedings of the Royal Society of London Series B—Biological Sciences. 1971;177:365–387. doi: 10.1098/rspb.1971.0036. - DOI - PubMed
    1. Åkerblom S, Nilsson MB, Yu J, Ranneby B, Johansson K. Temporal change estimation of mercury concentrations in northern pike (Esox lucius L.) in Swedish lakes. Chemosphere. 2012;86:439–445. doi: 10.1016/j.chemosphere.2011.09.037. - DOI - PubMed
    1. AMAP/UNEP. 2013. Technical Background Report for the Global Mercury Assessment 2013. Arctic Monitoring and Assessment Programme, Oslo, Norway, vi + 263 pp. Geneva: UNEP Chemicals Branch. Retrieved 7 July, 2014, from http://www.amap.no/documents/doc/technical-background-report-for-the-glo....
    1. Basu N, Scheuhammer A, Grochowina N, Klenavic K, Evans D, O’Brien M, Chan HM. Effects of mercury on neurochemical receptors in wild river otters (Lontra canadensis) Environmental Science and Technology. 2005;39:3585–3591. doi: 10.1021/es0483746. - DOI - PubMed
    1. Björklund I, Borg H, Johansson K. Mercury in Swedish lakes: Its regional distribution and causes. AMBIO. 1984;13:118–121.

Publication types

LinkOut - more resources