. 2014 Dec 9;111(49):E5243-51.
doi: 10.1073/pnas.1419997111. Epub 2014 Nov 17.

A model for the generation and interconversion of ER morphologies

Affiliations

A model for the generation and interconversion of ER morphologies

Tom Shemesh et al. Proc Natl Acad Sci U S A. .

Abstract

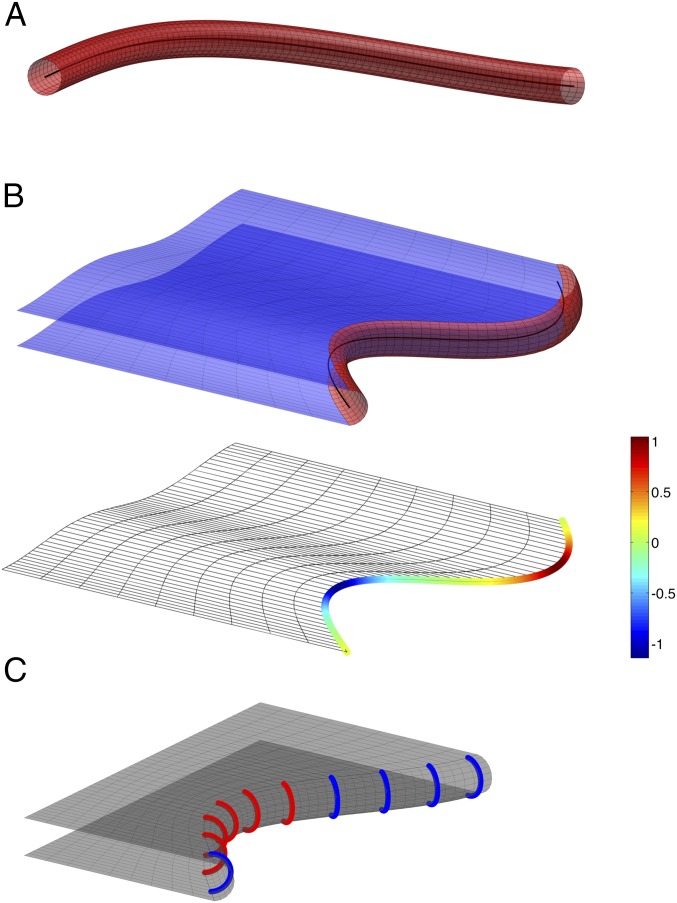
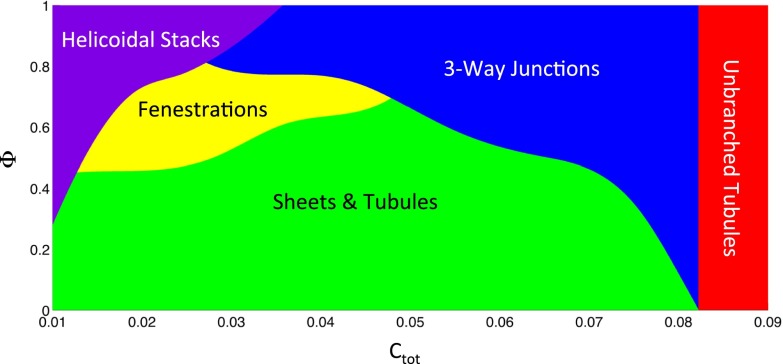
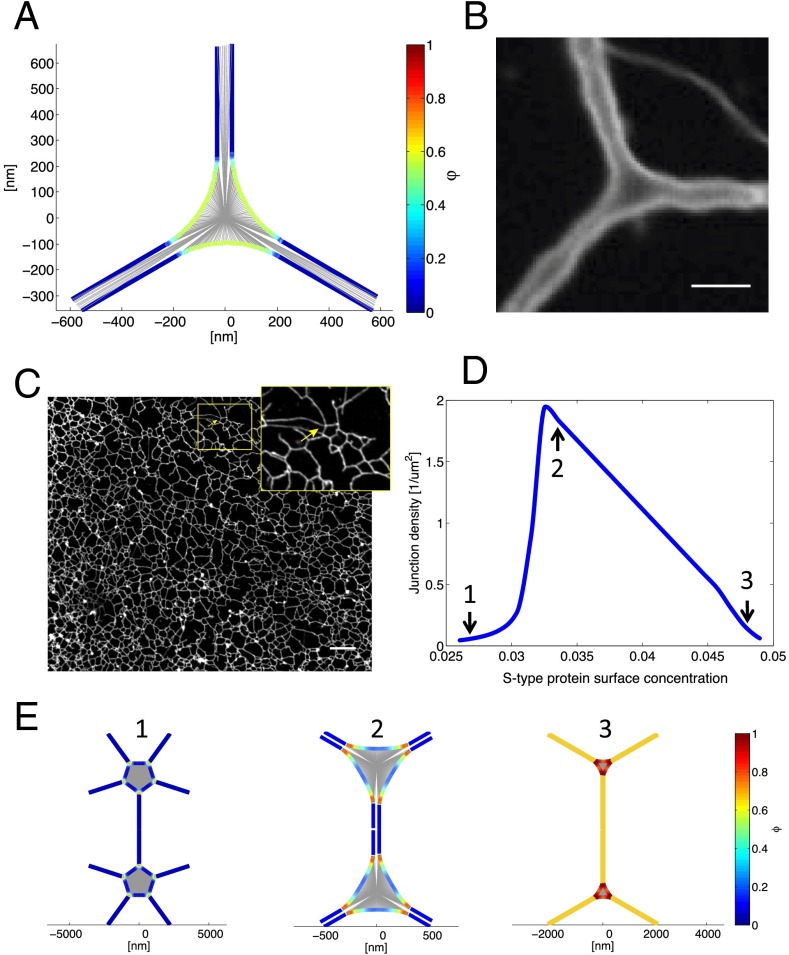
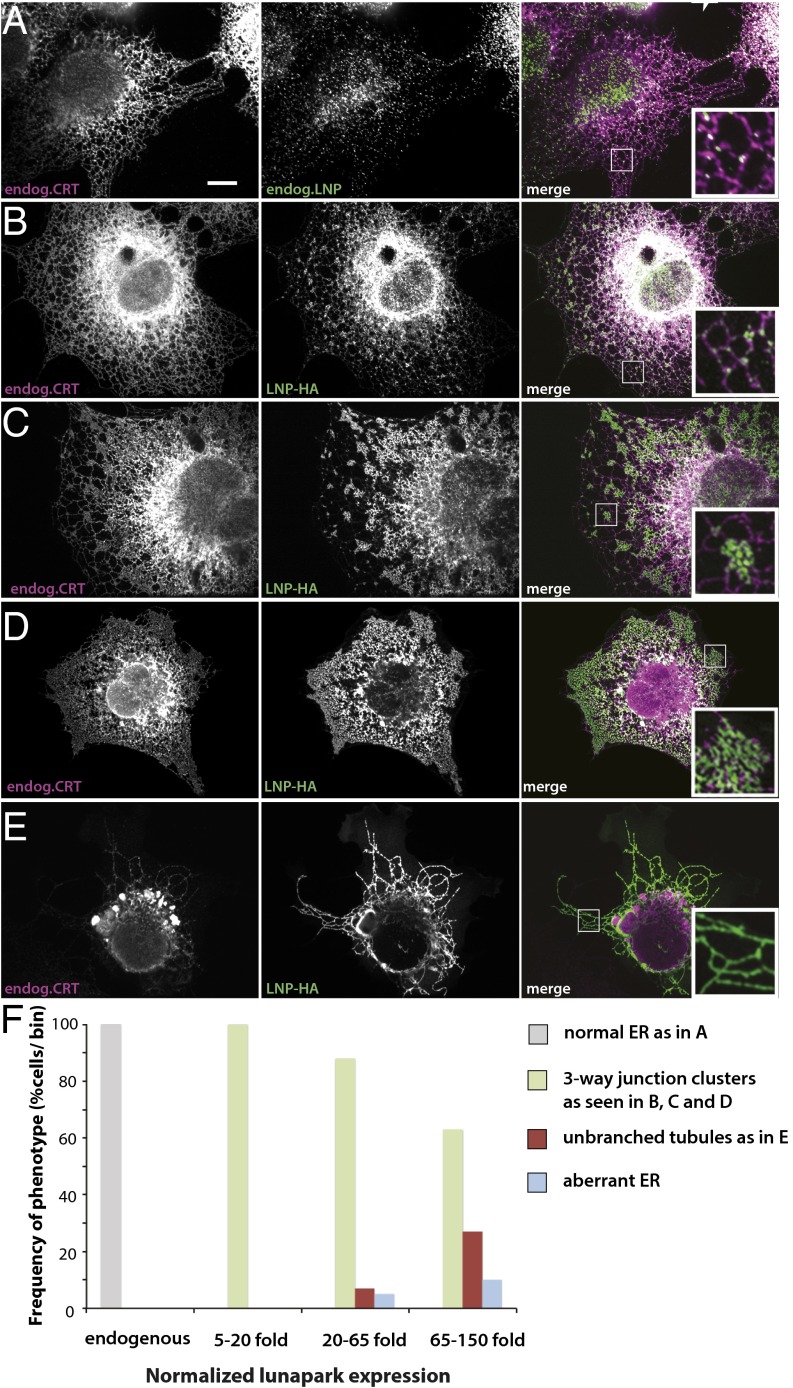
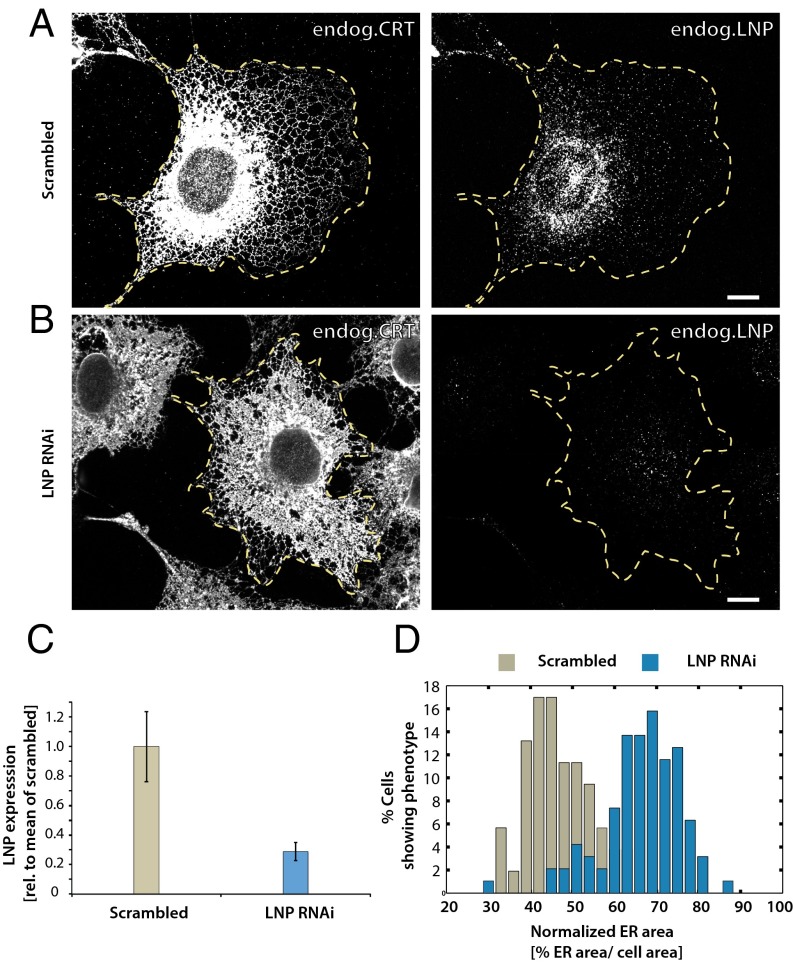
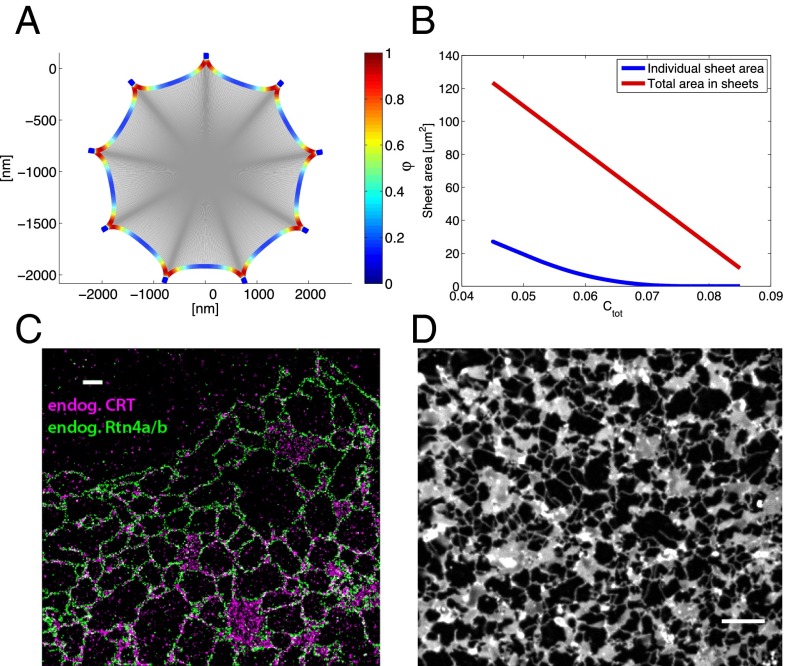
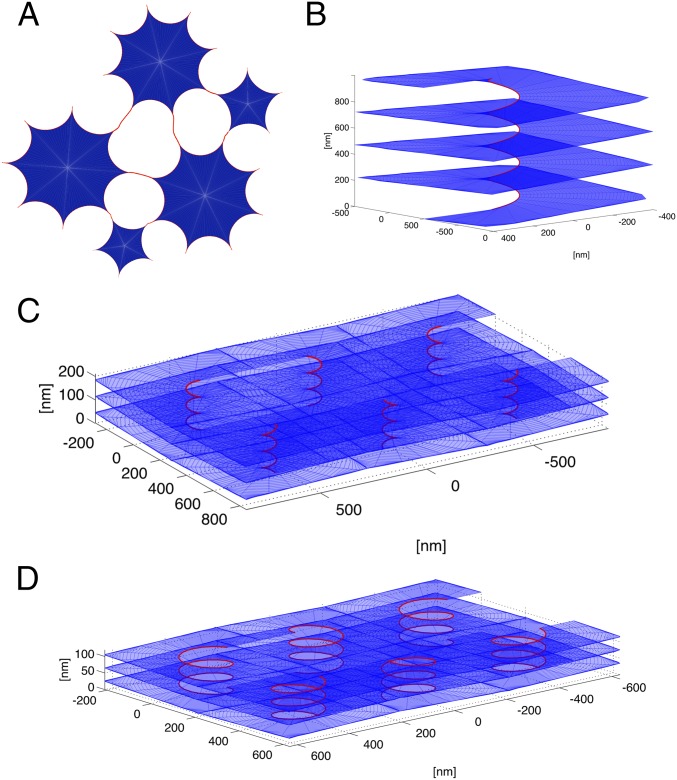
The peripheral endoplasmic reticulum (ER) forms different morphologies composed of tubules and sheets. Proteins such as the reticulons shape the ER by stabilizing the high membrane curvature in cross-sections of tubules and sheet edges. Here, we show that membrane curvature along the edge lines is also critical for ER shaping. We describe a theoretical model that explains virtually all observed ER morphologies. The model is based on two types of curvature-stabilizing proteins that generate either straight or negatively curved edge lines (R- and S-type proteins). Dependent on the concentrations of R- and S-type proteins, membrane morphologies can be generated that consist of tubules, sheets, sheet fenestrations, and sheet stacks with helicoidal connections. We propose that reticulons 4a/b are representatives of R-type proteins that favor tubules and outer edges of sheets. Lunapark is an example of S-type proteins that promote junctions between tubules and sheets. In a tubular ER network, lunapark stabilizes three-way junctions, i.e., small triangular sheets with concave edges. The model agrees with experimental observations and explains how curvature-stabilizing proteins determine ER morphology.

Keywords: endoplasmic reticulum; lunapark; model; morphology; reticulon.


Conflict of interest statement

The authors declare no conflict of interest.

Figures

Fig. 1.
Fig. 1.
Representation of ER tubules and sheets in a theoretical model. (A) A tubule is considered to be a cylinder, the axis of which is curved in space (black line). (B) A sheet consists of two parallel membrane surfaces (Upper, in blue). The sheet edge is considered to be a half-cylinder (in red), the axis of which curves in the plane of the sheet (black line). The sheet is represented by a single surface between the two membrane surfaces (Lower), which is bounded by an edge line that can adopt positive or negative curvature. The curvature is color-coded (scale on the right, arbitrary units [1/length]). See also Fig. S1. (C) A scheme depicting edge-promoting proteins as arcs along a sheet edge. Edge promoters favoring a negatively curved edge line (type S) are colored in red, and promoters of straight edge lines (type R) are colored blue.
Fig. 2.
Fig. 2.
Morphology diagram. The energetically favored ER morphology was calculated for different values Ctot of the total concentration of curvature-stabilizing proteins and different fractions Φ of the S-type proteins that favor a negatively curved edge line. A three-way junction is defined as a triangular sheet with an area below 0.1 μm2. A fenestration is defined as a sheet connected by tubules that are shorter than the distance between adjacent tubules emerging from a sheet.
Fig. 3.
Fig. 3.
Three-way tubular junctions. (A) Top view of a theoretical three-way junction between tubules. The central area is a flat sheet with concave edges. The concentration of the S-type protein, Φ, is color-coded (scale on the right); it is higher in the three-way junction than in the emerging tubules. (B) Three-way junction between dilated ER tubules formed with Xenopus egg membranes. An ER network was formed in the absence of cytosol with a light membrane fraction isolated from Xenopus extracts. The membranes were prelabeled with the hydrophobic dye DiOC18 and visualized by confocal fluorescence microscopy after incubation for 2 h, at which point the diameter of the membrane tubules is greatly increased. (Scale bar: 3 µm.) See also Movie S1. (C) Tubular ER network in interphase Xenopus egg extracts. A crude meiotic (CSF) extract was driven into interphase by addition of Ca2+ ions for 30 min. The image shows that three-way junctions are the predominant connectors. (Scale bar: 10 µm.) (Inset) Magnification of a rare example of a four-way junction. (D) Theoretical prediction of the density of tubular junctions (number of sheets per membrane surface) as a function of the concentration of S-type proteins. The concentration of the R-type proteins was kept constant at 0.04 surface coverage. The shape of the junctions at the indicated points (arrows) is shown in E. (E) For three points in D, the shape of the junctions and the concentration of the S-type protein along the edge line are shown. The concentration is color-coded (scale on the right).
Fig. 4.
Fig. 4.
Transient expression of lunapark in COS cells. (A) The localization of endogenous lunapark (Lnp) and calreticulin (CRT) was determined by immunostaining with specific antibodies. The samples were analyzed by confocal microscopy. (Right) Merged image. (B) An HA-tagged version of lunapark (Lnp-HA) was transiently expressed in COS cells, and its localization compared with that of endogenous CRT. The samples were analyzed by fluorescence microscopy using HA and CRT antibodies. Shown is a cell that expresses Lnp-HA at a low level. (C–E) As in B, but with progressively higher expression levels of Lnp-HA. (Scale bar: 10 µm.) See also Fig. S2. (F) COS cells were transiently transfected with Lnp-HA as in B–E, but the Lnp protein was stained with a specific antibody as in A. The cell area was segmented manually, and the mean expression level of lunapark was quantified for every cell using ImageJ. At different expression levels of lunapark, the number of cells that showed normal ER as in A, three-way junction clusters as in B–D, unbranched tubules as in E, or aberrant ER was determined. The cells were binned into groups of similar expression levels (normalized relative to the mean Lnp level in untransfected cells), and for each bin the number of cells with a given ER morphology was plotted as percentage of the total number of cells (n = 90 cells).
Fig. 5.
Fig. 5.
ER morphology changes upon depletion of lunapark in COS cells. (A) COS cells were transfected with control scrambled RNAi oligonucleotides for 72 h and analyzed for endogenous CRT and endogenous lunapark (LNP) by immunofluorescence microscopy. The cells were segmented manually (yellow dotted line) and lunapark expression level was determined after correction for mean background (Fig. 5C). (B) As in A, except that lunapark was depleted with RNAi oligonucleotides for 72 h. (C) To quantify the depletion of lunapark after treatment with RNAi, the cells were segmented manually and the mean lunapark fluorescence level was determined for every cell (n = 95 cells). The mean fluorescence level is displayed normalized to the mean fluorescence in control cells treated with scrambled oligonucleotide (n = 53 cells; ±SD). (D) To quantify the increase of the peripheral ER area after depletion of lunapark, the cellular area and the peripheral ER area were segmented. The cells were segmented manually and the CRT signal marking the ER area was segmented using the trainable WEKA segmentation plug-in in ImageJ. The total area covered by the peripheral ER was determined as the fraction of the total cell area. The cells were binned according to the fractional cell area covered by the peripheral ER, and the frequency of the phenotype in the cells was plotted as a histogram (n = 95 cells treated with Lnp RNAi, and n = 53 cells treated with scrambled control siRNA). (Scale bars: 10 µm.)
Fig. 6.
Fig. 6.
Model prediction and experimental verification of large ER sheets with multiple tubule connections. (A) Predicted large sheet with multiple tubule connections. The calculations were performed for Ctot = 0.04 surface coverage and Φ = 0.2. The concentration of the S-type protein along the edge line,φ, is color-coded (scale on the right). (B) Calculated total and individual sheet areas as a function of Ctot (red and blue lines, respectively). The individual sheet areas were calculated for Φ = 0.2. (C) Endogenous calreticulin (endog. CRT) and reticulon 4a/b (endog. Rtn4a/b) were visualized in COS cells by STORM using specific antibodies followed by secondary antibodies labeled with fluorescent dyes. (D) ER network in a mitotic Xenopus egg extract. Cyclin BΔ90 was added to a crude interphase extract and the ER network was stained with the hydrophobic dye DiIC18; it was visualized by spinning-disk confocal microscopy. (Scale bar: 10 µm.)
Fig. 7.
Fig. 7.
Model prediction of fenestrations and helicoidal membrane stacks. (A) Scheme showing how large sheets connected by short tubules generate fenestrations between sheets. Sheets of different sizes and tubule connections are shown. (B) Shown is a helicoid connecting stacked sheets. The calculations were performed for Ctot = 0.02 and Φ = 0.9. (C) A rectangular array of helicoidal connections. The calculations were performed for Ctot = 0.015 and Φ = 0.8. The pitch of the helical edge is 80 nm, the internal radius is 30 nm, and the distance between neighboring helicoids is 500 nm. (D) A rectangular array of helicoidal connections. The calculations were performed for Ctot = 0.03 and Φ = 0.8. The pitch distance of the helical edge is 40 nm, the internal radius is 80 nm, and the distance between neighboring helicoids is 400 nm.

References

    1. Shibata Y, Hu J, Kozlov MM, Rapoport TA. Mechanisms shaping the membranes of cellular organelles. Annu Rev Cell Dev Biol. 2009;25:329–354. - PubMed
    1. Friedman JR, Voeltz GK. The ER in 3D: A multifunctional dynamic membrane network. Trends Cell Biol. 2011;21(12):709–717. - PMC - PubMed
    1. Goyal U, Blackstone C. Untangling the web: Mechanisms underlying ER network formation. Biochim Biophys Acta. 2013;1833(11):2492–2498. - PMC - PubMed
    1. Hu J, et al. Membrane proteins of the endoplasmic reticulum induce high-curvature tubules. Science. 2008;319(5867):1247–1250. - PubMed
    1. Shibata Y, et al. Mechanisms determining the morphology of the peripheral ER. Cell. 2010;143(5):774–788. - PMC - PubMed

Publication types

LinkOut - more resources