

HIV Type 1 Disease Progression to AIDS and Death in a Rural Ugandan Cohort Is Primarily Dependent on Viral Load Despite Variable Subtype and T-Cell Immune Activation Levels
- PMID: 25404522
- PMCID: PMC4425824
- DOI: 10.1093/infdis/jiu646
HIV Type 1 Disease Progression to AIDS and Death in a Rural Ugandan Cohort Is Primarily Dependent on Viral Load Despite Variable Subtype and T-Cell Immune Activation Levels
Abstract
Background: Untreated human immunodeficiency virus type 1 (HIV) infection is associated with persistent immune activation, which is an independent driver of disease progression in European and United States cohorts. In Uganda, HIV-1 subtypes A and D and recombinant AD viruses predominate and exhibit differential rates of disease progression.
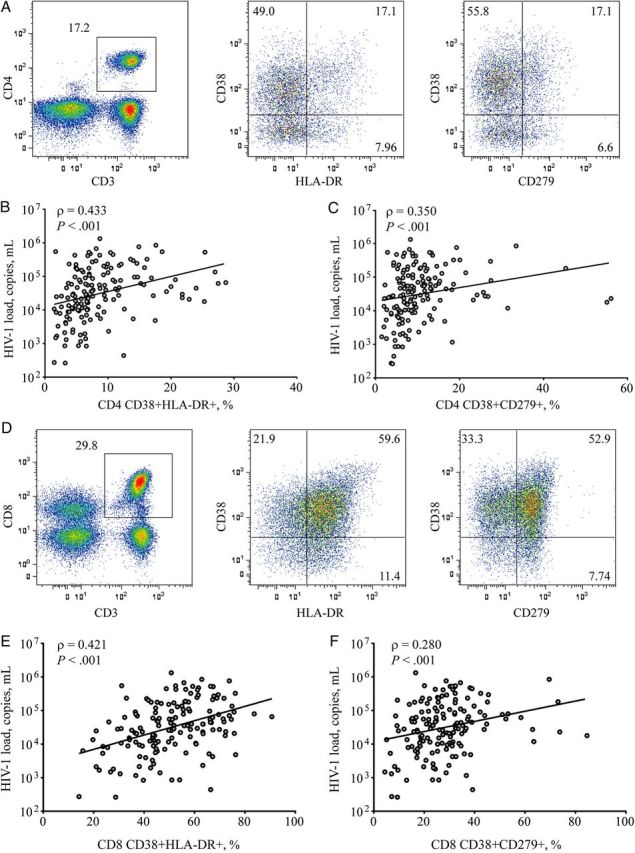
Methods: HIV-1 seroconverters (n = 156) from rural Uganda were evaluated to assess the effects of T-cell activation, viral load, and viral subtype on disease progression during clinical follow-up.
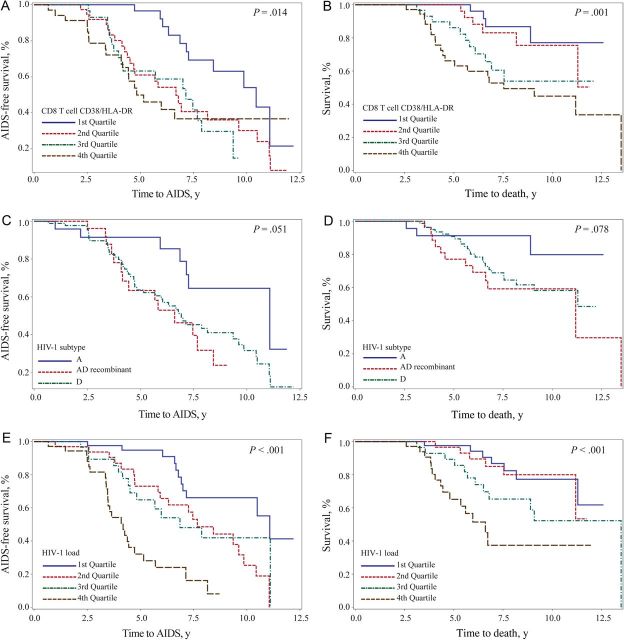
Results: The frequency of activated T cells was increased in HIV-1-infected Ugandans, compared with community matched uninfected individuals, but did not differ significantly between viral subtypes. Higher HIV-1 load, subtype D, older age, and high T-cell activation levels were associated with faster disease progression to AIDS or death. In a multivariate Cox regression analysis, HIV-1 load was the strongest predictor of progression, with subtype also contributing. T-cell activation did not emerge an independent predictor of disease progression from this particular cohort.
Conclusions: These findings suggest that the independent contribution of T-cell activation on morbidity and mortality observed in European and North American cohorts may not be directly translated to the HIV epidemic in East Africa. In this setting, HIV-1 load appears to be the primary determinant of disease progression.
Keywords: AIDS; HIV-1; PD-1; immune activation; subtype D; viral load.
© The Author 2014. Published by Oxford University Press on behalf of the Infectious Diseases Society of America. All rights reserved. For Permissions, please e-mail: journals.permissions@oup.com.
Figures
References
-
- Cao Y, Qin L, Zhang L, Safrit J, Ho DD. Virologic and immunologic characterization of long-term survivors of human immunodeficiency virus type 1 infection. N Eng J Med 1995; 332:201–8. - PubMed
-
- Pantaleo G, Menzo S, Vaccarezza M, et al. Studies in subjects with long-term nonprogressive human immunodeficiency virus infection. N Eng J Med 1995; 332:209–16. - PubMed
-
- Palella FJ, Jr, Delaney KM, Moorman AC, et al. Declining morbidity and mortality among patients with advanced human immunodeficiency virus infection. HIV Outpatient Study Investigators. N Eng J Med 1998; 338:853–60. - PubMed
-
- Giorgi JV, Hultin LE, McKeating JA, et al. Shorter survival in advanced human immunodeficiency virus type 1 infection is more closely associated with T lymphocyte activation than with plasma virus burden or virus chemokine coreceptor usage. J Infect Dis 1999; 179:859–70. - PubMed
-
- Brenchley JM, Price DA, Schacker TW, et al. Microbial translocation is a cause of systemic immune activation in chronic HIV infection. Nat Med 2006; 12:1365–71. - PubMed
Publication types
MeSH terms
Grants and funding
LinkOut - more resources
Full Text Sources
Other Literature Sources
Medical
Molecular Biology Databases
