

Analysis of carbon substrates used by Listeria monocytogenes during growth in J774A.1 macrophages suggests a bipartite intracellular metabolism
- PMID: 25405102
- PMCID: PMC4217532
- DOI: 10.3389/fcimb.2014.00156
Analysis of carbon substrates used by Listeria monocytogenes during growth in J774A.1 macrophages suggests a bipartite intracellular metabolism
Abstract
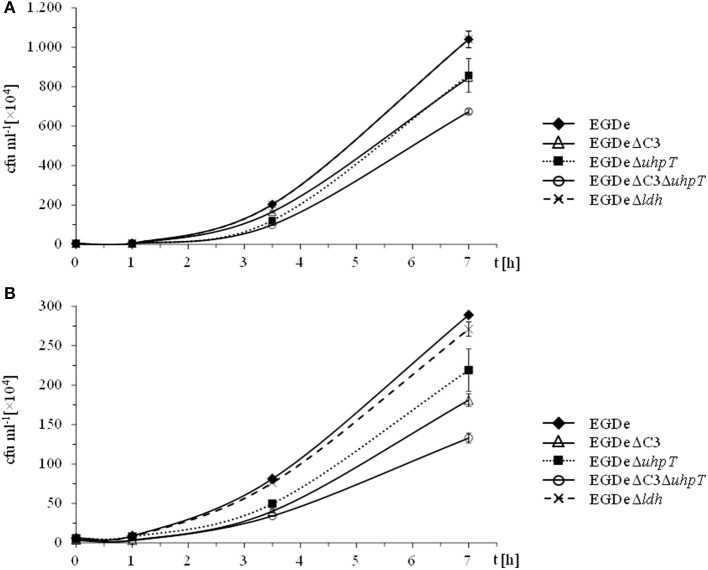
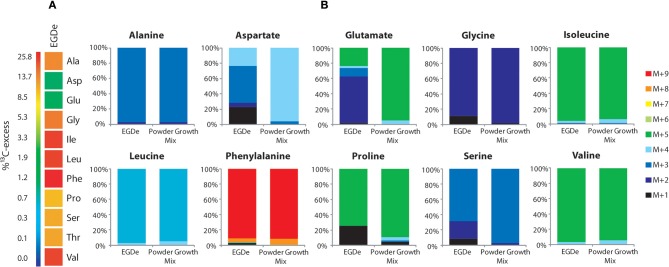
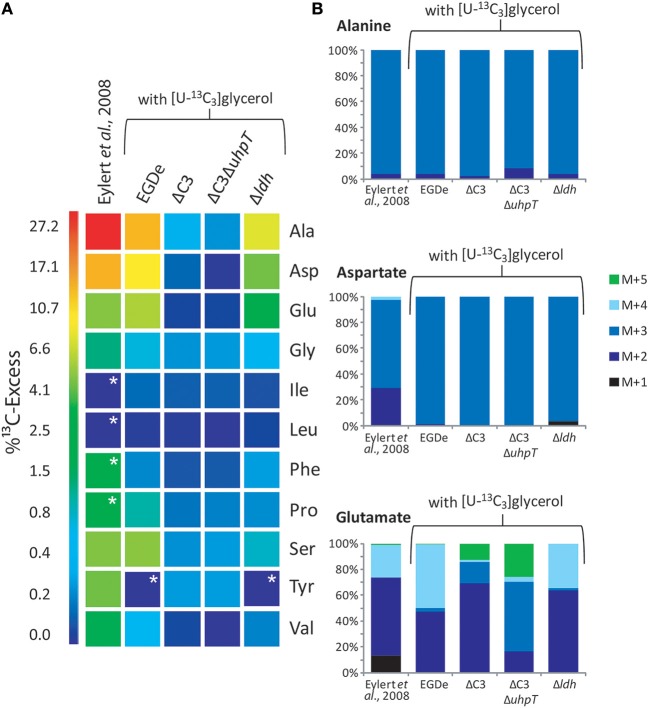
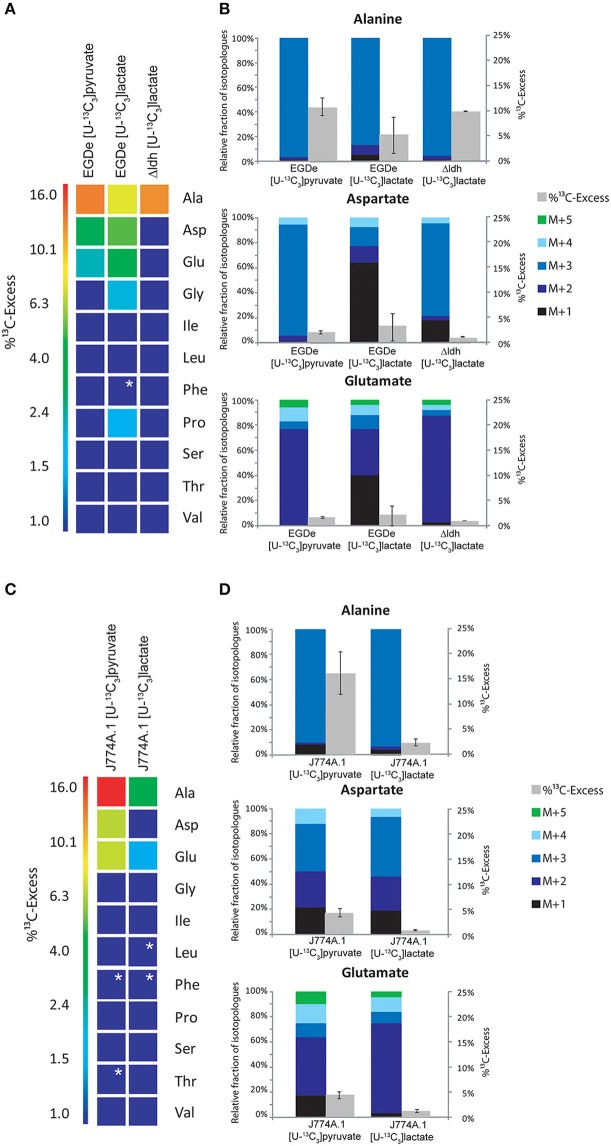
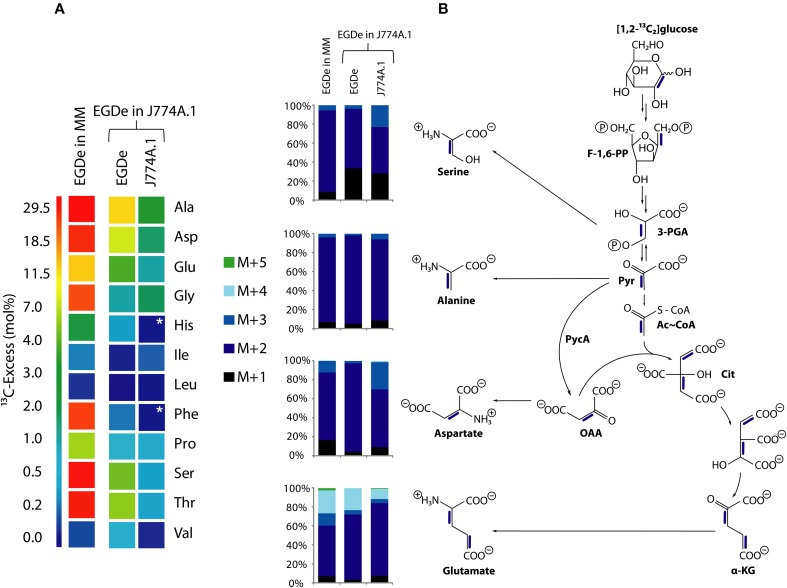
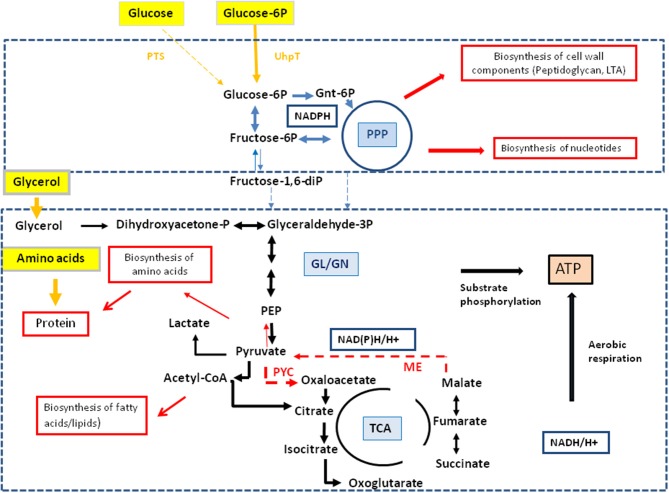
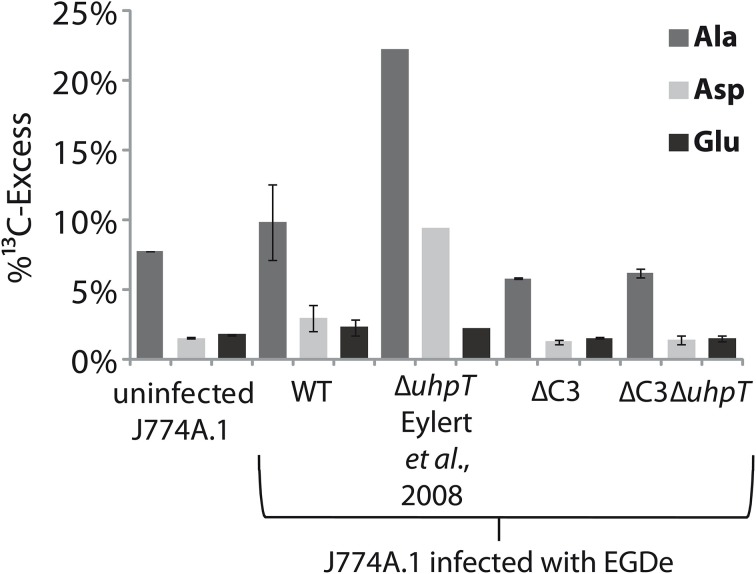
Intracellular bacterial pathogens (IBPs) are dependent on various nutrients provided by the host cells. Different strategies may therefore be necessary to adapt the intracellular metabolism of IBPs to the host cells. The specific carbon sources, the catabolic pathways participating in their degradation, and the biosynthetic performances of IBPs are still poorly understood. In this report, we have exploited the technique of (13)C-isotopologue profiling to further study the carbon metabolism of Listeria monocytogenes by using the EGDe wild-type strain and mutants (defective in the uptake and/or catabolism of various carbon compounds) replicating in J774A.1 macrophages. For this goal, the infected macrophages were cultivated in the presence of [1,2-(13)C2]glucose, [U-(13)C3]glycerol, [U-(13)C3]pyruvate, [U-(13)C3]lactate, or a mix of [U-(13)C]amino acids. GC/MS-based isotopologue profiling showed efficient utilization of amino acids, glucose 6-phosphate, glycerol, and (at a low extent) also of lactate but not of pyruvate by the IBPs. Most amino acids imported from the host cells were directly used for bacterial protein biosynthesis and hardly catabolized. However, Asp was de novo synthesized by the IBPs and not imported from the host cell. As expected, glycerol was catabolized via the ATP-generating lower part of the glycolytic pathway, but apparently not used for gluconeogenesis. The intermediates generated from glucose 6-phosphate in the upper part of the glycolytic pathway and the pentose phosphate shunt likely serve primarily for anabolic purposes (probably for the biosynthesis of cell wall components and nucleotides). This bipartite bacterial metabolism which involves at least two major carbon substrates-glycerol mainly for energy supply and glucose 6-phosphate mainly for indispensible anabolic performances-may put less nutritional stress on the infected host cells, thereby extending the lifespan of the host cells to the benefit of the IBPs.
Keywords: Listeria monocytogenes; bacterial metabolism; bacterial pathogensis; intracellular bacteria; isotopic tracers; isotopologue profiling.
Figures
Similar articles
-
Carbon metabolism of Listeria monocytogenes growing inside macrophages.Mol Microbiol. 2008 Aug;69(4):1008-17. doi: 10.1111/j.1365-2958.2008.06337.x. Epub 2008 Jul 9. Mol Microbiol. 2008. PMID: 18627458
-
Pathway analysis using (13) C-glycerol and other carbon tracers reveals a bipartite metabolism of Legionella pneumophila.Mol Microbiol. 2016 Apr;100(2):229-46. doi: 10.1111/mmi.13313. Epub 2016 Feb 19. Mol Microbiol. 2016. PMID: 26691313
-
Pyruvate carboxylase plays a crucial role in carbon metabolism of extra- and intracellularly replicating Listeria monocytogenes.J Bacteriol. 2010 Apr;192(7):1774-84. doi: 10.1128/JB.01132-09. Epub 2010 Jan 22. J Bacteriol. 2010. PMID: 20097852 Free PMC article.
-
Carbon metabolism of intracellular bacterial pathogens and possible links to virulence.Nat Rev Microbiol. 2010 Jun;8(6):401-12. doi: 10.1038/nrmicro2351. Epub 2010 May 10. Nat Rev Microbiol. 2010. PMID: 20453875 Review.
-
How Viral and Intracellular Bacterial Pathogens Reprogram the Metabolism of Host Cells to Allow Their Intracellular Replication.Front Cell Infect Microbiol. 2019 Mar 4;9:42. doi: 10.3389/fcimb.2019.00042. eCollection 2019. Front Cell Infect Microbiol. 2019. PMID: 30886834 Free PMC article. Review.
Cited by
-
Glycerol monolaurate inhibits Francisella novicida growth and is produced intracellularly in an ISG15-dependent manner.MicroPubl Biol. 2023 Oct 27;2023:10.17912/micropub.biology.000905. doi: 10.17912/micropub.biology.000905. eCollection 2023. MicroPubl Biol. 2023. PMID: 37954520 Free PMC article.
-
To Eat and to Be Eaten: Mutual Metabolic Adaptations of Immune Cells and Intracellular Bacterial Pathogens upon Infection.Front Cell Infect Microbiol. 2017 Jul 13;7:316. doi: 10.3389/fcimb.2017.00316. eCollection 2017. Front Cell Infect Microbiol. 2017. PMID: 28752080 Free PMC article. Review.
-
Listeria monocytogenes requires phosphotransferase systems to facilitate intracellular growth and virulence.PLoS Pathog. 2025 Apr 15;21(4):e1012492. doi: 10.1371/journal.ppat.1012492. eCollection 2025 Apr. PLoS Pathog. 2025. PMID: 40233105 Free PMC article.
-
Identification of genetic elements required for Listeria monocytogenes growth under limited nutrient conditions and virulence by a screening of transposon insertion library.Front Microbiol. 2022 Oct 13;13:1007657. doi: 10.3389/fmicb.2022.1007657. eCollection 2022. Front Microbiol. 2022. PMID: 36312968 Free PMC article.
-
Development of a Genome-Scale Metabolic Model and Phenome Analysis of the Probiotic Escherichia coli Strain Nissle 1917.Int J Mol Sci. 2021 Feb 20;22(4):2122. doi: 10.3390/ijms22042122. Int J Mol Sci. 2021. PMID: 33672760 Free PMC article.
References
-
- Chico-Calero I., Suarez M., Gonzalez-Zorn B., Scortti M., Slaghuis J., Goebel W., et al. . (2002). Hpt, a bacterial homolog of the microsomal glucose-6-phosphate translocase, mediates rapid intracellular proliferation in Listeria. Proc. Natl. Acad. Sci. U.S.A. 99, 431–436. 10.1073/pnas.012363899 - DOI - PMC - PubMed
Publication types
MeSH terms
Substances
LinkOut - more resources
Full Text Sources
Other Literature Sources
Research Materials
Miscellaneous