Comparative Study
. 2014 Nov 18;12(11):e1002000.
doi: 10.1371/journal.pbio.1002000. eCollection 2014 Nov.

An adaptive threshold in mammalian neocortical evolution

Affiliations
Comparative Study

An adaptive threshold in mammalian neocortical evolution

Eric Lewitus et al. PLoS Biol. .

Abstract

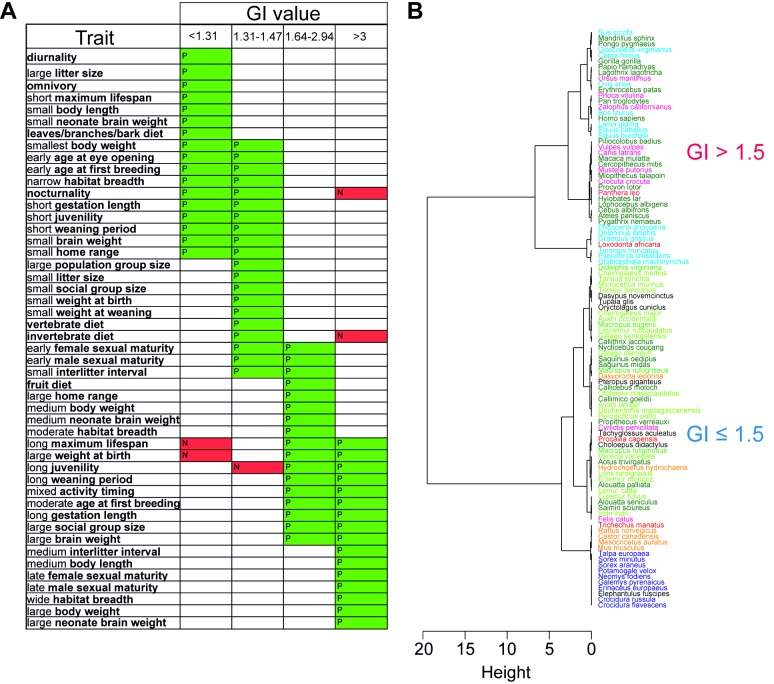
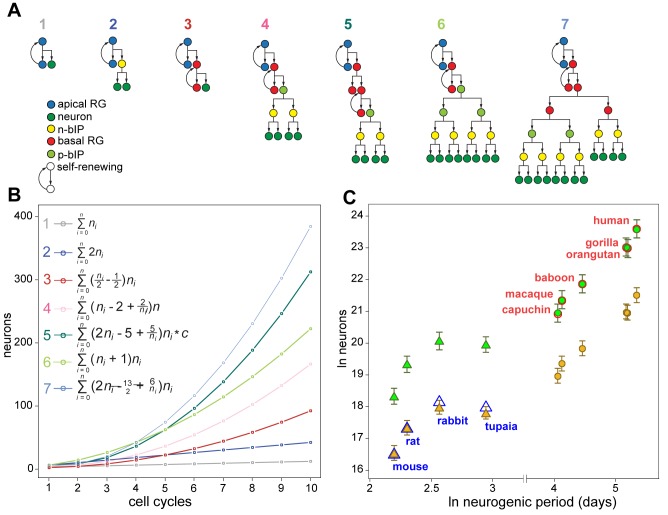
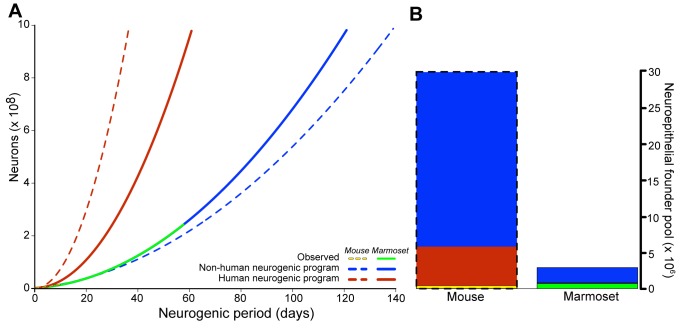
Expansion of the neocortex is a hallmark of human evolution. However, determining which adaptive mechanisms facilitated its expansion remains an open question. Here we show, using the gyrencephaly index (GI) and other physiological and life-history data for 102 mammalian species, that gyrencephaly is an ancestral mammalian trait. We find that variation in GI does not evolve linearly across species, but that mammals constitute two principal groups above and below a GI threshold value of 1.5, approximately equal to 109 neurons, which may be characterized by distinct constellations of physiological and life-history traits. By integrating data on neurogenic period, neuroepithelial founder pool size, cell-cycle length, progenitor-type abundances, and cortical neuron number into discrete mathematical models, we identify symmetric proliferative divisions of basal progenitors in the subventricular zone of the developing neocortex as evolutionarily necessary for generating a 14-fold increase in daily prenatal neuron production, traversal of the GI threshold, and thus establishment of two principal groups. We conclude that, despite considerable neuroanatomical differences, changes in the length of the neurogenic period alone, rather than any novel neurogenic progenitor lineage, are sufficient to explain differences in neuron number and neocortical size between species within the same principal group.


Conflict of interest statement

The authors have declared that no competing interests exist.

Figures

Figure 1
Figure 1. Ancestral reconstruction of GI values for 102 mammalian species.
GI values were determined as illustrated in Figure S1 for the species listed in Table S1. Reconstructed GI values for putative ancestors are presented at selected internal nodes of the phylogenetic tree. MYA, million years ago; colors indicate taxonomic groups. Images of Nissl-stained coronal sections of representative species for each taxonomic group (except marsupials) downloaded from http://brainmuseum.org, along with respective GI values, are shown on the right.
Figure 2
Figure 2. Clustering of GI values based on life-history association analysis (A) and minimum-energy distance (B).
(A) Stochastic mapping of physiological and life-history traits with GI values for the 102 mammalian species listed in Table S1. GI values were separated into four groups based on clustering. Thirty-seven traits (bold letters), each comprising two to eight character states (regular letters), were analyzed (see Table S2 for a complete list), and the states showing a significant positive (P, green) or negative (N, red) association with a group of GI values are shown. Traits are listed according to their positive associations with each GI group moving from least to most gyrencephalic. Note the major overlap between the two low-GI groups (10/27) and between the two high-GI groups (9/24), whereas only 3/48 character states are shared between GI groups <1.5 and >1.5. (B) Hierarchical clustering based on minimum-energy distance of the GI values for 101 mammalian species (see Table S1, with Cynocephalus volans being omitted from this analysis). Note that the greatest clustering height is between species with GI values ≤1.5 and >1.5. Species of the various taxonomic groups are colored according to Figure 1.
Figure 3
Figure 3. Ln-transformed plots showing GI values as a function of adult brain weight (A, B), neocortical volume (C), and cortical neuron number (D).
(A) Regression analysis using one non-linear fit for all values (101 species [see Table S1, with C. volans being omitted from this analysis], y = 0.018x 2+0.037x+0.014, R2 = 0.612, p = 6×10⁻⁵); (B–D) regression analyses using two different linear functions (B, 101 species, blue line: y = 0.075x−0.481, R2 = 0.56, p = 4×10⁻⁵, red line: y = 0.245x+0.018, R2 = 0.73, p = 1×10⁻⁵; (C), 32 species (see Table S1, column E), blue line: y = 0.050x−0.194, R2 = 0.21, p = 0.017, red line: y = 0.154x−1.09, R2 = 0.82, p = 0.004; (D), 25 species (see Table S8), blue line: y = 0.072x−1.188, R2 = 0.81, p = 1×10⁻⁴; red line: y = 0.140x−2.370, R2 = 0.98, p = 3×10⁻⁵) for species with GI values of <1.5 (blue triangles) and >1.5 (red circles), respectively; mouse and human (when depicted) are indicated by green symbols. The inset in (B) shows the Akaike Information Criterion (AIC) values for models fitted with one to five linear slopes; note that a two-slope model best explains the data.
Figure 4
Figure 4. Brain weight generated per gestation day is considerably greater for high-GI than low-GI species.
(A) Density plot showing the frequency of occurrence of the 96 eutherian species listed in Table S1 (omitting C. volans) with GI values of ≤1.5 (blue) and >1.5 (red) as a function of ln-transformed brain weight generated per gestation day. Note that the smallest values for brain weight per gestation day are found only in the low-GI group, while the largest values are found only in the high-GI group, but that the mean values for the two groups is also significantly different (dashed blue and red lines, T = 5.16, degree of freedom [d.f.] = 41, p = 4×10⁻⁵). (B) Ln-transformed plot of brain weight generated per gestation day for the 96 mammalian species (see A). Dashed blue line, mean value for GI≤1.5 (−2.04±0.047, standard deviation [SD]); red dashed line, mean value for GI>1.5 (0.583±0.050, SD). Selected organisms are indicated. The colors of the various high-GI and low-GI species shown above and below the plot, respectively, indicate the taxonomic groups as shown in Figure 1; the sequence of high-GI and low-GI species from left to right is according to Table S1, column A, top to bottom. Brain weight per gestation day was calculated from the data shown in Table S1, columns C and M.
Figure 5
Figure 5. Distinct combinations of progenitor lineages are required to predict cortical neuron numbers for low- versus high-GI species.
(A) Schematics of the seven lineages used to construct neuron output in species. Note that n-bIP refers to the neurogenic subtype of basal intermediate progenitors, and that p-bIP can be either the proliferative subtype of basal intermediate progenitors or bRG undergoing symmetric proliferative division ,. (B) Plotted neuron output of the lineages in (A), beginning with two apical RG cells, over ten cell cycles. Series to the left of the seven curves summarize the neuron output of each lineage, where n i is the number of i divisions. A constant, c = 0.989, is incorporated into the series for lineage 5, allowing the series to converge on the true value of the lineage output as the number of divisions becomes increasingly numerous. (C) Ln-transformed plot of observed neuron counts as a function of neurogenic period for four species with a GI≤1.5 (open blue triangles) and six species with a GI>1.5 (open red circles). Predicted neuron counts were calculated using combinations of the lineages in (A), as specified in Table 2, that accurately fitted to the observed neuron counts either for mouse (closed gold symbols) or human (closed green symbols). Note that the mouse neurogenic program implicates only lineages 1–3, and the human neurogenic program only lineages 2–7. Errors bars represent 75% confidence intervals in cell-cycle length. See Figure S7 and Table S4 for observed and predicted data on a larger set of 17 species.
Figure 6
Figure 6. Mouse and marmoset, both low-GI species, may generate 109 neurons more efficiently by adopting the human neurogenic program than by extending neurogenic period or expanding neuroepithelial founder pool size.
(A) Using its observed neurogenic program (yellow dashed line), the mouse may achieve 109 neurons by extending its observed neurogenic period 14-fold (blue dashed line) or, by using the human neurogenic program (red dashed line), 4-fold. Similarly, the marmoset (green solid line) may achieve 109 neurons using the human neurogenic program (solid red line) in 50% of the time it would take using its observed neurogenic program (solid blue line). (B) The barplot shows the amount by which both species' neuroepithelial founder pools would have to increase to achieve 109 neurons using either their observed (blue) or the human (red) neurogenic program. In (A) and (B), yellow and green line endpoints (A) and bar heights (B) represent observed values for mouse and marmoset, respectively. See Table S4 for primary data and estimates.

Comment in

  • How folded brains evolved in mammals.
    Weaver J. Weaver J. PLoS Biol. 2014 Nov 18;12(11):e1002001. doi: 10.1371/journal.pbio.1002001. eCollection 2014 Nov. PLoS Biol. 2014. PMID: 25405604 Free PMC article. No abstract available.

References

    1. Fietz SA, Huttner WB (2011) Cortical progenitor expansion, self-renewal and neurogenesis – a polarized perspective. Curr Opin Neurobiol 21: 23–35. - PubMed
    1. Lui JH, Hansen DV, Kriegstein AR (2011) Development and evolution of the human neocortex. Cell 146: 18–36. - PMC - PubMed
    1. Borrell V, Reillo I (2012) Emerging roles of neural stem cells in cerebral cortex development and evolution. Dev Neurobiol 72: 955–971. - PubMed
    1. Franco SJ, Muller U (2013) Shaping our minds: stem and progenitor cell diversity in the mammalian neocortex. Neuron 77: 19–34. - PMC - PubMed
    1. Florio M, Huttner WB (2014) Neural progenitors, neurogenesis and the evolution of the neocortex. Development 141: 2182–2194. - PubMed

Publication types

LinkOut - more resources