. 2015 Dec;25(12):4667-77.
doi: 10.1093/cercor/bhu148. Epub 2014 Jul 1.

Task Dependence, Tissue Specificity, and Spatial Distribution of Widespread Activations in Large Single-Subject Functional MRI Datasets at 7T

Affiliations

Task Dependence, Tissue Specificity, and Spatial Distribution of Widespread Activations in Large Single-Subject Functional MRI Datasets at 7T

Javier Gonzalez-Castillo et al. Cereb Cortex. 2015 Dec.

Abstract

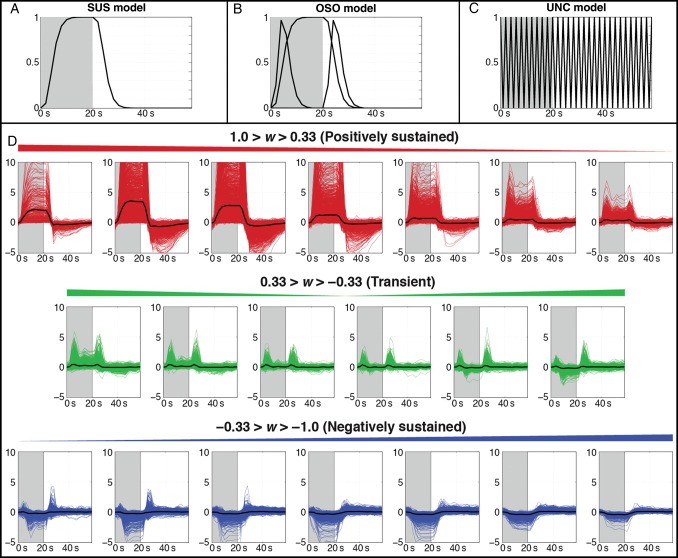
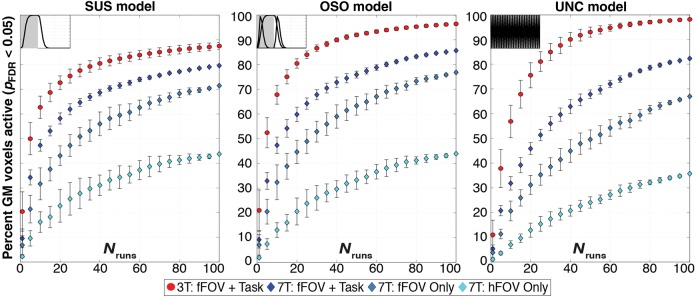
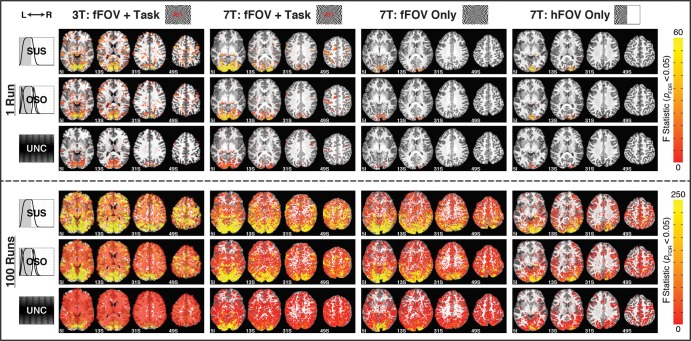
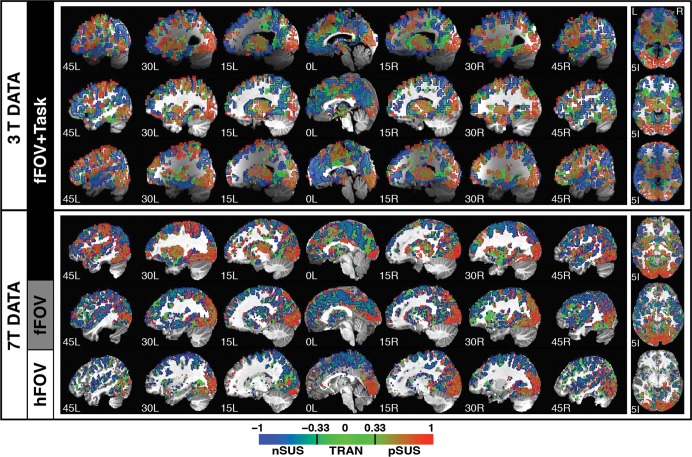
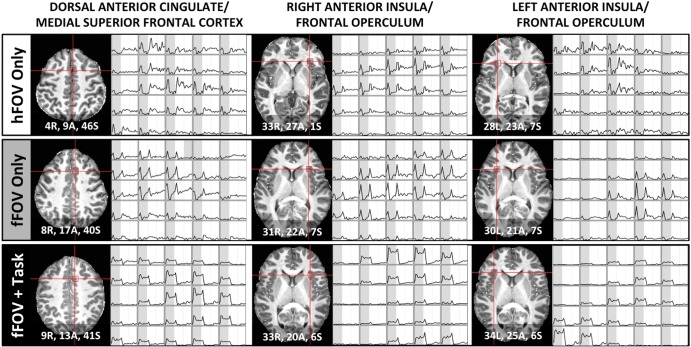
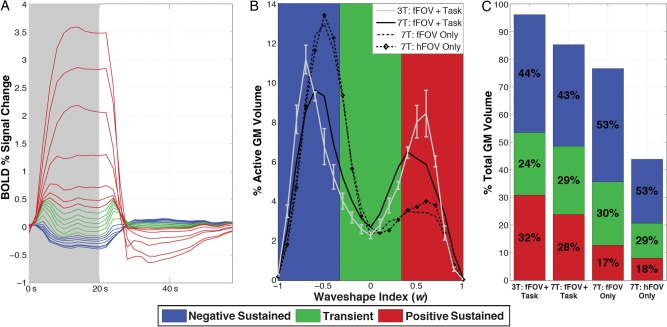
It was recently shown that when large amounts of task-based blood oxygen level-dependent (BOLD) data are combined to increase contrast- and temporal signal-to-noise ratios, the majority of the brain shows significant hemodynamic responses time-locked with the experimental paradigm. Here, we investigate the biological significance of such widespread activations. First, the relationship between activation extent and task demands was investigated by varying cognitive load across participants. Second, the tissue specificity of responses was probed using the better BOLD signal localization capabilities of a 7T scanner. Finally, the spatial distribution of 3 primary response types--namely positively sustained (pSUS), negatively sustained (nSUS), and transient--was evaluated using a newly defined voxel-wise waveshape index that permits separation of responses based on their temporal signature. About 86% of gray matter (GM) became significantly active when all data entered the analysis for the most complex task. Activation extent scaled with task load and largely followed the GM contour. The most common response type was nSUS BOLD, irrespective of the task. Our results suggest that widespread activations associated with extremely large single-subject functional magnetic resonance imaging datasets can provide valuable information about the functional organization of the brain that goes undetected in smaller sample sizes.

Keywords: activation extent; negative BOLD; single subject; transients.


Figures

Figure 1.
Figure 1.
(AC) Response models for 1 cycle (60 s) of the experimental paradigm, with task blocks (20 s) colored in gray. (A) The sustained (SUS) model consists of a gamma-variate BOLD response during the task block. (B) The onset + sustained + offset (OSO) model adds transient responses at the onset and offset of the task block to the SUS model. (C) The unconstrained (UNC) model uses finite impulse response (FIR) functions to model the data with no a priori information beyond task timing. (D) Categorization of response types in active GM for the 7T fFOV + Task subject. Impulse response functions estimated using the UNC model are separated into 20 bins according to the waveshape index (w) and classified as positively sustained (red), transient (green), or negatively sustained (blue). The mean response from within each bin is overlaid in black.
Figure 2.
Figure 2.
Evolution of activation extent in GM as a function of runs entering the analysis (Nruns) for both the 3T and 7T data for pFDR < 0.05. Each panel shows results for a different response model. Markers track expansion of GM activation as Nruns increases for averages of all 3T subjects (red), the same fFOV + Task condition at 7T (dark blue), “fFOV Only” (blue), and “hFOV Only” (light blue). Error bars for 3T data show standard deviation across subjects, while error bars for 7T data represent standard deviation across permutations within a single subject.
Figure 3.
Figure 3.
Maps of activation (pFDR < 0.05) for Nruns = 1 (top 3 rows) and 100 (bottom 3 rows) across subjects and response models. Columns correspond to single subjects, and rows show results from different response models. The “SUS,” “OSO,” and “UNC” rows show significantly active F statistics for those models with yellow indicating stronger activation. Activation extent increases from Nruns = 1 to 100 and decreases from left to right due to differences in quality between 3T and 7T data and lower task demands in “fFOV Only” and “hFOV Only” conditions.
Figure 4.
Figure 4.
Spatial distribution of response types as categorized by the waveshape index (w) in a set of sagittal and axial slices for all 6 participants. A gradient scale was used to color each voxel according to its w index. Additionally, contours were overlaid in the map to depict the classification of voxels in 3 main primary response types: red = positively sustained responses (0.33 < w < 1); green = transient responses (−0.33 < w < 0.33); and blue = negatively sustained responses (−1 < w < −0.33).
Figure 5.
Figure 5.
Voxel-wise responses for the 3 7T participants in the core regions of the task-set network (Dosenbach et al. 2006). The left-most column shows responses in a region at the border of the dorsal anterior cingulate and the medial superior frontal cortex. The middle and right-most columns show responses for voxels within the right and left anterior insula/frontal operculum, respectively. Coordinates provided in MNI space.
Figure 6.
Figure 6.
(A) Relative size of mean responses, as categorized by w into 20 bins in Figure 1D, for active GM voxels in the 7T fFOV + Task subject. Positively sustained, transient, and negatively sustained responses are colored in red, green, and blue, respectively. (B) Histograms of w as a percentage of active GM for each subject (average of 3T subjects shown with standard error bars), showing the relative abundance of each response type. (C) Bar graph showing contributions of each response type relative to total GM volume for all 7T and the average of the 3T subjects. The percentage of GM activation that each response type is responsible for in each subject is overlaid in black.

References

    1. Bianciardi M, Fukunaga M, van Gelderen P, de Zwart JA, Duyn JH. 2011. Negative BOLD-fMRI signals in large cerebral veins. J Cereb Blood Flow Metab. 31:401–412. - PMC - PubMed
    1. Cauda F, Costa T, Diano M, Sacco K, Duca S, Geminiani G, Torta DM. 2014. Massive modulation of brain areas after mechanical pain stimulation: a time-resolved fMRI study. Cereb Cortex. 24:2991–3005. - PubMed
    1. Chang C, Thomason ME, Glover GH. 2008. Mapping and correction of vascular hemodynamic latency in the BOLD signal. Neuroimage. 43:90–102. - PMC - PubMed
    1. Cohen MS. 1997. Parametric analysis of fMRI data using linear systems methods. Neuroimage. 6:93–103. - PubMed
    1. Cox RW. 1996. AFNI: software for analysis and visualization of functional magnetic resonance neuroimages. Comput Biomed Res. 29:162–173. - PubMed

Publication types