. 2015 Feb;156(2):647-59.
doi: 10.1210/en.2014-1741. Epub 2014 Nov 18.

Low temperature-induced circulating triiodothyronine accelerates seasonal testicular regression

Affiliations

Low temperature-induced circulating triiodothyronine accelerates seasonal testicular regression

Keisuke Ikegami et al. Endocrinology. 2015 Feb.

Abstract

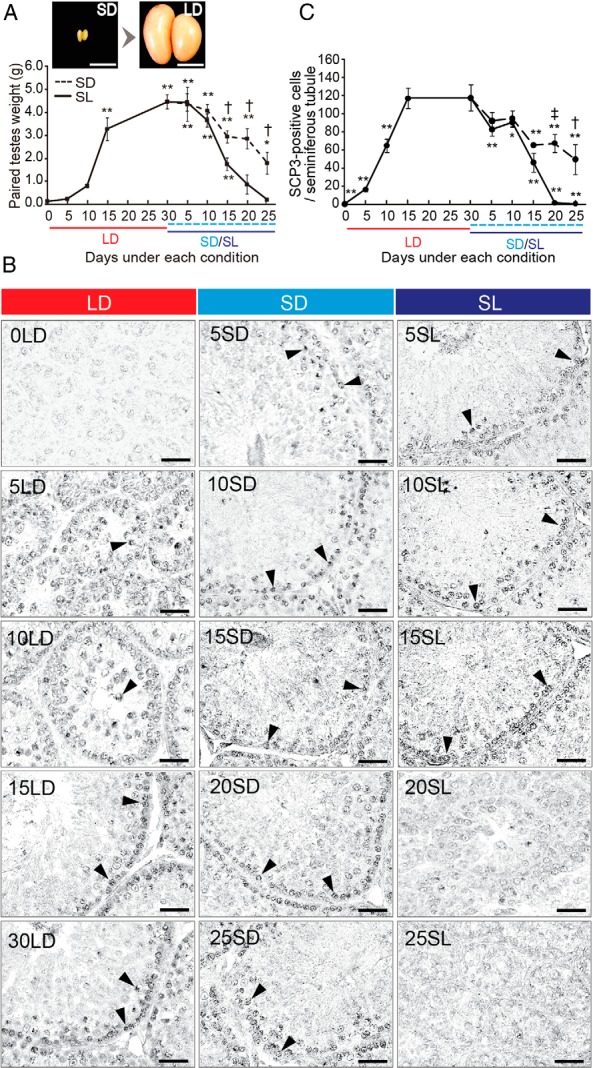
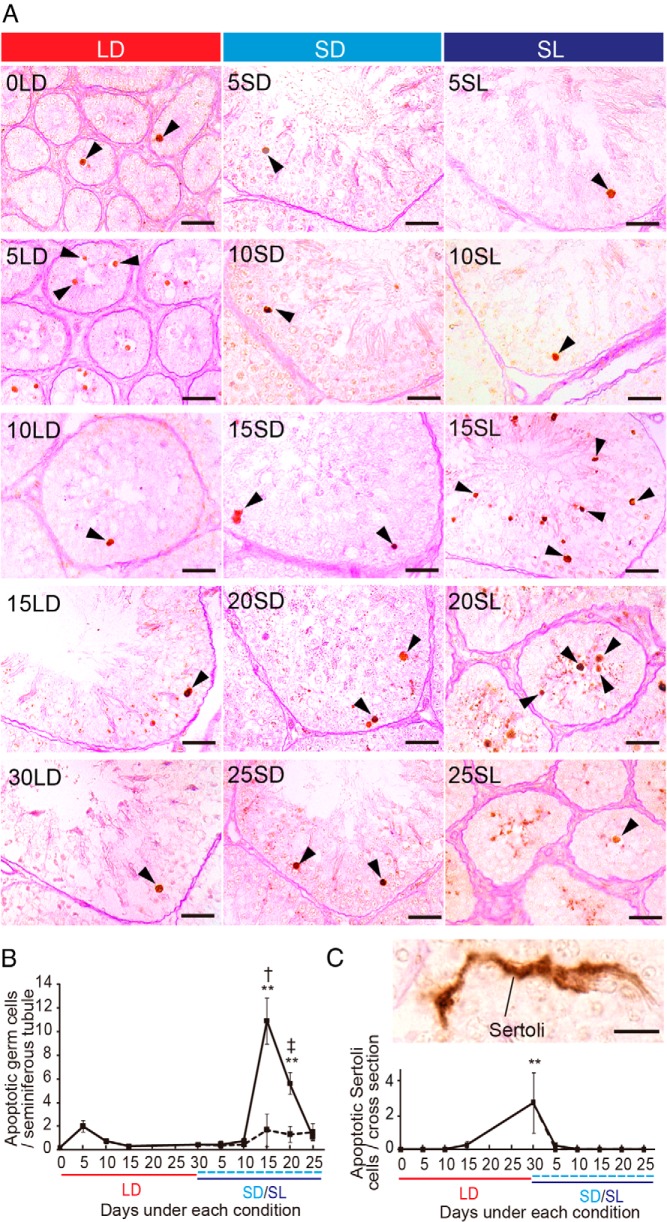
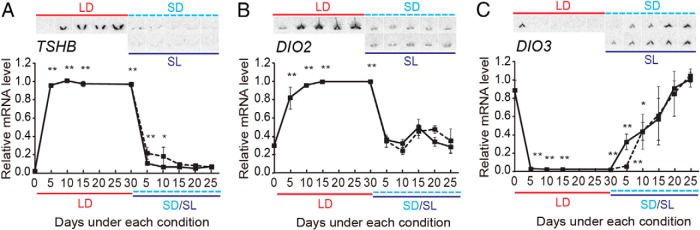
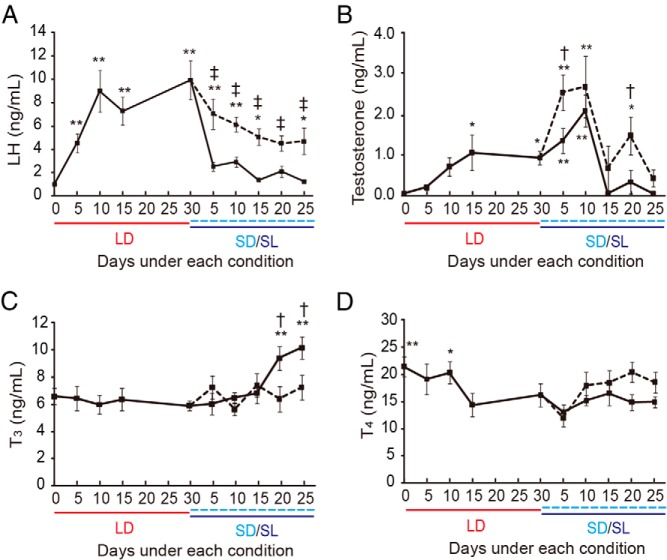
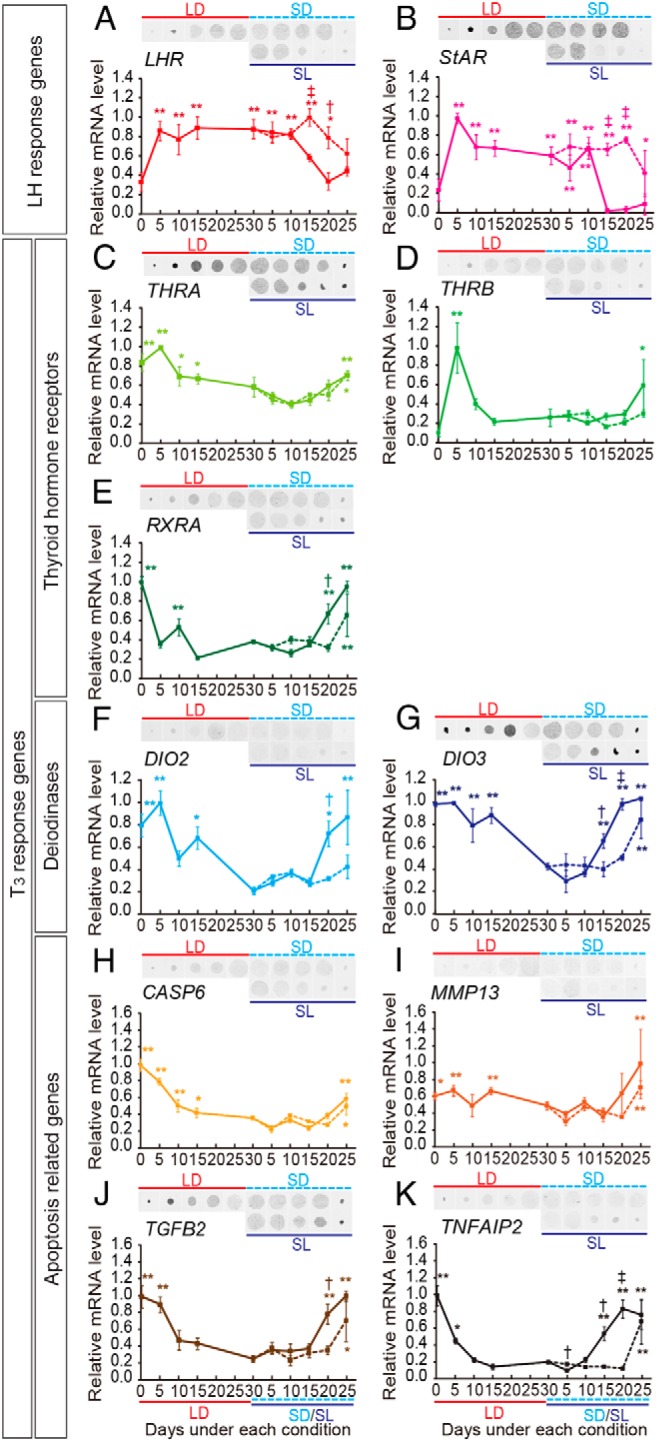
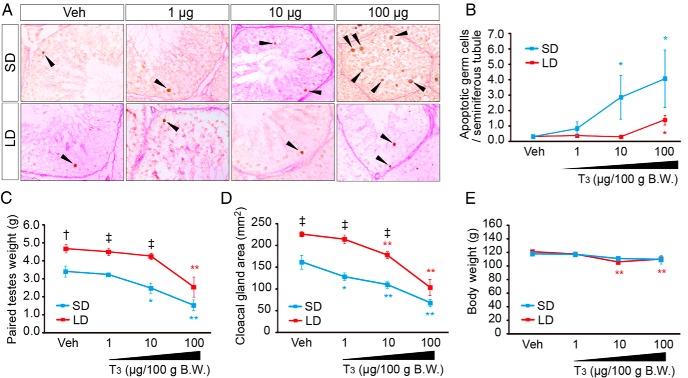
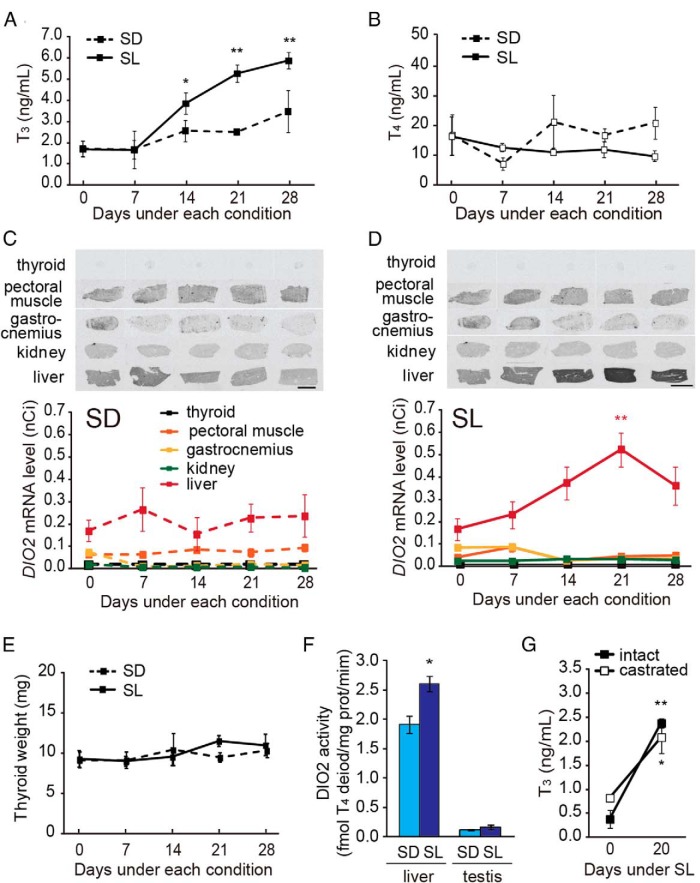
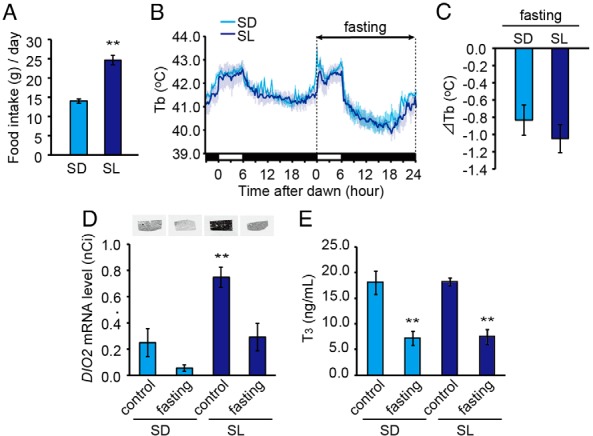
In temperate zones, animals restrict breeding to specific seasons to maximize the survival of their offspring. Birds have evolved highly sophisticated mechanisms of seasonal regulation, and their testicular mass can change 100-fold within a few weeks. Recent studies on Japanese quail revealed that seasonal gonadal development is regulated by central thyroid hormone activation within the hypothalamus, depending on the photoperiodic changes. By contrast, the mechanisms underlying seasonal testicular regression remain unclear. Here we show the effects of short day and low temperature on testicular regression in quail. Low temperature stimulus accelerated short day-induced testicular regression by shutting down the hypothalamus-pituitary-gonadal axis and inducing meiotic arrest and germ cell apoptosis. Induction of T3 coincided with the climax of testicular regression. Temporal gene expression analysis over the course of apoptosis revealed the suppression of LH response genes and activation of T3 response genes involved in amphibian metamorphosis within the testis. Daily ip administration of T3 mimicked the effects of low temperature stimulus on germ cell apoptosis and testicular mass. Although type 2 deiodinase, a thyroid hormone-activating enzyme, in the brown adipose tissue generates circulating T3 under low-temperature conditions in mammals, there is no distinct brown adipose tissue in birds. In birds, type 2 deiodinase is induced by low temperature exclusively in the liver, which appears to be caused by increased food consumption. We conclude that birds use low temperature-induced circulating T3 not only for adaptive thermoregulation but also to trigger apoptosis to accelerate seasonal testicular regression.


Figures

Figure 1.
Figure 1.
Effect of changing day length and temperature on quail testicular weight and meiosis. A, top panels, Testes of quail kept under SD and LD conditions. Scale bars, 1 cm. Bottom panels, Changes in testicular mass in quail transferred from SD to LD and then to short day/low temperature (SL; solid line) or SD (dashed line). *, P < .05; **, P < .01 vs 0 day of LD condition (0LD) (ANOVA); †, P < .05 SL vs SD (t test, n = 8–10). B, Representative photomicrographs for immunohistochemistry of SCP3, a marker of meiosis (arrowhead). Scale bars, 25 μm. C, Changes in number of SCP3-positive cells. *, P < .05; **, P < .01 vs 30LD (corresponding to 0SD/SL) (ANOVA); †, P < .05; ‡, P < .01 SL vs. SD (t test, n = 4–5).
Figure 2.
Figure 2.
Changes in number of apoptotic germ cells and Sertoli cells. A, Representative photomicrographs of TUNEL-labeled germ cells (arrowhead). B, The number of apoptotic germ cells per seminiferous tubule. **, P < .01 vs 0LD (ANOVA); †, P < .05 SL vs SD (t test, n = 4–5). C, Representative photomicrograph of a TUNEL-positive Sertoli cell and the number of such cells per cross-section (but not per seminiferous tubule). Scale bars, 25 μm (A) and 10 μm (C).
Figure 3.
Figure 3.
Temporal expression profiles of key genes involved in regulating seasonal reproduction in the quail brain. A–C, Representative autoradiograms and densitometric quantitation are shown: TSHB in the pars tuberalis (A), DIO2 (B), and DIO3 (C) in the ependymal cells within the MBH. *, P < .05; **, P < .01 vs 0LD (n = 4–5, ANOVA). Solid line, SL; dashed line, SD. Note that in Figures 1–5, all samples were collected at 16 hours after dawn to examine the expressions of TSHB and DIO2 in the brain in the same animals. These genes are rhythmically expressed and show high expression levels at around this time of the day.
Figure 4.
Figure 4.
Changes in serum hormone concentrations. A, LH. B, T. C, T3. D, T4. *, P < .05; **, P < .01 vs trough value (ANOVA); †, P < .05; ‡, P < .01 SL vs SD (t test, n = 5–10). Solid line, SL; dashed line, SD.
Figure 5.
Figure 5.
Temporal change in gene expression in the quail testis. A and B, LH-driven genes (LHR, StAR). C–E, TH receptors (THRA, THRB) and their dimeric partner (RXRA). F and G, Deiodinase genes (DIO2, DIO3). H–K, Apoptosis-related genes (CASP6, MMP13, TGFB2, TNFAIP2). *, P < .05; **, P < .01 vs trough value; †, P < .05; ‡, P < .01 SL vs SD (t test, n = 4–5). Solid line, SL; dashed line, SD.
Figure 6.
Figure 6.
Effect of daily T3 administration on apoptosis, testicular mass, cloacal gland area, and body weight. A, Representative photomicrographs of TUNEL-labeled germ cells (arrowheads). B, The number of apoptotic cells. C–E, Effect of daily ip T3 administration on testis mass (C), cloacal gland area (D), and body weight (B.W.; E). *, P < .05; **, P < .01 vs vehicle (Veh); †, P < .05; ‡, P < .01 SL vs SD (t test, n = 5–12). Red line, LD; blue line, SD.
Figure 7.
Figure 7.
Identification of the tissue responsible for low temperature-induced serum T3. A and B, Changes in serum T3 (A) and T4 (B) levels under SD (dashed line) and SL (solid line) conditions. *, P < .05; **, P < .01 vs day 0. C and D, Changes in DIO2 mRNA in various tissues under SD (C) and SL (D) conditions. Representative autoradiograms (top panel) and densitometric quantification (bottom panel) are shown. **, P < .01 vs day 0. Scale bars, 1 cm. E, Size of thyroid gland did not change under SD and SL conditions. F, DIO2 activity in liver and testis under SD and SL conditions. Samples were collected 28 days after transferred to each condition. *, P < .05 (t test, n = 3–6). G, Castration did not affect low-temperature-induced serum T3 level. *, P < .05; **, P < .01 day 0 vs day 20 (t test, n = 6–8). All samples were collected at 3 hours after dawn under SD/SL condition (ie, midday).
Figure 8.
Figure 8.
Increased food intake is required for low temperature-induced DIO2 expression in the liver. A, Food intake per day measured at 21 days after transfer to SL and SD conditions. **, P < .01 (t test). B and C, Effect of fasting on body temperature (Tb) at 21 days after transfer to SD (light blue) and SL (dark blue) conditions. Light blue and gray shading indicate the SEM. D, Effect of fasting on hepatic DIO2 expression. Samples were collected 12 hours after dawn when the lowest body temperature was observed. Representative autoradiograms (top panel) and densitometric quantification (bottom panel) are shown. E, Effect of fasting on serum T3 levels (mean ± SEM, n = 4–6). **, P < .01 vs SD control (ANOVA, Dunnett's post hoc test).

References

    1. Dawson A, King VM, Bentley GE, Ball GF. Photoperiodic control of seasonality in birds. J Biol Rhythm. 2001;16:365–380. - PubMed
    1. Nakane Y, Ikegami K, Ono H, et al. A mammalian neural tissue opsin (Opsin 5) is a deep brain photoreceptor in birds. Proc Natl Acad Sci USA. 2010;107:15264–15268. - PMC - PubMed
    1. Nakane Y, Shimmura T, Abe H, Yoshimura T. Intrinsic photosensitivity of a deep brain photoreceptor. Curr Biol. 2014;24:R596–R597. - PubMed
    1. Nakane Y, Yoshimura T. Universality and diversity in the signal transduction pathway that regulates seasonal reproduction in vertebrates. Front Neurosci. 2014;8:115. - PMC - PubMed
    1. Nakao N, Ono H, Yamamura T, et al. Thyrotrophin in the pars tuberalis triggers photoperiodic response. Nature. 2008;452:317–322. - PubMed

Publication types