

Time series analysis of trends in malaria cases and deaths at hospitals and the effect of antimalarial interventions, 2001-2011, Ethiopia
- PMID: 25406083
- PMCID: PMC4236017
- DOI: 10.1371/journal.pone.0106359
Time series analysis of trends in malaria cases and deaths at hospitals and the effect of antimalarial interventions, 2001-2011, Ethiopia
Abstract
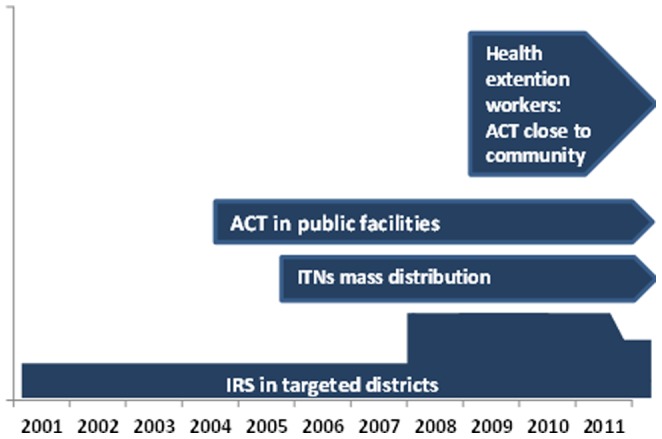
Background: The Government of Ethiopia and its partners have deployed artemisinin-based combination therapies (ACT) since 2004 and long-lasting insecticidal nets (LLINs) since 2005. Malaria interventions and trends in malaria cases and deaths were assessed at hospitals in malaria transmission areas during 2001-2011.
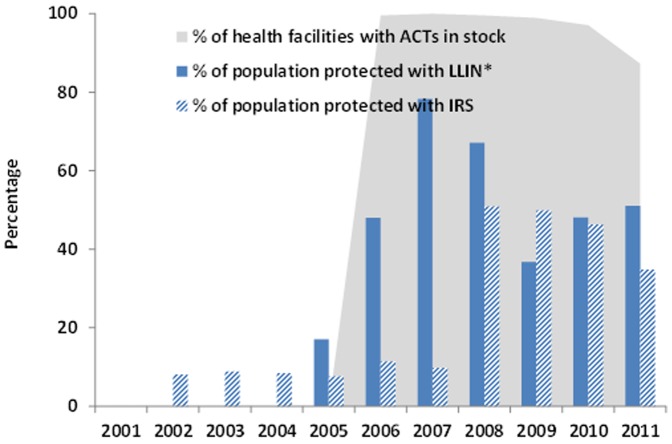
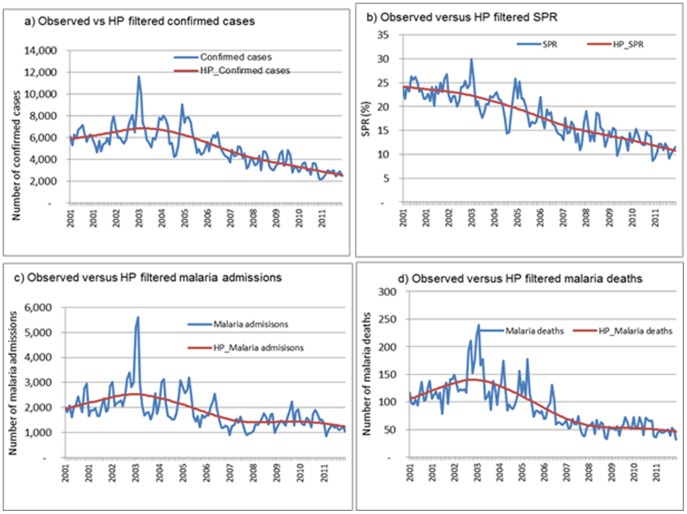
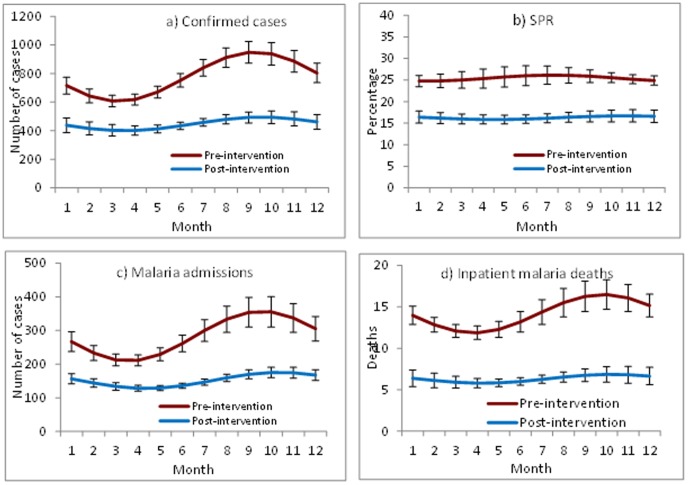
Methods: Regional LLINs distribution records were used to estimate the proportion of the population-at-risk protected by LLINs. Hospital records were reviewed to estimate ACT availability. Time-series analysis was applied to data from 41 hospitals in malaria risk areas to assess trends of malaria cases and deaths during pre-intervention (2001-2005) and post-interventions (2006-2011) periods.
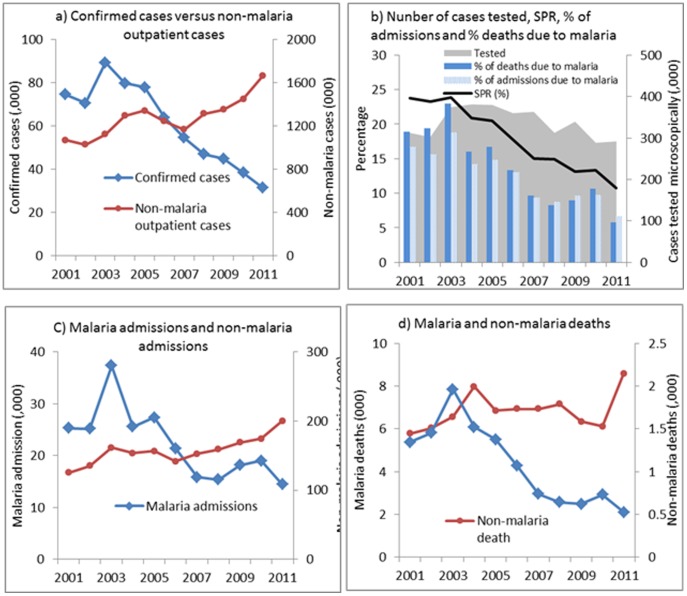
Findings: The proportion of the population-at-risk potentially protected by LLINs increased to 51% in 2011. The proportion of facilities with ACTs in stock exceeded 87% during 2006-2011. Among all ages, confirmed malaria cases in 2011 declined by 66% (95% confidence interval [CI], 44-79%) and SPR by 37% (CI, 20%-51%) compared to the level predicted by pre-intervention trends. In children under 5 years of age, malaria admissions and deaths fell by 81% (CI, 47%-94%) and 73% (CI, 48%-86%) respectively. Optimal breakpoint of the trendlines occurred between January and June 2006, consistent with the timing of malaria interventions. Over the same period, non-malaria cases and deaths either increased or remained unchanged, the number of malaria diagnostic tests performed reflected the decline in malaria cases, and rainfall remained at levels supportive of malaria transmission.
Conclusions: Malaria cases and deaths in Ethiopian hospitals decreased substantially during 2006-2011 in conjunction with scale-up of malaria interventions. The decrease could not be accounted for by changes in hospital visits, malaria diagnostic testing or rainfall. However, given the history of variable malaria transmission in Ethiopia, more data would be required to exclude the possibility that the decrease is due to other factors.
Conflict of interest statement
Figures

References
-
- United Nations, UN Population Division New York (2013) World population prospects. Available: http://esa.un.org/wpp/Accessed 2014 May 6.
-
- Fontaine RE, Najjar AE, Prince JS (1961) The 1958 malaria epidemic in Ethiopia. Am J Trop Med Hyg. 10: 795–803. - PubMed
-
- Negash K, Kebede A, Medhin A, Argaw D, Babaniyi O, et al. (2006) Malaria epidemics in the highlands of Ethiopia. East Afr Med J 82(4): 186–92. - PubMed
MeSH terms
Grants and funding
LinkOut - more resources
Full Text Sources
Other Literature Sources
Medical
