. 2015 Jan 15;75(2):275-83.
doi: 10.1158/0008-5472.CAN-14-1491. Epub 2014 Nov 18.

l-Arginine depletion blunts antitumor T-cell responses by inducing myeloid-derived suppressor cells

Affiliations

l-Arginine depletion blunts antitumor T-cell responses by inducing myeloid-derived suppressor cells

Matthew Fletcher et al. Cancer Res. .

Abstract

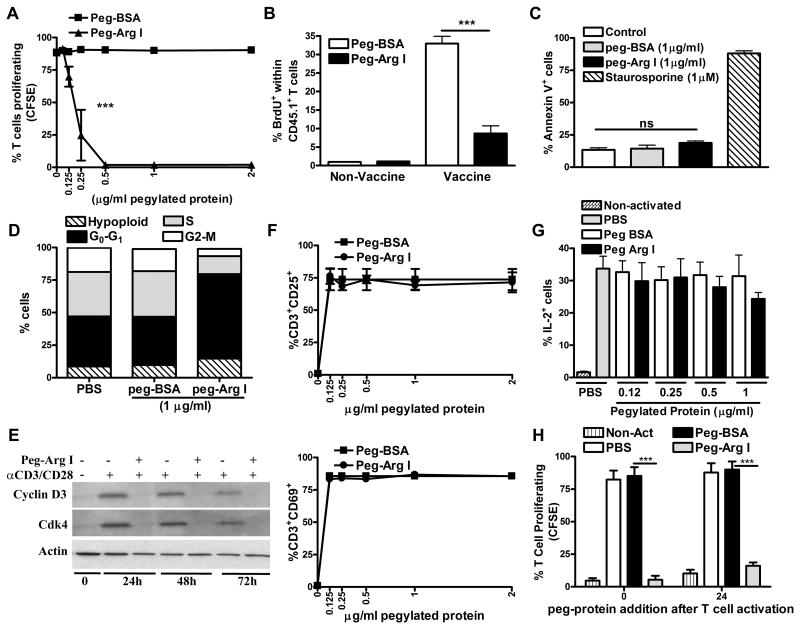
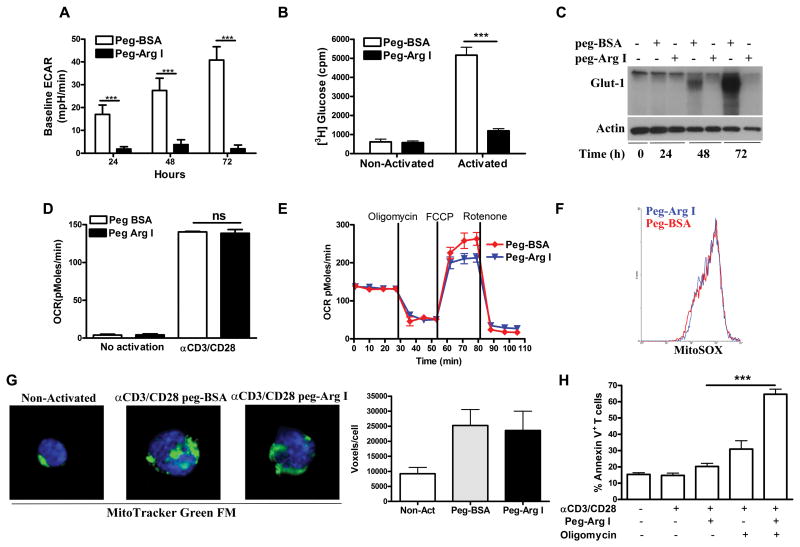
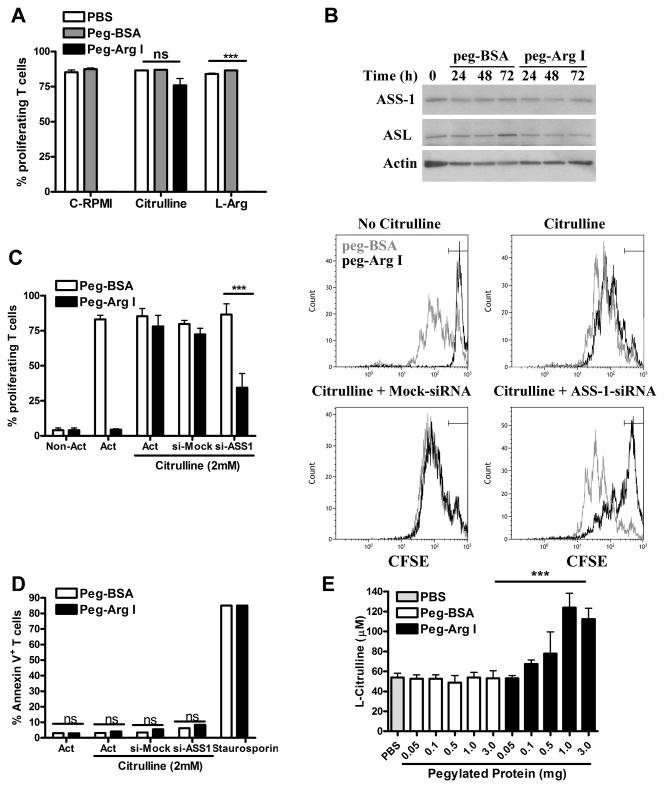
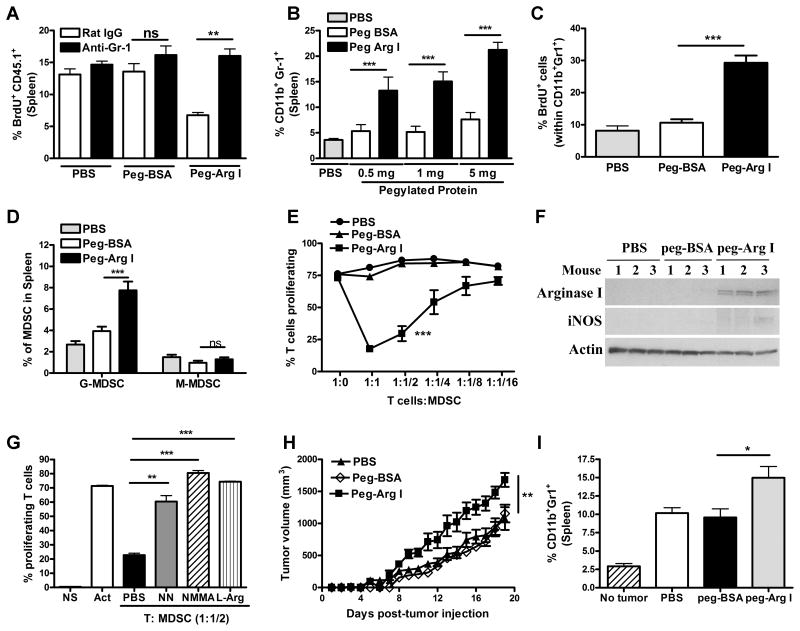
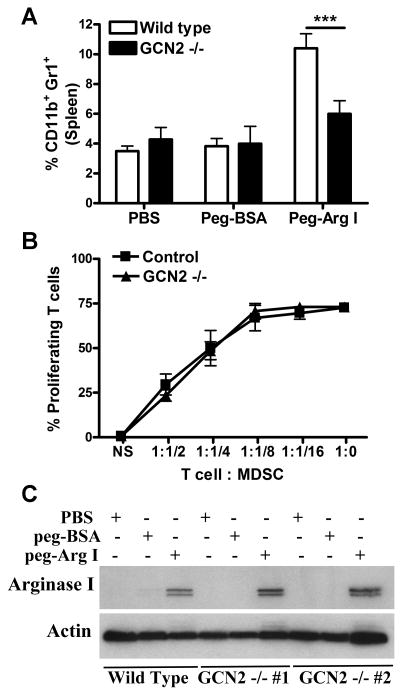
Enzymatic depletion of the nonessential amino acid l-Arginine (l-Arg) in patients with cancer by the administration of a pegylated form of the catabolic enzyme arginase I (peg-Arg I) has shown some promise as a therapeutic approach. However, l-Arg deprivation also suppresses T-cell responses in tumors. In this study, we sought to reconcile these observations by conducting a detailed analysis of the effects of peg-Arg I on normal T cells. Strikingly, we found that peg-Arg I blocked proliferation and cell-cycle progression in normal activated T cells without triggering apoptosis or blunting T-cell activation. These effects were associated with an inhibition of aerobic glycolysis in activated T cells, but not with significant alterations in mitochondrial oxidative respiration, which thereby regulated survival of T cells exposed to peg-Arg I. Further mechanistic investigations showed that the addition of citrulline, a metabolic precursor for l-Arg, rescued the antiproliferative effects of peg-Arg I on T cells in vitro. Moreover, serum levels of citrulline increased after in vivo administration of peg-Arg I. In support of the hypothesis that peg-Arg I acted indirectly to block T-cell responses in vivo, peg-Arg I inhibited T-cell proliferation in mice by inducing accumulation of myeloid-derived suppressor cells (MDSC). MDSC induction by peg-Arg I occurred through the general control nonrepressed-2 eIF2α kinase. Moreover, we found that peg-Arg I enhanced the growth of tumors in mice in a manner that correlated with higher MDSC numbers. Taken together, our results highlight the risks of the l-Arg-depleting therapy for cancer treatment and suggest a need for cotargeting MDSC in such therapeutic settings.


Conflict of interest statement

Disclosure of conflict of interest: Authors do not have conflict of interest to disclose.

Figures

Figure 1
Figure 1. Peg-Arg I arrest T-cell proliferation, without inducing apoptosis or altering activation
(A) CFSE-labelled T-cells were stimulated with anti-CD3/CD28 in the presence of peg-Arg I or peg-BSA. Percentages of proliferating T-cells were determined 72 hours later by flow cytometry. Values are from 3 experiments. (B) CD45.1+/OT-1 cell proliferation was monitored in spleens of mice treated with peg-Arg I or peg-BSA (5 mg/mouse, n=10) using BrdU, as described in the Methods. (C-D) Activated T-cells were treated with 1 μg/ml peg-Arg I or peg-BSA for 72 hours, after which they were stained with annexin V (C) or propidium iodide (D). T-cells treated with 1 μM staurosporine were used as positive apoptosis controls. (E) Representative experiment showing the expression of cyclin D3 and Cdk4 in T-cells treated with 1 μg/ml peg-Arg I. (F-G) Percentages of T-cells having CD25, CD69 (F), or IL-2 (G) after activation and culture for 48 hours with increasing levels of peg-Arg I or peg-BSA. (H) Peg-Arg I or peg-BSA (1 μg/mL) were added to stimulated T-cells labelled with CFSE at 0 or 24 hours after plating, and proliferation detected after 72 hours by flow cytometry. All data are expressed as mean +/- SEM from 3 experiments. * ** p < 0.001
Figure 2
Figure 2. Effects of peg-Arg I on T-cell energy metabolic pathways
(A) T-cells were treated with 1 μg/mL peg-Arg I or peg-BSA for 24-72 hours. Then, ECAR was measured via an extracellular flux analyser. (B) Glucose-[3-3H] uptake in activated T-cells treated with peg-Arg I or peg-BSA for 48 hour. (C) Expression of Glut-1 was tested in T-cells cultured in the presence of 1 μg/mL peg-Arg I or peg-BSA. (D-E) OCR in activated T-cells cultured with peg-Arg I or peg-BSA for 24 hours was analyzed under basal conditions (D) and in response to oligomycin, FCCP and rotenone (E). (F) Activated T-cells treated with peg-Arg I or peg-BSA for 48 hours were stained with MitoSOX and analyzed by flow cytometry. (G) Activated T-cells treated with peg-Arg I or peg-BSA for 72 hours were stained with Mitotracker Green-FM and DAPI and images were captured at equal exposure. Voxel quantification was achieved using Mask analysis. (H) Annexin V staining in activated T-cells treated with peg-Arg I +/- oligomycin (100 nM) for 48 hours. Results are expressed as mean +/- SEM from 3 experiments. Non-statistical significant differences (ns): p > 0.05. *** p < 0.001.
Figure 3
Figure 3. Role of L-Arg synthesis in T-cells in the effects induced by peg-Arg I
(A) Activated CFSE-labelled T-cells were treated with peg-Arg I or peg-BSA (1 μg/mL) in media supplemented with 2 mM citrulline or L-Arg. Percentages of proliferating T-cells were evaluated by flow cytometry at 72 hours. (B) Representative experiment for the expression of ASS-1 and ASL in T-cells cultured in the presence of peg-Arg I or peg-BSA. (C) Activated CFSE-labelled T-cells were transfected with ASS-1 or non-targeting control siRNA (2 μM) +/- peg-Arg I or peg-BSA in media supplemented with citrulline for 72 hours. T-cell proliferation was measured by flow cytometry, with pooled results from three experiments (left) and a representative result (right). (D) T-cells from (C) were tested for annexin V expression by flow cytometry. (E) Serum collected from mice (n=5) treated with peg-Arg I or peg-BSA for 12 hours. Levels of citrulline were established by HPLC. Findings are expressed as mean +/- SEM from 3 experiments. Non-statistical significant differences (ns): p > 0.05. *** p < 0.001.
Figure 4
Figure 4. MDSC mediate anti-proliferative effects of peg-Arg I in mice
(A) Proliferation, as tested by BrdU, in CD45.1+/OT-1 T-cells adoptively transferred into CD45.2+ mice that received peg-Arg I or peg-BSA (1 mg/mouse), immunization with siinfekl, and treatments with anti-Gr-1 antibody or IgG, as described in the Methods (n=10 for each group). (B) Mice (n=10) were injected i.p. with peg-Arg I, peg-BSA, or PBS every 2 days for 7 days. Then, percentages of CD11b+ Gr-1+ were tested in spleens by flow cytometry. (C) Proliferation of MDSC was determined by BrdU, as described in the Methods. (D) Samples from B (0.5 mg/mouse) were tested for G-MDSC (CD11b+ Ly6G+ Ly6Clow) and M-MDSC (CD11b+ Ly6Gneg Ly6Chigh). (E) Proliferation of CFSE-labeled T-cells was measured 72 hours after co-culture with different ratios of splenic CD11b+ Gr-1+ cells from peg-Arg I, peg-BSA or PBS-treated mice. (F) Arginase I and iNOS in splenic CD11b+ Gr-1+ cells from mice treated with peg-Arg I, peg-BSA or PBS. (G) Proliferation of CFSE-labeled T-cells co-cultured with splenic peg-Arg I-induced MDSC (1:1/2 ratio) after addition of NN (200 μM), L-NMMA (500 μM) or L-Arg (2 mM). (H) 1×10⁶ 3LL cells were injected s.c. into mice (n=5), followed by peg-Arg I, peg-BSA or PBS injections i.p. (1 mg) every 3 days. (I) CD11b+ Gr-1+ within spleens of peg-Arg I, peg-BSA or PBS-treated 3LL-bearing mice (17 days). Results are expressed as mean +/- SEM from 3 experiments. Non-statistical significant differences (ns): p > 0.05;** p<0.01; *** p < 0.001.
Figure 5
Figure 5. Peg-Arg I induced MDSC accumulation is mediated by GCN2
(A) Wild type and GCN2-deficient mice were injected i.p. with 1 mg of peg-Arg I, peg-BSA, or PBS every 2 days for 7 days. Then, splenic CD11b+ Gr+ cells were determined by flow cytometry. (B) Proliferation of CFSE-labeled T-cells after co-culture with different ratios of splenic MDSC from control or GCN2-/- peg-Arg I-treated mice. (C) Arginase I in splenic CD11b+ Gr+ cells from wild type or GCN2-/- mice treated with peg-Arg I, peg-BSA, or PBS. Results are expressed as mean +/- SEM from 3 experiments. *** p < 0.001.

References

    1. Andersen MH. The targeting of immunosuppressive mechanisms in hematological malignancies. Leukemia. 2014;28:1784–1792. - PubMed
    1. Pearce EL, Poffenberger MC, Chang CH, Jones RG. Fueling immunity: insights into metabolism and lymphocyte function. Science. 2013;342:1242454. - PMC - PubMed
    1. Phillips MM, Sheaff MT, Szlosarek PW. Targeting Arginine-Dependent Cancers with Arginine-Degrading Enzymes: Opportunities and Challenges. Cancer Res Treat. 2013;45:251–262. - PMC - PubMed
    1. Szlosarek PW, Luong P, Phillips MM, Baccarini M, Stephen E, Szyszko T, et al. Metabolic response to pegylated arginine deiminase in mesothelioma with promoter methylation of argininosuccinate synthetase. J Clin Oncol. 2013;31:e111–e113. - PubMed
    1. Bronte V, Serafini P, Mazzoni A, Segal DM, Zanovello P. L-arginine metabolism in myeloid cells controls T-lymphocyte functions. Trends Immunol. 2003;24:302–306. - PubMed

Publication types

MeSH terms