. 2015 Jan 9;290(2):1020-38.
doi: 10.1074/jbc.M114.588913. Epub 2014 Nov 18.

Measuring glutathione redox potential of HIV-1-infected macrophages

Affiliations

Measuring glutathione redox potential of HIV-1-infected macrophages

Ashima Bhaskar et al. J Biol Chem. .

Abstract

Redox signaling plays a crucial role in the pathogenesis of human immunodeficiency virus type-1 (HIV-1). The majority of HIV redox research relies on measuring redox stress using invasive technologies, which are unreliable and do not provide information about the contributions of subcellular compartments. A major technological leap emerges from the development of genetically encoded redox-sensitive green fluorescent proteins (roGFPs), which provide sensitive and compartment-specific insights into redox homeostasis. Here, we exploited a roGFP-based specific bioprobe of glutathione redox potential (E(GSH); Grx1-roGFP2) and measured subcellular changes in E(GSH) during various phases of HIV-1 infection using U1 monocytic cells (latently infected U937 cells with HIV-1). We show that although U937 and U1 cells demonstrate significantly reduced cytosolic and mitochondrial E(GSH) (approximately -310 mV), active viral replication induces substantial oxidative stress (E(GSH) more than -240 mV). Furthermore, exposure to a physiologically relevant oxidant, hydrogen peroxide (H2O2), induces significant deviations in subcellular E(GSH) between U937 and U1, which distinctly modulates susceptibility to apoptosis. Using Grx1-roGFP2, we demonstrate that a marginal increase of about ∼25 mV in E(GSH) is sufficient to switch HIV-1 from latency to reactivation, raising the possibility of purging HIV-1 by redox modulators without triggering detrimental changes in cellular physiology. Importantly, we show that bioactive lipids synthesized by clinical drug-resistant isolates of Mycobacterium tuberculosis reactivate HIV-1 through modulation of intracellular E(GSH). Finally, the expression analysis of U1 and patient peripheral blood mononuclear cells demonstrated a major recalibration of cellular redox homeostatic pathways during persistence and active replication of HIV.

Keywords: AIDS; Human Immunodeficiency Virus (HIV); Mycobacterium tuberculosis; Pathogenesis; Redox Signaling.


Figures

FIGURE 1.
FIGURE 1.
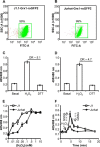
Generation of transgenic cell lines expressing the biosensor. Dot plot of U1 (A and B) and U937 cells (C and D) expressing the biosensor either in the cytosol or in the mitochondrial matrix. E, confocal image of U937 cells expressing Grx1-roGFP2 in the cytosol. F, mitochondrial targeting of the biosensor expressed in U937 cells. Grx1-roGFP2 is shown as green, and MitoTracker stain is red, and yellow signal demonstrates overlap. G, response of each cell line to exogenously applied oxidant H2O2 (10 mm) and reductant DTT (10 mm) for 5 min. DR, dynamic range. H, U937 cells expressing cytosolic EGSH bioprobe were treated with 1 mm BSO for 24 h followed by recovery in fresh media for an additional 24 h. Error bars represent standard deviation from the mean (n = 3). DIC, differential interference contrast.
FIGURE 2.
FIGURE 2.
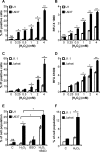
Redox responsiveness of U1 and U937 cells toward H2O2. U1 and U937 cells expressing cytosolic (A) and mitochondrial (B) EGSH probes were treated with varying concentrations of H2O2 for 2 min, and the ratiometric sensor response was measured. U1 and U937 cells expressing cytosolic (C) and (D) mitochondrial biosensors were treated with 20 μm H2O2, and the ratiometric sensor response was measured over time. Arrows represent increase or decrease in subcellular GSSG pool in response to oxidative or anti-oxidative response, respectively. E, U1 and U937 cells expressing the cytosolic EGSH bioprobe were treated with 1 and 5 mm BSO, and sensor response was measured at indicated time points. p values are calculated by comparing treated samples with untreated controls. Whole-cell total glutathione (F) and GSSG (G) concentrations were measured in lysates of unstressed U1 and U937 cells. U1 and U937 cells were treated with 20 μm H2O2, and whole-cell total glutathione (H) and GSSG (I) concentrations were measured at indicated time points. Error bars represent S.D. from the mean. All experiments are performed at least twice. p values were calculated by comparing U1 and U937 cells. *, p < 0.01; **, p < 0.05; ns, not significant.
FIGURE 3.
FIGURE 3.
Generation of J1.1 and Jurkat cells stably expressing the bioprobe and their redox responses toward H2O2. Dot plot of J1.1 cells (A) and Jurkat cells (B) expressing the biosensor in the cytosol is shown. Response of J1.1 cells (C) and Jurkat cells (D) to exogenously applied oxidant H2O2 (10 mm) and reductant DTT (10 mm) for 5 min is shown. DR, dynamic range. E, J1.1 and Jurkat cells expressing cytosolic EGSH probe were treated with varying concentrations of H2O2 for 2 min, and ratiometric sensor response was measured. F, J1.1 and Jurkat cells expressing cytosolic biosensor were treated with 10 μm H2O2, and the ratiometric sensor response was measured over time. Arrows represent increase or decrease in subcellular GSSG pool in response to oxidative or anti-oxidative response, respectively. Error bars represent S.D. from the mean (n = 3). RFU, relative fluorescence unit.
FIGURE 4.
FIGURE 4.
U1 and J1.1 cells are intrinsically resistant to oxidative stress and apoptosis. A, U1 and U937 cells were treated with different concentrations of H2O2 for 4 h and stained with PI. B, U1 and U937 cells, loaded with CMH2DCF-DA, were treated with increasing concentrations of H2O2, and DCF fluorescence was assessed by flow cytometry. PI staining (C) and ROS detection (D) in J1.1 and Jurkat cells upon H2O2 treatment are shown. An increase in the DCF fluorescence reflects the increase in ROS levels upon H2O2 treatment. E, U1 and U937 cells were treated with 50 μm H2O2 in the absence or presence of 250 μm BSO. After 24 h, cells were harvested and analyzed for apoptosis by annexin-V/PI staining. F, apoptosis in J1.1 and Jurkat cells upon treatment with 10 μm H2O2 for 24 h. The percentages of annexin-V+/PI cells are shown. C represents untreated control. Error bars represent S.D. from the mean (n = 3). *, p < 0.01; **, p < 0.001, ns, not significant.
FIGURE 5.
FIGURE 5.
Effects of EGSH on HIV-1 activation. A, U1 cells were exposed to varying concentrations of H2O2 for 6 h after which cells were harvested and analyzed for viral activation by Gag qRT-PCR. In a parallel experiment, ratiometric sensor response was measured by flow cytometry. B, U1 cells were treated with 75 and 125 μm of H2O2 in the absence or presence of 250 μm BSO. After 6 h, cells were subjected to Gag qRT-PCR. C, in a parallel experiment, ratiometric sensor response was measured by flow cytometry. D, U1 cells were treated with 15 mm NAC for 2 h followed by exposure to 1 and 2 mm of H2O2. After 6 h, the extent of viral activation was analyzed by Gag qRT-PCR. Error bars represent S.D. from the mean (n = 3). *, p < 0.01; **, p < 0.001; C, control.
FIGURE 6.
FIGURE 6.
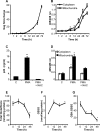
HIV-1-induced changes in EGSH of U1 cells. A, course of HIV-1 replication after stimulation of U1 cells with 5 ng/ml PMA. Viral load was monitored by Gag qRT-PCR. B, U1 cells expressing cytosolic and mitochondrial EGSH probe were treated with 5 ng/ml PMA, and sensor response was recorded at indicated time points. p values shown were calculated by comparing cytosolic and mitochondrial sensor response. U1 cells were treated with PMA in the absence or presence of 15 mm NAC. After 24 h, HIV-1 replication was monitored by p24 ELISA of culture supernatants (C), and U1 ratiometric sensor response was monitored by flow cytometry (D). p values were obtained by comparing samples treated with PMA and PMA + NAC. Whole-cell total glutathione (E) and GSSG (F) concentrations measured in lysates prepared from PMA-treated U1 cells at indicated time points. G, GSH/GSSG ratios were derived from the total glutathione and GSSG values obtained in E and F. p values are calculated by comparing PMA-treated samples with untreated control. Error bars represent S.D. from the mean. All experiments are performed at least twice. *, p < 0.05; **, p < 0.001; #, p < 0.005. C, untreated control.
FIGURE 7.
FIGURE 7.
Diverse HIV-1-activating agents commonly induce oxidative shift in cytosolic and mitochondrial EGSH of U1 cells. U1-Grx1-roGFP2 and U1-mito-Grx1-roGFP2 cells were treated with either 5 ng/ml PMA for 12 h (A) or 100 ng/ml TNF-α for 72 h (B) followed by intracellular staining for HIV-1 p24. EGSH of p24+ and p24 cells was determined using multi-parameter flow cytometric analysis. Percent HIV-1 activation (C) and EGSH of p24+ and p24 U1 cells (D) following treatment with Nef and Tat proteins for 72 h were determined by intracellular staining for HIV-1 p24 and multiparameter flow cytometric analysis, respectively. p values were calculated by comparing treated cells with untreated controls in each panel. C, untreated control. Error bars represent S.D. from the mean (n = 3). *, p < 0.01; **, p < 0.001.
FIGURE 8.
FIGURE 8.
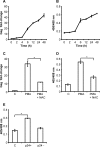
HIV-1-induced changes in EGSH of J1.1 cells. Viral load (A) and biosensor response (B) in J1.1 cells after stimulation with 5 ng/ml PMA are shown. J1.1 cells were treated with PMA in the absence or presence of 5 mm NAC (C). After 24 h, HIV-1 replication was monitored by Gag qRT-PCR. In a parallel experiment, biosensor response was monitored by flow cytometry (D). E, EGSH of p24+ and p24 J1.1 cells after treatment with 100 ng/ml TNF-α for 72 h. Error bars represent S.D. from the mean. *, p < 0.05. C, untreated control.
FIGURE 9.
FIGURE 9.
M. tuberculosis polyketide lipids induce substantial oxidative shift in EGSH to activate HIV-1 from persistence. A, U937-Grx1-roGFP2 cells were infected with M. tuberculosis strains H37Rv, Jal 2261, and MYC 431 at a multiplicity of infection of 10. 48 h post-infection, cells were treated with NEM-PFA, and sensor response was measured by flow cytometry. Whole-cell total glutathione (B) and GSSG (C) concentrations measured in lysates prepared from U937 cells uninfected or infected with H37Rv for 48 h. D, time course of biosensor oxidation in U937-Grx1-roGFP2 cells exposed to 50 μg surface-exposed lipids extracted from different M. tuberculosis strains. p values were calculated by one-way analysis of variance followed by Tukey's HSD statistical test. E, Gag RT-PCR of U1 cells treated with 50 μg/ml surface-exposed lipids extracted from M. tuberculosis strains H37Rv, Jal2261, and MYC 431 for 48 h. C, uninfected control in A–C, and untreated control in D and E. Error bars represent S.D. from the mean. All experiments are performed at least twice. *, p < 0.05; **, p < 0.01; C, control.
FIGURE 10.
FIGURE 10.
Expression of oxidative stress-responsive genes during HIV-1 latency. Total RNA was isolated from untreated U937, untreated U1, and PMA-treated U1 cells followed by expression analysis of 84 genes specific to oxidative stress pathways (SABiosciences qRT-PCR array profiler). Oxidative stress response-specific gene expression profiles were compared in the following groups: A, untreated U1 versus untreated U937; B, PMA-treated U1 versus untreated U1. Shown are the volcano plots displaying statistical significance versus fold-change on the y and x axes, respectively. Horizontal blue line shows the cutoff of p value (0.05) and vertical black lines depict cutoff levels for gene expression (2-fold variation). Also shown are the heat maps of differentially regulated genes in three biological replicates. The color bar depicts the level of gene expression. The data are the mean of three independent experiments.
FIGURE 11.
FIGURE 11.
Expression of oxidative stress responsive genes during reactivation. Total RNA was isolated from untreated U937, PMA-treated U937, and PMA-treated U1 cells followed by expression analysis of 84 genes specific to oxidative stress pathways (SABiosciences qRT-PCR array profiler). A, PMA-treated U937 versus untreated U937; B, PMA-treated U1 versus PMA-treated U937. Shown are the volcano plots displaying statistical significance versus fold-change on the y and x axes, respectively. Horizontal blue line shows the cutoff of p value (0.05) and vertical black lines depict cutoff levels for gene expression (2-fold variation). Also shown are the heat maps of differentially regulated genes in three biological replicates. The color bar depicts the level of gene expression.
FIGURE 12.
FIGURE 12.
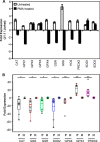
A, expression of antioxidant genes in J1.1 cells during latency and reactivation. Total RNA was isolated from untreated and PMA-treated Jurkat and J1.1 cells followed by qRT-PCR analysis of oxidative stress response-related gene expression. Shown is the fold change in gene expression in J1.1 as compared with Jurkat cells. Human β-actin is used as an internal control. The data are the mean of three independent experiments ±S.D. B, expression of oxidative stress genes in the PBMCs of HIV/AIDS patients. qRT-PCR analysis of oxidative stress response-related gene expression in PBMCs derived from HIV/AIDS patients (P, n = 8) and healthy individuals (H, n = 6). One of the healthy individuals was taken as the reference point, and human β-actin was used as an internal control. Data are expressed as a dot plot with the median, and mean and significant values are indicated on the top. Each dot on the plot represents an individual. *, p < 0.01; **, p < 0.001; CAT, catalase.
FIGURE 13.
FIGURE 13.
Oxidoreductive stress model of HIV-1 persistence and reactivation. The model suggests that increased expression of genes involved in glutathione biosynthesis, GSH-assisted H2O2 detoxification (GPXs), GSSG reduction (GR), and other cellular antioxidants together contribute toward maintenance of reductive subcellular EGSH (approximately −320 mV) and enhanced capacity to resist oxidative stress and apoptosis in the cells latently infected with HIV-1. A moderate oxidative shift in EGSH (−285 mV) induced by H2O2 or M. tuberculosis lipids reactivates HIV-1 from persistence. Active HIV-1 replication stimulated by viral proteins (Tat and Nef) or cytokines (TNF-α) generates excessive oxidative shift in EGSH (more than −240 mV), thereby promoting a further increase in transcription from HIV-1 LTR through redox-dependent transcription factors such as NFκB, and eventual progression to AIDS. The scale bar at the top denotes EGSH values. The thick green colored arrows and thin red colored arrows denote higher and lower expression, respectively. CAT, catalase.

References

    1. Perl A., Banki K. (2000) Genetic and metabolic control of the mitochondrial transmembrane potential and reactive oxygen intermediate production in HIV disease. Antioxid. Redox Signal. 2, 551–573 - PubMed
    1. Staal F. J., Roederer M., Herzenberg L. A. (1990) Intracellular thiols regulate activation of nuclear factor κB and transcription of human immunodeficiency virus. Proc. Natl. Acad. Sci. U.S.A. 87, 9943–9947 - PMC - PubMed
    1. Pyo C. W., Yang Y. L., Yoo N. K., Choi S. Y. (2008) Reactive oxygen species activate HIV long terminal repeat via post-translational control of NF-κB. Biochem. Biophys. Res. Commun. 376, 180–185 - PubMed
    1. Cummins N. W., Badley A. D. (2010) Mechanisms of HIV-associated lymphocyte apoptosis: 2010. Cell Death Dis. 1, e99. - PMC - PubMed
    1. Amarnath S., Dong L., Li J., Wu Y., Chen W. (2007) Endogenous TGF-β activation by reactive oxygen species is key to Foxp3 induction in TCR-stimulated and HIV-1-infected human CD4+CD25− T cells. Retrovirology 4, 57. - PMC - PubMed

Publication types