. 2015 May;26(5):1040-52.
doi: 10.1681/ASN.2013111202. Epub 2014 Nov 18.

Deficient Autophagy Results in Mitochondrial Dysfunction and FSGS

Affiliations

Deficient Autophagy Results in Mitochondrial Dysfunction and FSGS

Takahisa Kawakami et al. J Am Soc Nephrol. 2015 May.

Abstract

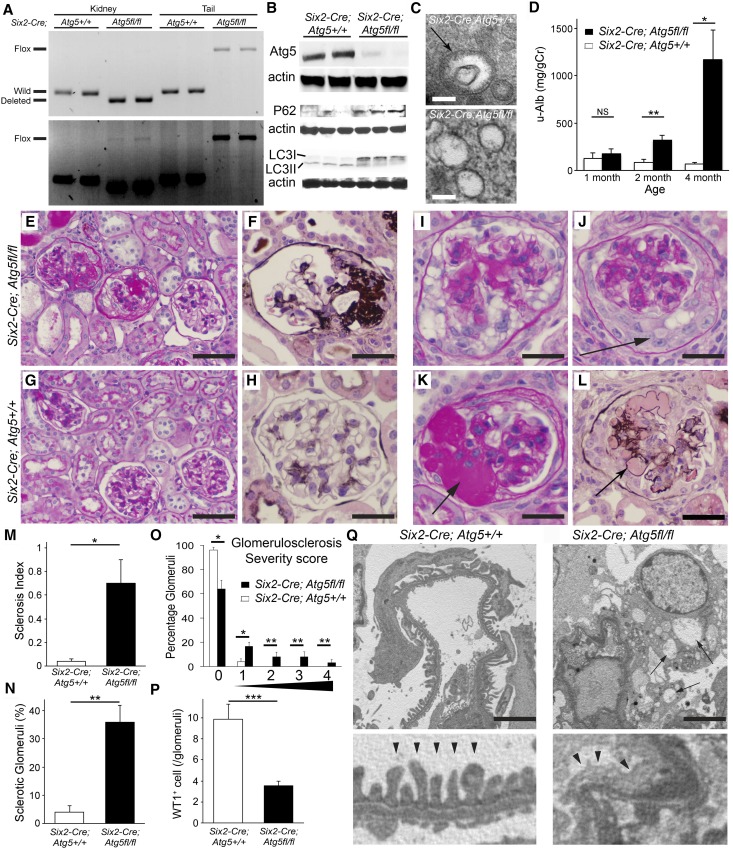
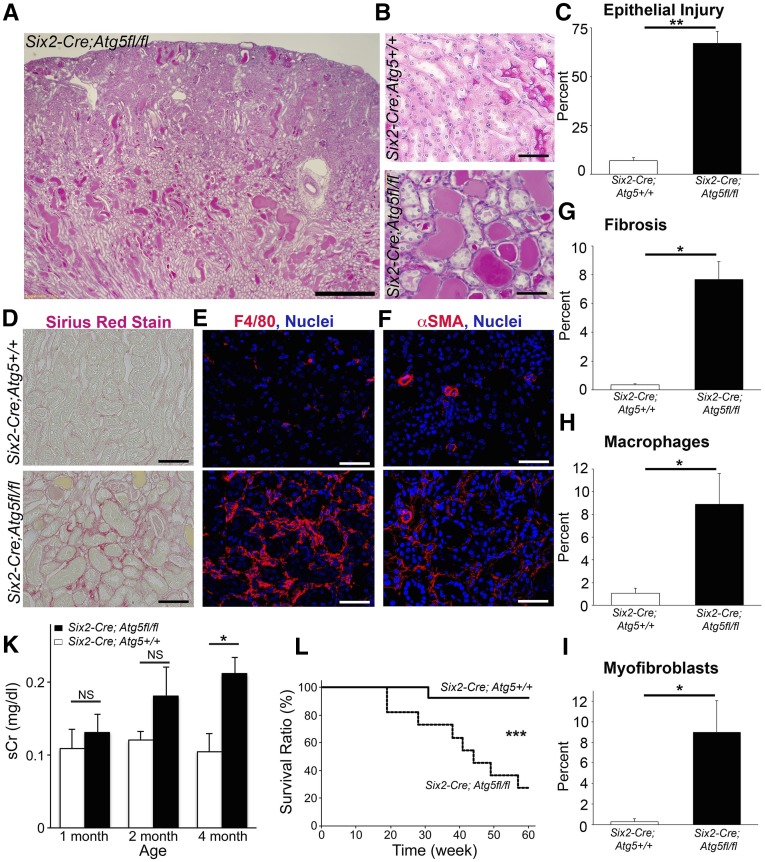
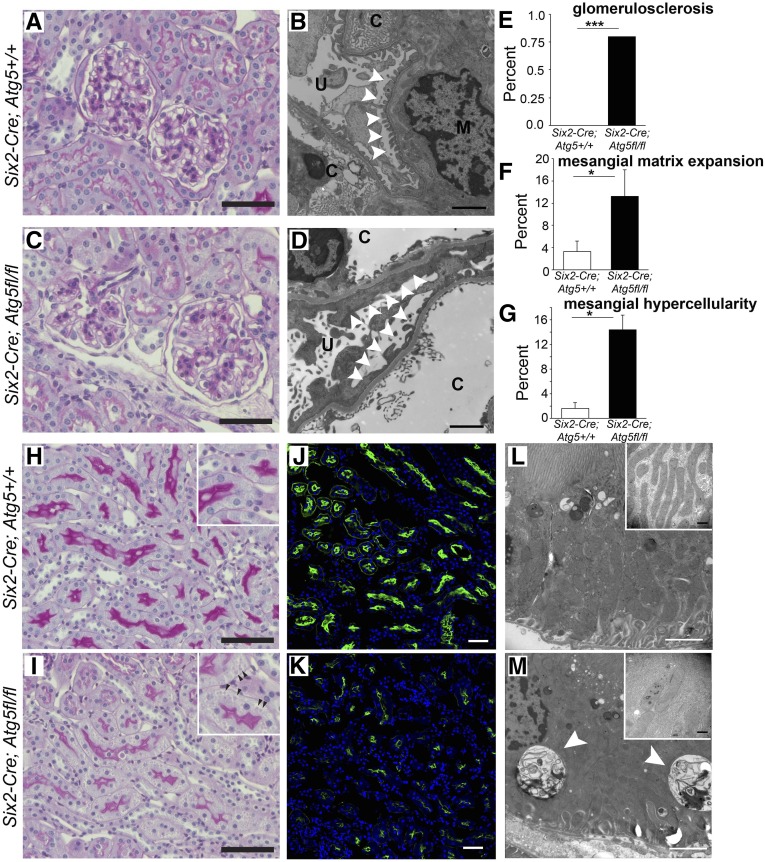
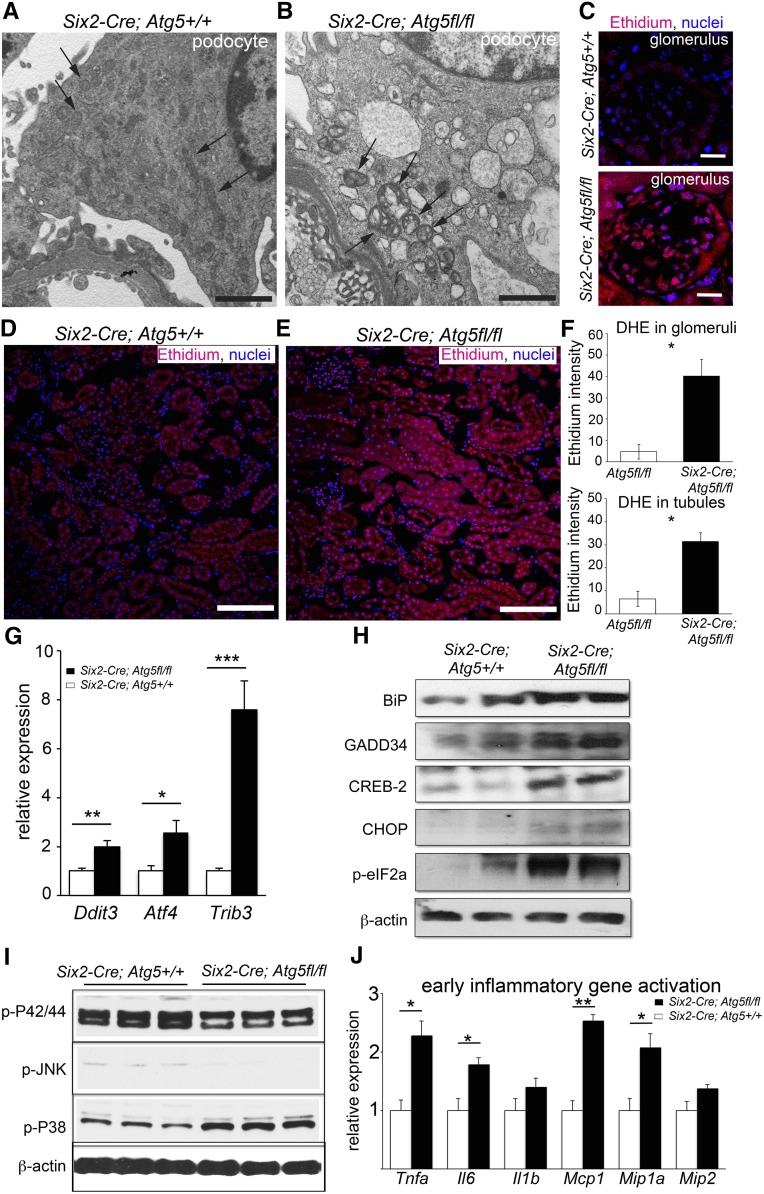
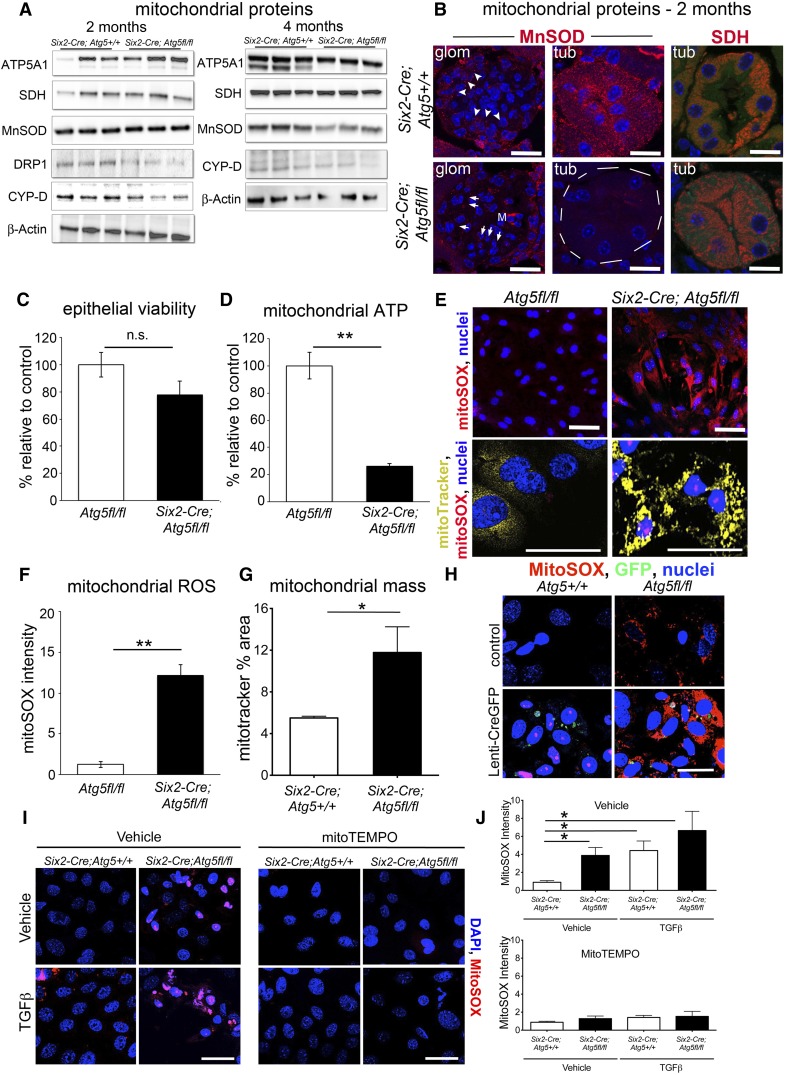
FSGS is a heterogeneous fibrosing disease of the kidney, the cause of which remains poorly understood. In most cases, there is no effective treatment to halt or retard progression to renal failure. Increasing evidence points to mitochondrial dysfunction and the generation of reactive oxygen species in the pathogenesis of CKD. Autophagy, a major intracellular lysosomal degradation system, performs homeostatic functions linked to metabolism and organelle turnover. We prevented normal autophagic pathways in nephrons of mice by mutating critical autophagy genes ATG5 or ATG7 during nephrogenesis. Mutant mice developed mild podocyte and tubular dysfunction within 2 months, profound glomerular and tubular changes bearing close similarity to human disease by 4 months, and organ failure by 6 months. Ultrastructurally, podocytes and tubular cells showed vacuolization, abnormal mitochondria, and evidence of endoplasmic reticulum stress, features that precede the appearance of histologic or clinical disease. Similar changes were observed in human idiopathic FSGS kidney biopsy specimens. Biochemical analysis of podocytes and tubules of 2-month-old mutant mice revealed elevated production of reactive oxygen species, activation of endoplasmic reticulum stress pathways, phosphorylation of p38, and mitochondrial dysfunction. Furthermore, cultured proximal tubule cells isolated from mutant mice showed marked mitochondrial dysfunction and elevated mitochondrial reactive oxygen species generation that was suppressed by a mitochondrial superoxide scavenger. We conclude that mitochondrial dysfunction and endoplasmic reticulum stress due to impaired autophagic organelle turnover in podocytes and tubular epithelium are sufficient to cause many of the manifestations of FSGS in mice.

Keywords: Autophagy; focal segmental glomerulosclerosis; mitochondria.


Figures

Figure 1.
Figure 1.
Mutation of ATG5 in kidney epithelium prevents autophagy and causes FSGS. (A) Ethidium-stained gel showing amplified PCR products of genomic DNA at the Atg5 locus to determine the genotype and deletion of floxed gene of the Atg5 locus. The upper gel represents an image with shorter exposure time, while the lower gel shows the one with longer exposure time. They indicate that in Six2-Cre; Atg5flox/flox whole kidney most genomic DNA has undergone recombination and only a small portion of DNA contains the floxed exon. (B) Western blots of whole kidney at 2 months showing deletion of ATG5 protein, increase of P62 protein, and loss of LC3II (lower band), indicative of loss autophagy in the kidney. (C) Electron microscopic images showing an autophagosome in a Six2-Cre; Atg5fl/fl kidney proximal tubule cell in (bar=100 nm). (D) Graph showing urine albumin-to-creatinine ratio in mice with time after birth. (E–H) Typical glomerular morphology at 4 months after birth, stained by periodic acid-Schiff or silver methenamine. Note the presence of segmental sclerotic lesions (fibrosis and capillary loop destruction) and focal glomerular involvement. (I–L) Examples of additional glomerular changes, including pseudocrescent formation, collapsing lesions, and hyalinosis. (M and N) Quantification of glomerulosclerosis by index or by percentage of glomeruli with sclerosis. (O) Quantification of glomerulosclerosis by severity score. (P) Quantification of WT1+ cells per glomerular cross-section. (Q) Representative electron microscopic images showing capillary loop coated with podocytes in the urinary space. Note in mutant mice that the podocytes show vacuolation (arrows) and there is wrinkling and collapse of the capillary loop structure and extensive foot process effacement (arrowheads). Data are mean±SEM. n=4–7/group. ***P<0.001; **P<0.01; *P<0.05. Bar=100 µm (E, G), 50 µm (F, H, I–L), 2.5 µm (Q).
Figure 2.
Figure 2.
Mutation of ATG5 in kidney epithelium causes tubulointerstitial disease. (A and B) Lower- and higher-power images showing the extent of tubulointerstitial disease in ATG5 mutant mice at 4 months. (C) Tubular injury score at 4 months. (D–F) Images showing interstitial fibrosis stained by sirius red, macrophage infiltration, and myofibroblast accumulation in the interstitium. (G–I) Quantification of fibrosis, macrophages, and myofibroblasts. (J) Time course of plasma creatinine levels in wild-type and mutant mice. (K) Kaplan–Meier survival curve (P<0.001 by Wilcoxon test). Data are mean±SEM. n=4–13/group. *P<0.05; **P<0.01; ***P<0.001. Bar=500 µm (A) and 100 µm (B–F).
Figure 3.
Figure 3.
Albuminuria and minor glomerular and tubular changes develop after 2 months which precede the development of FSGS. (A–D) Periodic acid-Schiff–stained light micrographs and electron microscopic images of glomerular capillary loops showing essentially normal glomeruli at 2 months in mutant and wild-type mice, but whereas wild-type podocyte foot processes show normal tertiary structures (B), electron microscopic foot process effacement is readily apparent in mutant glomeruli (D) (arrowheads) (c, capillary; u, urinary space). Bar=100 µm (periodic acid-Schiff) and 2 µm (electron microscopy). (E–G) Quantification of glomerular changes present at 2 months. (H–K) Representative images of periodic acid-Schiff–stained or LTL-fluorescein–stained kidneys showing S3 segment proximal tubules at 2 months. Note reduction in brush border intensity and loss of LTL epitope expression. Also note subtle presence of basolateral inclusion bodies in mutant mice (arrowheads in the inset). Bar=100 µm. (L and M) Electron microscopic images of proximal tubule cells showing presence of inclusions (arrowheads) in mutant cells and the changes in mitochondrial size and shape. Bar=2 µm [in insets=500 nm]). Data are mean±SEM. n=4–6/group. ***P<0.001; *P<0.05.
Figure 4.
Figure 4.
Increased ROS production and endoplasmic reticulum stress are present before the development of FSGS. (A and B) Electron microscopic images of podocytes at 4 months showing abnormal mitochondria in mutant (Six2Cre;Atg5fl/fl) podocytes (arrows) that are enlarged, are shortened, and feature loss of cristae compared with mitochondria in wild-type (Six2Cre;Atg5+/+) podocytes (arrows). Note also the presence of vacuoles in mutant podocytes. (C–F) Images and quantification of intensity of dihydroethidium-mediated fluorescence (due to oxidation to ethidium) in glomeruli and tubules showing increased levels of ROS in both compartments in mutant mice at 2 months. (G) Increased transcripts for the PERK-dependent ER stress pathway genes in mutant kidney at 2 months. (H) Western blots of proteins from whole kidneys at 2 months showing increased levels of ER-stress pathway proteins, including phospho-eIF2α. (I) Western blots of whole kidney proteins at 2 months probed for stress pathway activation showing increased levels of phospho-P38 mitogen-activated protein kinase. (J) Whole kidney cytokine transcript levels at 2 months. Bar=500 nm (A and B); 50 µm (C), and 100 µm (D and E). Data are means±SEM n=4–6/group. *** P<0.001, ** P<0.01, * P<0.05.
Figure 5.
Figure 5.
Kidney epithelium shows specific defects in mitochondrial function resulting in abnormal levels of superoxide generation. (A) Western blots showing levels of mitochondrial proteins in wild-type and mutant kidneys at 2 and 4 months. (B) Images of kidneys at 2 months showing selective loss of MnSOD in tubules and also GECs (arrowhead=expressed; arrow=reduced expression), whereas SDH expression remains in mutant tubules but basolateral cellular distribution of SDH is lost. (C and D) Viability, mitochondrial ATP generation in primary PTEC cultures from control and mutant 2-month-old kidneys. (E–G) Images and results showing mitochondrial ROS generation by mitoSOX fluorescence and mitochondrial content/morphology by mitoTracker fluorescence in live cultures of primary PTEC cultures from control and mutant 2-month-old kidneys. (H) Images of PTECs from wild-type and Atg5fl/fl kidneys 10 days after treatment with Lenti-GFP-Cre virus, labeled with mitoSOX to detect mitochondrial ROS. Successful transduction of cells to activate recombination of Atg5 at loxP sites can be detected by the presence of GFP. Note only Atg5fl/fl cells that have undergone recombination produce high levels of mitochondrial ROS. (I and J) Images and quantification of mitochondrial ROS generation in wild-type and mutant PTECs from 2-month-old kidneys showing spontaneous ant TGF-β–induced ROS generation, which is completely inhibited by incubation of mitoTEMPO. Bar=25 µm. Data are mean±SEM. n=3–6/group. **P<0.01; *P<0.05.

Comment in

References

    1. Löwik MM, Groenen PJ, Levtchenko EN, Monnens LA, van den Heuvel LP: Molecular genetic analysis of podocyte genes in focal segmental glomerulosclerosis—a review. Eur J Pediatr 168: 1291–1304, 2009 - PMC - PubMed
    1. Pollak MR: The Genetic Basis of FSGS and Steroid-Resistant Nephrosis. Seminars in Nephrology, New York, Elsevier, 2003, pp 141–146 - PubMed
    1. Genovese G, Friedman DJ, Ross MD, Lecordier L, Uzureau P, Freedman BI, Bowden DW, Langefeld CD, Oleksyk TK, Uscinski Knob AL, Bernhardy AJ, Hicks PJ, Nelson GW, Vanhollebeke B, Winkler CA, Kopp JB, Pays E, Pollak MR: Association of trypanolytic ApoL1 variants with kidney disease in African Americans. Science 329: 841–845, 2010 - PMC - PubMed
    1. McVicar M, Exeni R, Susin M: Nephrotic syndrome and multiple tubular defects in children: an early sign of focal segmental glomerulosclerosis. J Pediatr 97: 918–922, 1980 - PubMed
    1. Chau BN, Xin C, Hartner J, Ren S, Castano AP, Linn G, Li J, Tran PT, Kaimal V, Huang X: MicroRNA-21 promotes fibrosis of the kidney by silencing metabolic pathways. Sci Translat Med 4: 121ra118–121ra118, 2012. - PMC - PubMed

Publication types

MeSH terms