. 2014 Nov 18;7(352):ra109.
doi: 10.1126/scisignal.2005450.

Two-pore channels provide insight into the evolution of voltage-gated Ca2+ and Na+ channels

Affiliations

Two-pore channels provide insight into the evolution of voltage-gated Ca2+ and Na+ channels

Taufiq Rahman et al. Sci Signal. .

Abstract

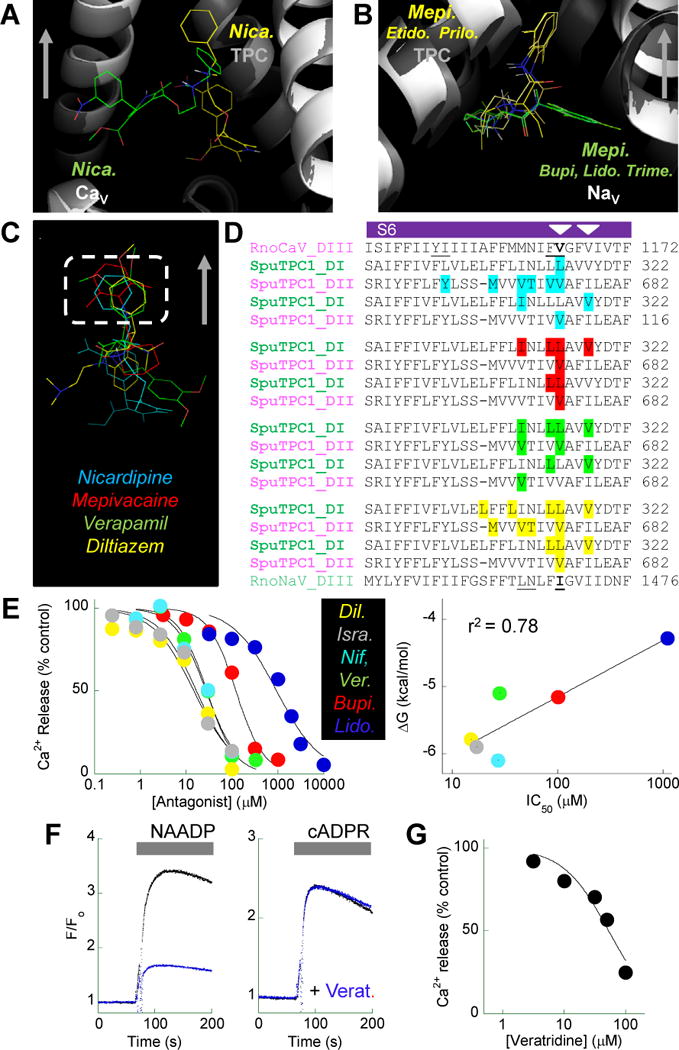
Four-domain voltage-gated Ca(2+) and Na(+) channels (CaV, NaV) underpin nervous system function and likely emerged upon intragenic duplication of a primordial two-domain precursor. To investigate if two-pore channels (TPCs) may represent an intermediate in this evolutionary transition, we performed molecular docking simulations with a homology model of TPC1, which suggested that the pore region could bind antagonists of CaV or NaV. CaV or NaV antagonists blocked NAADP (nicotinic acid adenine dinucleotide phosphate)-evoked Ca(2+) signals in sea urchin egg preparations and in intact cells that overexpressed TPC1. By sequence analysis and inspection of the model, we predicted a noncanonical selectivity filter in animal TPCs in which the carbonyl groups of conserved asparagine residues are positioned to coordinate cations. In contrast, a distinct clade of TPCs [TPCR (for TPC-related)] in several unicellular species had ion selectivity filters with acidic residues more akin to CaV. TPCRs were predicted to interact strongly with CaV antagonists. Our data suggest that acquisition of a "blueprint" pharmacological profile and changes in ion selectivity within four-domain voltage-gated ion channels may have predated intragenic duplication of an ancient two-domain ancestor.


Figures

Fig. 1
Fig. 1. Domain phylogeny of multidomain, voltage-gated ion channels
A, Schematic showing architecture of four-domain CaVs and Navs (top) and two-domain TPCs (bottom). Each domain (DI-DIV) comprises six transmembrane regions (S1–S6, numbered). S1–S4 form the voltage-sensing domain (VSD) and S5–S6 form the pore (P). Arrows depict the direction of ion flow into the cytosol from either the extracellular space (CaV and NaV) or from the lumen of acidic organelles (TPC). B, Unrooted maximum likelihood tree constructed using sequences of individual domains of TPCs, CaVs, and NaVs from representative members of the chordate, cephalachordate, echinoderm, and cnidarian phyla. Species used were Homo sapiens (Hsa), the sea squirt Ciona intestinalis (Cin), the sea urchin Stronglylocentrotus purpuratus (Spu), and the starlet sea anemone Nematostella vectensis (Nve). Accession numbers are listed in Table S1. Bootstrap values at the basal branches are shown. All other values were 40–100. Similar domains inferred from the phylogenetic relationships are shaded green (I and III) and pink (II and IV) in B, and connected by the colored lines in A.
Fig. 2
Fig. 2. A structural model of the TPC pore
A, Structure-based alignment of the pore regions of human (Hsa) and sea urchin (Spu) TPCs (outlined with dashes in schematic) with prokaryotic NaVs from Arcobacter butzleri (Abu) and Rickettsiales sp. HIMB114 (Rhi). Positions of S5 and S6 in NaVs are indicated with the purple bars, the intervening turret region with a grey bar, the first (PH1) and second (PH2) pore helices with green bars, and the selectivity filter (SF) with a yellow bar. Large insertions within the corresponding turret regions of TPCs (ˆ) were omitted from the alignment for clarity. Residues that coordinate cations in NaV are shaded cyan. Conserved asparagine residues in TPCs within the selectivity filter are yellow. Black shading indicates sequence identity and gray indicates conserved substitution. B, Homology model of the pore of sea urchin TPC1 in side (left), cytosolic (middle), and luminal (right) orientations. Side views are depicted in an upright (as opposed to inverted) “tepee” fashion to reflect their organellar (as opposed to plasma membrane) subcellular localization.
Fig. 3
Fig. 3. Interaction of CaV antagonists with TPC
(A–C) Docking of a series of 8 dihydropyridines (DHP) to the pore of TPC (A), CaV (B), and NaV (C) depicted in either side (left) or cytosolic (middle) orientations. Gray arrows depict the direction of ion flow. Right panel shows poses for all ligands represented by the gray mesh (cytosolic view) with the indicated select ligands highlighted in yellow or green. White arrows mark the interfaces between DIII–DIV (in Cav) and DII–DIII (Nav). D, Overlay (upper panel) of dihydropyridine poses in mesh representation for TPC, CaV, and NaV. Plot (lower panel) shows ΔG values for docking of ligands to the three channel types. The closed symbols are values for nifedipine. (E). Docking of verapamil and diltiazem to the TPC pore (F). Ca2+ signals recorded from sea urchin egg homogenates stimulated with 1 μM NAADP in the absence (black traces) or presence (colored traces) of 100 μM nifedipine (Nif.), isradipine (Isra.), verapamil (Vera.), or diltiazem (Dil.). Data are representative of 3 experiments.
Fig. 4
Fig. 4. Interaction of NaV antagonists with TPC
A, Docking of a series of 10 local anaesthetics (LA) to the pore of TPC depicted in either side (left) or cytosolic (middle) orientation. Arrow depicts the direction of ion flow. Right panel shows poses for all ligands represented by the grey mesh (cytosolic view), with lidocaine highlighted in yellow. B, Representative Ca2+ signals recorded from sea urchin egg homogenates stimulated with 1 μM NAADP or 5 μM cyclic ADP-ribose in the absence (black traces) or presence of 3 mM lidocaine (blue traces) or 1 mM bupivacaine (gray traces). C, Pooled data (mean ± s.e.m. of 3 independent experiments) quantifying the effect of NaV antagonists on NAADP- and cADPR-induced Ca2+ release. D, Inhibition curve showing concentration-dependent block of NAADP responses by lidocaine (blue) and bupivacaine (gray).
Fig. 5
Fig. 5. Comparison of CaV and NaV antagonist docking
A–B, Zoomed views comparing docking of CaV (A) and NaV (B) antagonists to TPC (grey ribbons) and their cognate four domain channels (white ribbons). Ligands are colored yellow for docking to TPCs and green for docking to CaV and NaV. Arrows depict the direction of ion flow. Nica., nicardipine; Mepi., mepivacaine; Etido., etidocaine; Prilo., prilocaine; Bupi., bupivacaine; Lido., lidocaine; Trime., trimecaine. C, Overlay of poses for the indicated CaV and NaV antagonists docked to TPC. Dashed box highlights congruent nature of poses. Arrow depicts the direction of ion flow through TPC. D, Interacting residues within the S6 regions of DI and DII of TPC for the ligands in C (same color code). Arrowheads highlight residues implicated in interaction of both CaV and NaV antagonists. Known molecular determinants for interactions of phenylalkylamines with rat CaV2.1 and local anaesthetics and anticonvulsants with rat Nav2.1 are underlined in the corresponding S6 sequences of DIII (RnoCaV, RnoNaV). E, Inhibition curves (left) showing concentration-dependent bock of NAADP-induced Ca2+ release from sea urchin egg homogenates by the indicated ligands. Plot (right) showing correlation of the half-maximal inhibitory concentrations (IC50) in Ca2+-release assays for CaV and NaV antagonists with their predicted ΔG values for docking. F, Representative Ca2+ signals recorded from sea urchin egg homogenates stimulated with 1 μM NAADP or 5 μM cyclic ADP-ribose in the absence (black traces) or presence of 100 μM veratridine (Verat., blue traces). G, Inhibition curve showing concentration-dependent block of NAADP responses by veratridine (IC50 = 52 μM, n=2).
Fig. 6
Fig. 6. Effect of CaV and NaV modifiers on recombinant TPC1
Cytosolic Ca2+ signals from individual fura-2-loaded SKBR3 cells that were microinjected with NAADP. A, Responses in mock-transfected cells (blue trace) or cells transiently expressing recombinant sea urchin TPC1 (black traces). B, Responses in TPC1-expressing cells pre-incubated for 1 h with increasing concentrations nifedipine (Nif.). Concentrations used (from top to bottom) were 0.1, 1, 10, and 100 μM. C, Inhibition curve showing concentration-dependent block of NAADP responses by nifedipine. D, Responses in TPC1-expressing cells pre-incubated for 1 h with lidocaine (Lido. 100 μM) or veratridine (Verat. 100 μM). Results are means ± s.e.m. of 6 cells from 3 independent transfections.
Fig. 7
Fig. 7. Properties of TPCs from unicellular organisms
A, Zoomed view of the TPC pore showing the presence of conserved asparagine residues positioned within the putative selectivity filter to coordinate cations. B, Evolutionary relationships of unicellular organisms in the lineages leading to metazoans (animals). The number of identified TPCs in each of the species is shown in the boxes. C, Cladogram of TPC sequences of representative metazoans (Hsa, human; Spu, sea urchin; shaded), choanoflagellates (Mbr, Monosiga brevicollis; Sro, Salpingoeca rosetta), and basal species (Cow, Capsaspora owczarzaki; Ttr, Thecamonas trahens). Accession numbers are listed in table S2. CaV was used as the out-group (accession EGD78396.1). Bootstrap values were 81–100 except where indicated (*23–78). A previously unreported grouping (TPCR) is highlighted by the dashed box. Sequences of the putative selectivity filters are shown to the right. Acidic (Asp, Glu; yellow) and polar (Ser; cyan) residues are shaded. D, Interaction of dihydropyridines with TPCR. Docking of a series of 8 dihydropyridines to the pore of TPCR (top) and TPC (bottom) from Salpingoeca rosetta depicted in cytosolic orientations. White arrow marks an interface between DI and DII.

References

    1. Yu FH, Yarov-Yarovoy V, Gutman GA, Catterall WA. Pharmacol Rev. 2005;57:387. - PubMed
    1. Hille B. Ionic channels of excitable membranes. 1. Sinauer Associates; Sunderland, Massachusets: 1984.
    1. Ryan DP, Ptacek LJ. Neuron. 2010;68:282. - PubMed
    1. Savio-Galimberti E, Gollob MH, Darbar D. Front Pharmacol. 2012;3:124. - PMC - PubMed
    1. Cain SM, Snutch TP. Biofactors. 2011;37:197. - PubMed

Publication types

LinkOut - more resources