. 2014 Dec;141(23):4489-99.
doi: 10.1242/dev.107193. Epub 2014 Nov 18.

Excessive vascular sprouting underlies cerebral hemorrhage in mice lacking αVβ8-TGFβ signaling in the brain

Affiliations

Excessive vascular sprouting underlies cerebral hemorrhage in mice lacking αVβ8-TGFβ signaling in the brain

Thomas D Arnold et al. Development. 2014 Dec.

Abstract

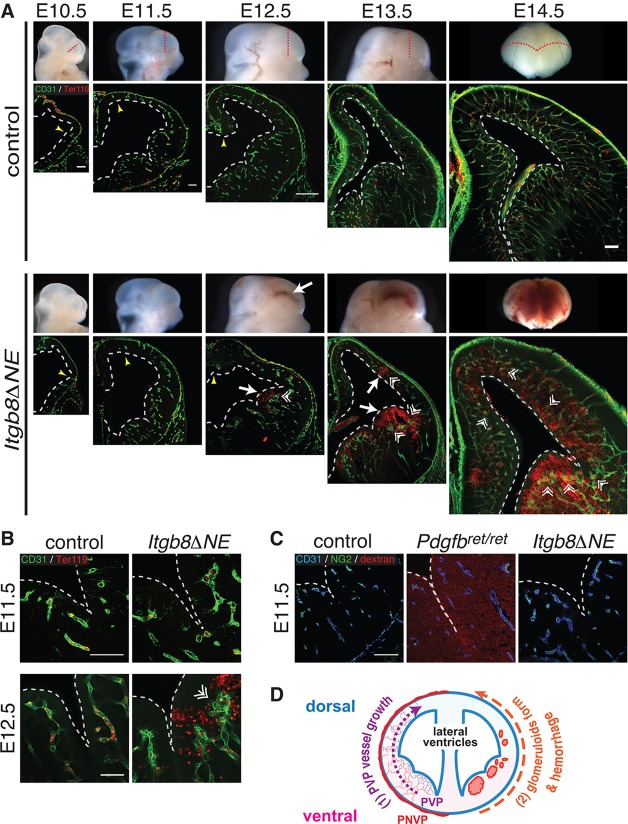
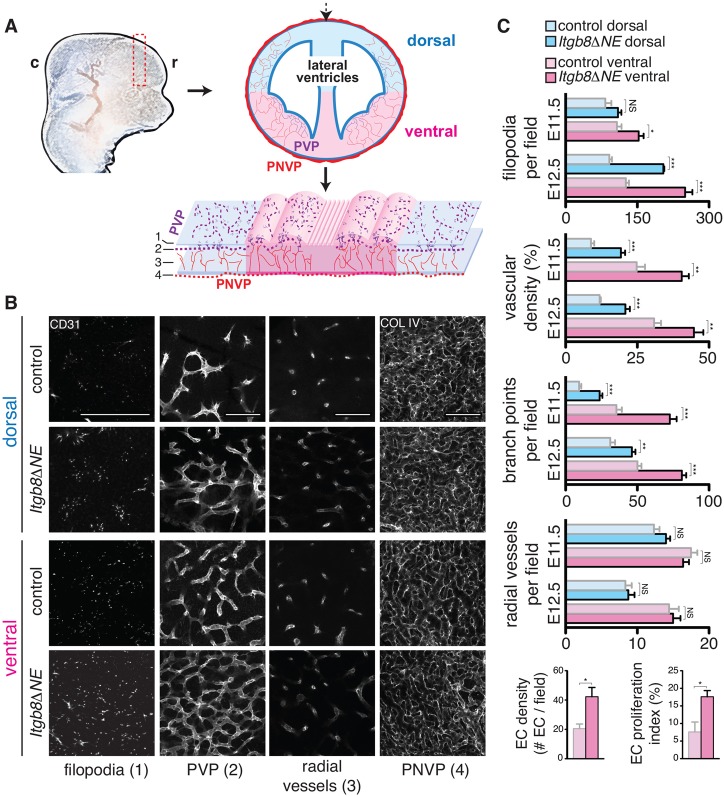
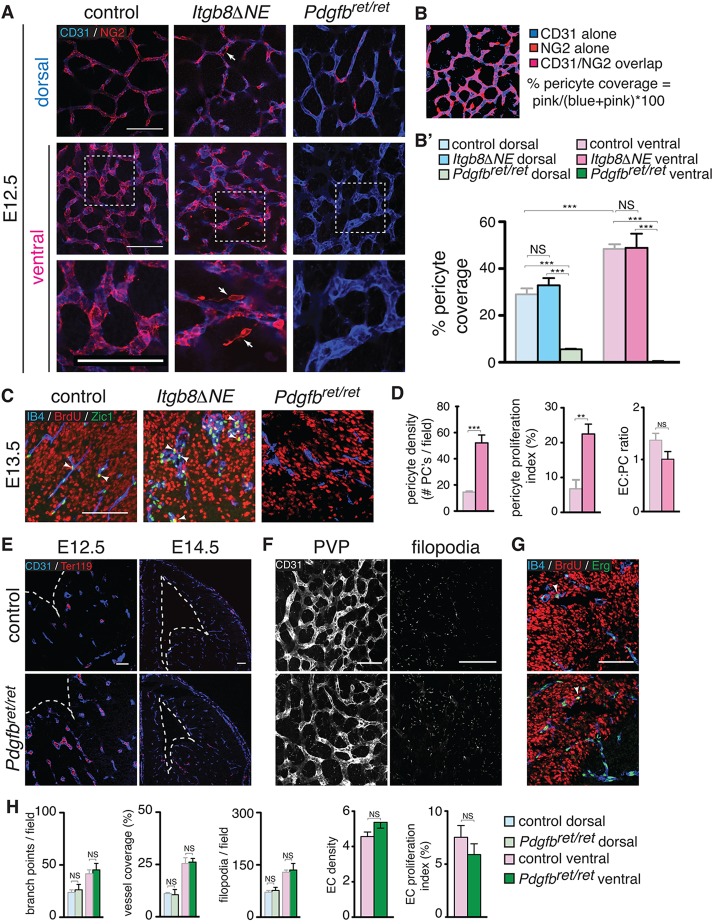
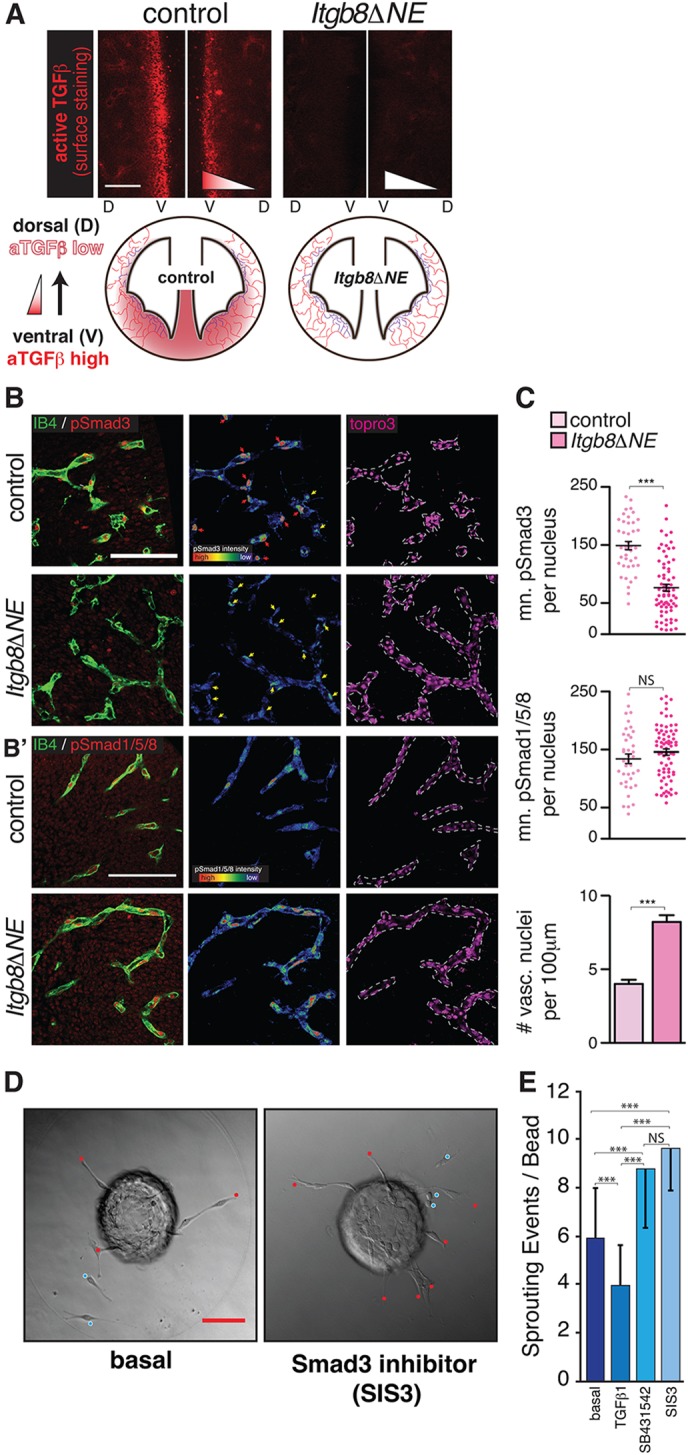
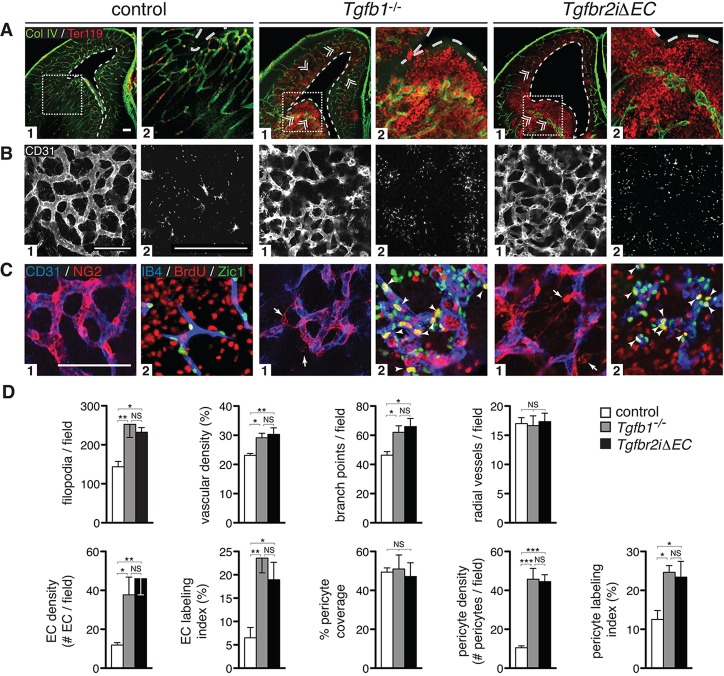
Vascular development of the central nervous system and blood-brain barrier (BBB) induction are closely linked processes. The role of factors that promote endothelial sprouting and vascular leak, such as vascular endothelial growth factor A, are well described, but the factors that suppress angiogenic sprouting and their impact on the BBB are poorly understood. Here, we show that integrin αVβ8 activates angiosuppressive TGFβ gradients in the brain, which inhibit endothelial cell sprouting. Loss of αVβ8 in the brain or downstream TGFβ1-TGFBR2-ALK5-Smad3 signaling in endothelial cells increases vascular sprouting, branching and proliferation, leading to vascular dysplasia and hemorrhage. Importantly, BBB function in Itgb8 mutants is intact during early stages of vascular dysgenesis before hemorrhage. By contrast, Pdgfb(ret/ret) mice, which exhibit severe BBB disruption and vascular leak due to pericyte deficiency, have comparatively normal vascular morphogenesis and do not exhibit brain hemorrhage. Our data therefore suggest that abnormal vascular sprouting and patterning, not BBB dysfunction, underlie developmental cerebral hemorrhage.

Keywords: Angiogenesis; Brain; CNS; Hemorrhage; Integrin αVβ8; Mouse; Sprouting; TGFβ.


Figures

Fig. 1.
Fig. 1.
Vascular dysplasia and hemorrhage in brains of neuroepithelial-specific Itgb8 (Itgb8ΔNE) mutants. (A) Coronal sections (dotted red lines) of E10.5-E14.5 brains with labeling of endothelial (CD31, green) and red blood cells (Ter119, red). (B) Higher magnification images at E11.5 and E12.5. At E10.5, pia-associated vessels outside the CNS (PNVP) surround the developing forebrain in control and mutant. Yellow arrowheads at E10.5-E12.5 indicate the dorsal limits of neuroepithelium invasion by the PVP. Initial PVP formation and dorsal invasion occur normally in mutants. At E11.5, PVP vessels appear thicker and more tortuous in mutants versus controls. In mutants, hemorrhage (white arrows) is first observed ventrally at E12.5 and later in more dorsal regions (E13.5, E14.5). Also, note enlargement of the lateral ventricles (dashed white lines) in mutants versus controls. At E12.5 in the ventral telencephalon, the mutant vasculature forms large glomeruloid malformations (double arrowheads) near sites of hemorrhage. At E13.5 and E14.5, similar malformations are observed in the dorsal telencephalon coincident with hemorrhage. N>4. (C) Vascular barrier function is intact before hemorrhage in Itgb8ΔNE embryos following trans-cardiac perfusion of 70 kDa dextran-TMR tracer (CD31-endothelium, blue; NG2-pericytes, green) and tracer (red). Pericyte-deficient Pdgfbret/ret mice (middle panel) provided a positive control. N>4. Scale bars: 250 μm. (D) Diagram illustrating PVP development: (1) PVP vessels ingress from the PNVP to the subventricular zone and then expand dorsally over time (2) in association with glomeruloid malformation and hemorrhage appearance in mutants.
Fig. 2.
Fig. 2.
Increased vascular sprouting and branching before hemorrhage in Itgb8ΔNE mutants. (A) Diagram illustrating neuroepithelial flat-mounts used to analyze vascular sprouting and branching in the telencephalon. c, caudal; r, rostral. (B) E11.5 coronal sections (dashed red rectangle in A) were immunostained, cut dorsally (dashed black arrow in A) and flattened. Vessels were visualized at depths (1-4) indicated in bottom panel of A: (1) vascular filopodia extending to the ventricular surface, (2) PVP in the subventricular zone, (3) radial sprouts from the PNVP leading to PVP vessels and (4) pia-associated PNVP. Images illustrate increased densities of endothelial cell filopodia, vascular branch points and total vascular coverage in mutants versus controls (see supplementary material Movies 1 and 2). The number of radial sprouts (3) and the appearance/organization of the PNVP (4) appear similar in both. Scale bars: 100 μm. (C) Quantitative analysis of E11.5 and E12.5 flat-mounts (images not shown): filopodia number/field, vascular density, vessel branch points/field, radial vessels connecting PNVP to PVP per field. Endothelial cell number (Erg+ endothelial nuclei per 100 μm vascular length) and endothelial proliferation index (percentage of Erg+ nuclei labeled by BrdU; see supplementary material Fig. S2). Quantification reveals spatio-temporal PVP sprouting and branching angiogenesis gradients in controls with increased vascular sprouting, and branching and endothelial proliferation in mutants before and with hemorrhage. P-values from Student's t-test: *P<0.05, **P<0.005, ***P<0.0005; NS, not significant. N=4 controls, four mutants per time point. Error bars indicate s.e.m.
Fig. 3.
Fig. 3.
Pericyte density, proliferation and detachment co-incident with hemorrhage in Itgb8ΔNE mutants. (A) Endothelium (CD31, blue) and pericyte (NG2, red) staining of dorsal and ventral PVPs in E12.5 mutants and littermate control flat-mounts. Pericyte coverage in dorsal and ventral regions is similar in mutants versus controls with significantly higher coverage in ventral regions. Higher magnification insets are indicated by dashed boxes in center panels and are shown in bottom panels. They depict pericyte detachment from the endothelium in mutants (arrows). Pdgfbret/ret mutants (which lack pericytes) provided a negative control. (B) Example of data and method used to quantify pericyte coverage (see Materials and Methods). (B′) Quantitative assessment of pericyte coverage in control, Itgb8ΔNE and Pdgfbret/ret telencephalon at E12.5. N=4 for each genotype. (C) Quantification of pericyte proliferation at 2 h. BrdU pulse. Proliferating cells (BrdU, red), endothelia (isolectin B4, blue) and pericytes (Zic1, green). Arrowheads depict BrdU/Zic1 double-positive cells. (D) Quantitation of pericyte density, proliferation and endothelial:pericyte cell ratio in control and mutants. Pdgfbret/ret mutant mice (no pericytes in ventral forebrain at this time point) provide a negative control. Pericyte density, proliferation and detachment appear normal in the mutant at time points before hemorrhage (not shown). N=4 controls, 4 mutants. (E) Absence of hemorrhage in Pdgfbret/ret mutants at E12.5 and E14.5 [vascular endothelial cells (anti-CD31, blue); red blood cells (Ter119, red)]. (F) Flat-mounts from E12.5 Pdgfbret/ret mice with endothelial cells (CD31, white) imaged at the PVP and filopodia levels (levels 2 and 1, respectively, of Fig. 2 diagram) reveal comparatively normal angiogenic patterning and filopodial extension in pericyte-deficient mice. (G) Co-staining for BrdU and Erg reveals no difference in endothelial cell number or proliferation in E12.5 Pdgfbret/ret mutants. (H) Quantitation of angiogenesis at E12.5 indicates that endothelial cell, vascular branch point and filopodial densities are similar in controls and Pdgfbret/ret mutants. Vascular coverage and endothelial cell proliferation are also normal in mutants. N=4 controls, 4 mutants. P-values from Student's t-test: **P<0.005, ***P<0.0005; NS, not significant. Error bars indicate s.e.m. Scale bars: 100 μm.
Fig. 4.
Fig. 4.
Reduced active TGFβ and phosphorylated-Smad3 in mutant neuroepithelium and vasculature. (A) Surface expression at E11.5 of active TGFβ (aTGFβ, red) in control and mutant. In controls, active TGFβ levels are highest at the ventral midline (V). In mutants, active TGFβ levels are strikingly reduced. Schematic illustrates the distributions of active TGFβ in control and mutant at E11.5. (B,B′) Left panels: representative sections from E11.5 ventral midline region, illustrating (B) pSmad3 (red) or (B′) pSmad1/5/8 (red) colocalization with the endothelial marker IB4 (green) in control and mutant. Middle panels: intensity maps of pSmad within IB4-expressing cell nuclei (red is ∼50-fold more intense than blue). There are significantly more vascular nuclei with high concentrations of pSmad3 (red arrows) in the controls than in mutants. Yellow arrows indicate vascular nuclei with low pSmad3. By contrast, there is no difference in the density of vascular nuclei expressing high pSmad1/5/8 in mutants versus controls. Right panels indicate TO-PRO-3-stained nuclei within the endothelium, as identified by IB4 labeling (dashed lines). (C) Quantification of pSmad3 and pSmad1/5/8 intensity within individual endothelial nuclei (arbitrary units) documents a significant reduction in vascular-specific pSmad3, but no change in pSmad1/5/8, in mutants versus controls. The number of vascular nuclei per unit vascular length is significantly increased, approximately twofold in the mutants. Error bars indicate s.e.m. N=4 controls, 4 mutants. (D) Representative images of MS-1 cell-coated beads cultured in fibrin gels under basal conditions (left) and in the presence of the Smad-3 inhibitor SIS3 (right). Sprouts (endothelial cells contacting bead, red dots) and scattered cells (endothelial cell sprouts not contacting bead, blue dots) represent individual sprouting events, quantified in E; N=81 (basal), 73 (TGFβ1), 56 (SB431542) and 59 (Sis3) total beads quantified. TGFβ1 results in reduced sprouting; the Smad3 inhibitor SIS3 or the more general TGFβ inhibitor SB431542 enhance sprouting. Values are mean±s.d. P-values from Student's t-test, ***P<0.0001. Scale bars: 100 μm.
Fig. 5.
Fig. 5.
Vascular hypersprouting and hemorrhage due to absence of TGFβ or endothelial cell-specific deletion of Tgfbr2. (A) E14.5 coronal forebrain sections. Labeling of vessels (Col IV, green) and red blood cells (Ter119, red) reveals diffuse hemorrhage and vascular malformations (glomeruloid bodies, double arrowheads) in Tgfb1−/− and endothelial cell-specific Tgfbr2 (Tgfbr2iΔEC) mutants, but not in controls. A2 images are higher magnification insets of boxed regions. Note ventricular dilation (dotted white lines) in Tgfb1−/− and Tgfbr2iΔEC mutants versus controls. (B) Flat-mounts of telencephalon were stained for vessels (CD31, white) after which the PVP (B1) and brain parenchyma below containing filopodia (B2) were imaged (corresponding to levels 2 and 1, respectively, in Fig. 2A schematic). Images illustrate pronounced increases in vasculature, vascular branch point and filopodial densities in Tgfb1−/− and Tgfbr2iΔEC mutants. C1 images: Flat-mounts of telencephalon stained for endothelium (anti-CD31, blue) and pericytes (NG2, red). Panels reveal defects in association of pericytes with the vasculature in Tgfb1−/− and Tgfbr2iΔEC mutants. C2 images: Sections stained for pericyte nuclei (Zic1, green), proliferating cells (BrdU, red) and vessels (IB4, blue). Images reveal increased pericyte density and proliferation (arrowheads mark BrdU+Zic1+ nuclei) in ventral brain regions of mutants. (D) Data quantification: Results show statistically significant increases in the number of filopodia/field, vascular density, vessel branch points/field, radial vessels/field and densities and proliferation of endothelial cells and pericytes in mutants. Vascular coverage with pericytes appears normal in each mutant versus controls (as described in Fig. 3; see also supplementary material Fig. S4). ANOVA P-values: *P<0.05, **P<0.005, ***P<0.0005; NS, not significant; N=8 (combined controls), N=4 (Tgfb1−/−, Tgfbr2iΔEC). Error bars indicate s.e.m. Scale bars: 100 μm.

References

    1. Abramsson A., Lindblom P. and Betsholtz C. (2003). Endothelial and nonendothelial sources of PDGF-B regulate pericyte recruitment and influence vascular pattern formation in tumors. J. Clin. Invest. 112, 1142-1151 10.1172/JCI200318549 - DOI - PMC - PubMed
    1. Allinson K. R., Lee H. S., Fruttiger M., McCarty J. and Arthur H. M. (2012). Endothelial expression of TGFβ type II receptor is required to maintain vascular integrity during postnatal development of the central nervous system. PLoS ONE 7, e39336 10.1371/journal.pone.0039336 - DOI - PMC - PubMed
    1. Anderson K. D., Pan L., Yang X.-M., Hughes V. C., Walls J. R., Dominguez M. G., Simmons M. V., Burfeind P., Xue Y., Wei Y. et al. (2011). Angiogenic sprouting into neural tissue requires Gpr124, an orphan G protein-coupled receptor. Proc. Natl. Acad. Sci. USA 108, 2807-2812 10.1073/pnas.1019761108 - DOI - PMC - PubMed
    1. Armulik A., Abramsson A. and Betsholtz C. (2005). Endothelial/pericyte interactions. Circ. Res. 97, 512-523 10.1161/01.RES.0000182903.16652.d7 - DOI - PubMed
    1. Armulik A., Genové G., Mäe, M., Nisancioglu M. H., Wallgard E., Niaudet C., He L., Norlin J., Lindblom P., Strittmatter K. et al. (2010). Pericytes regulate the blood-brain barrier. Nature 468, 557-561 10.1038/nature09522 - DOI - PubMed

Publication types

LinkOut - more resources