. 2015 Mar;35(3):392-401.
doi: 10.1038/jcbfm.2014.200. Epub 2014 Nov 19.

3D GRASE pulsed arterial spin labeling at multiple inflow times in patients with long arterial transit times: comparison with dynamic susceptibility-weighted contrast-enhanced MRI at 3 Tesla

Affiliations

3D GRASE pulsed arterial spin labeling at multiple inflow times in patients with long arterial transit times: comparison with dynamic susceptibility-weighted contrast-enhanced MRI at 3 Tesla

Steve Z Martin et al. J Cereb Blood Flow Metab. 2015 Mar.

Abstract

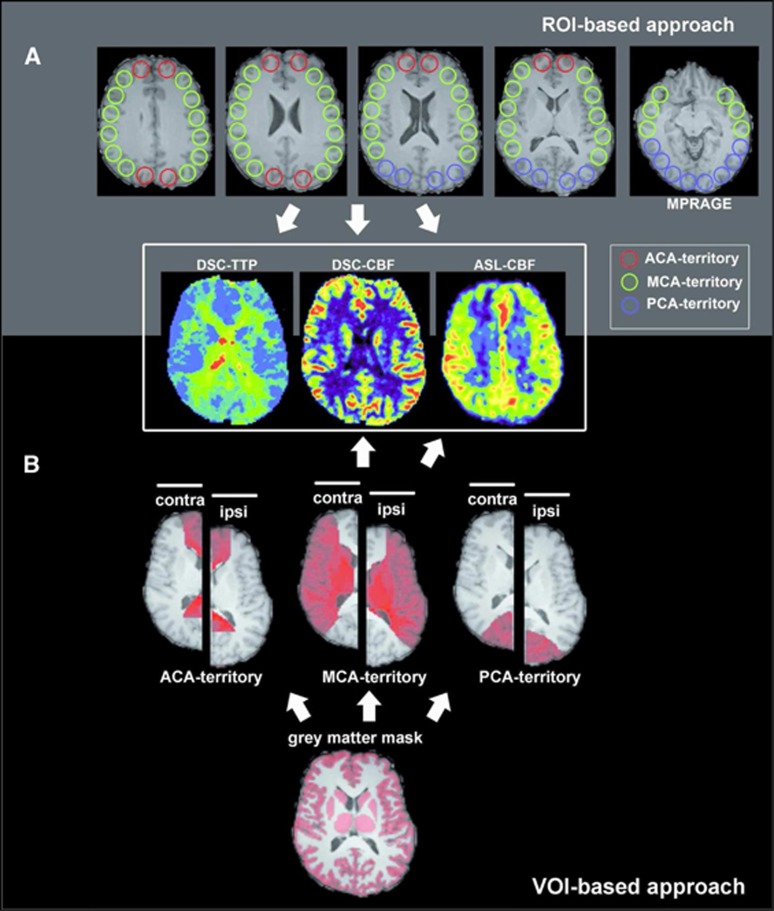
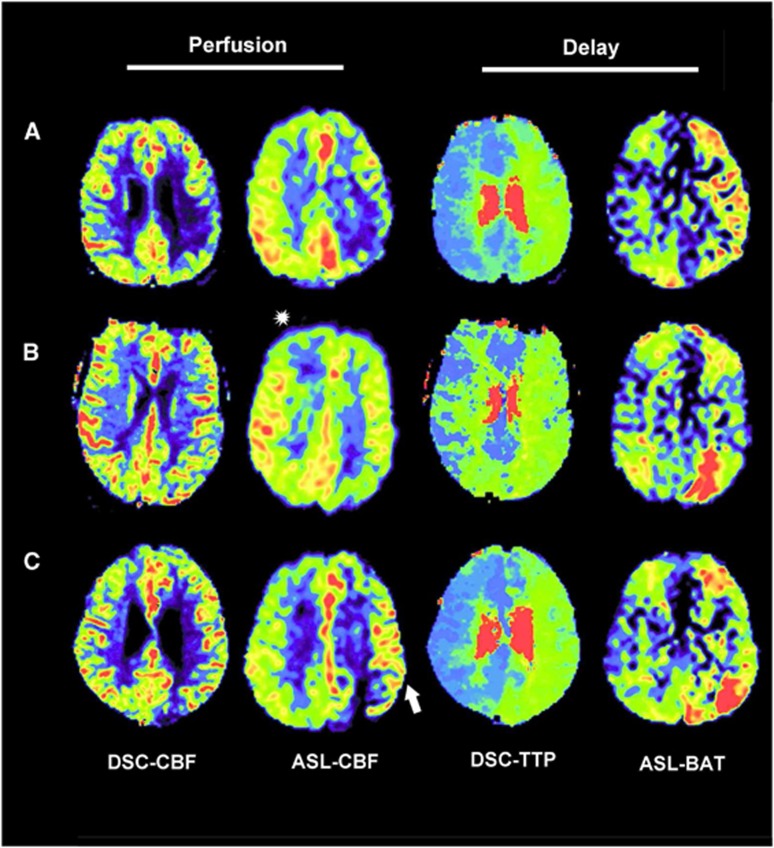
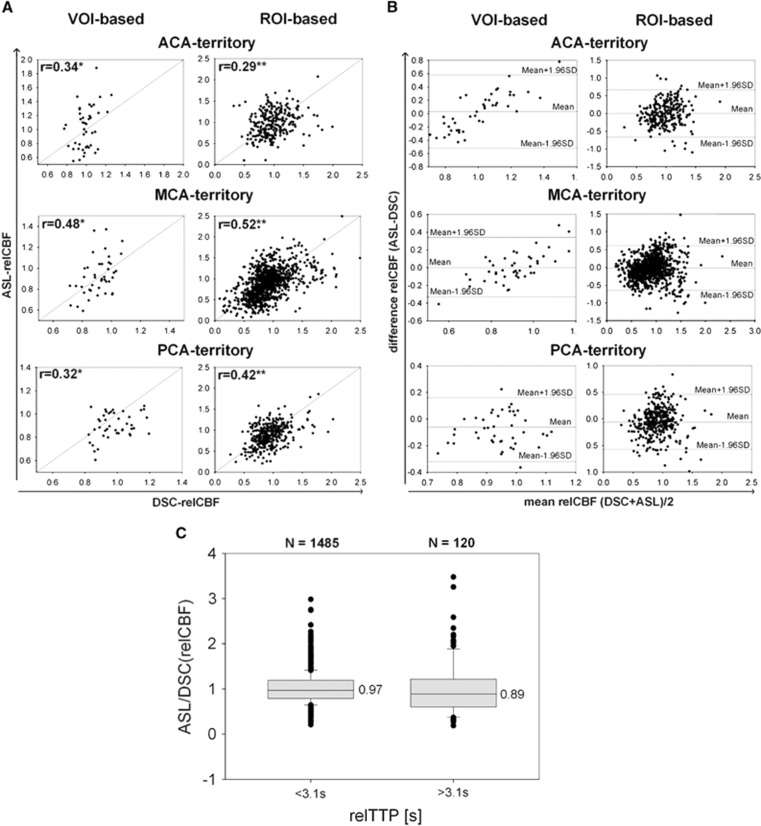
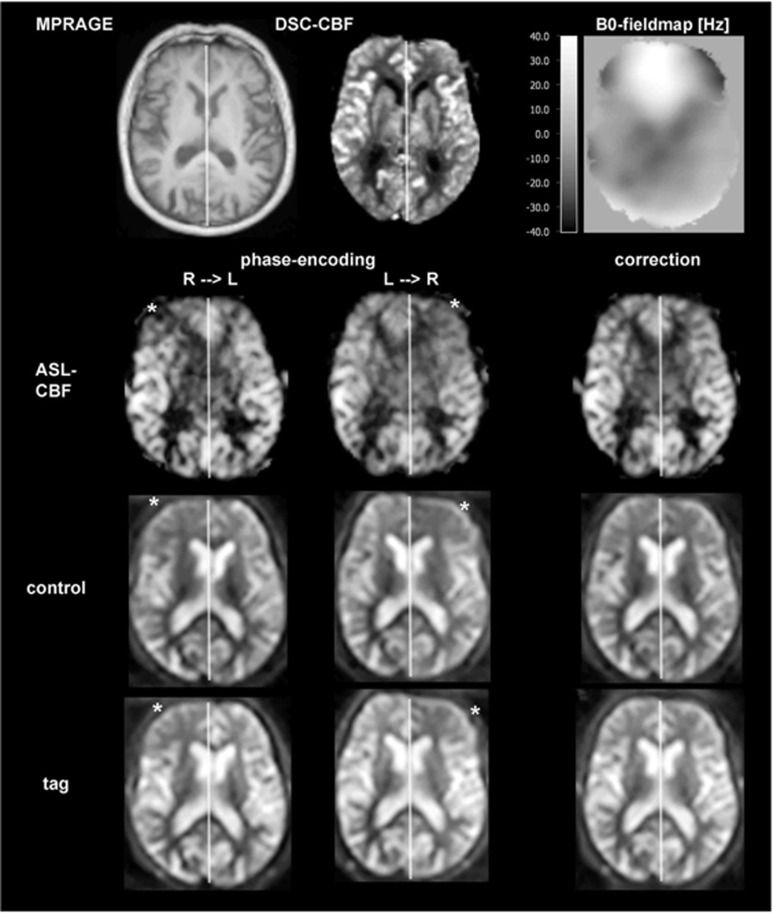
Pulsed arterial spin labeling (PASL) at multiple inflow times (multi-TIs) is advantageous for the measurement of brain perfusion in patients with long arterial transit times (ATTs) as in steno-occlusive disease, because bolus-arrival-time can be measured and blood flow measurements can be corrected accordingly. Owing to its increased signal-to-noise ratio, a combination with a three-dimensional gradient and spin echo (GRASE) readout allows acquiring a sufficient number of multi-TIs within a clinically feasible acquisition time of 5 minutes. We compared this technique with the clinical standard dynamic susceptibility-weighted contrast-enhanced imaging-magnetic resonance imaging in patients with unilateral stenosis >70% of the internal carotid or middle cerebral artery (MCA) at 3 Tesla. We performed qualitative (assessment by three expert raters) and quantitative (region of interest (ROI)/volume of interest (VOI) based) comparisons. In 43 patients, multi-TI PASL-GRASE showed perfusion alterations with moderate accuracy in the qualitative analysis. Quantitatively, moderate correlation coefficients were found for the MCA territory (ROI based: r=0.52, VOI based: r=0.48). In the anterior cerebral artery (ACA) territory, a readout related right-sided susceptibility artifact impaired correlation (ROI based: r=0.29, VOI based: r=0.34). Arterial transit delay artifacts were found only in 12% of patients. In conclusion, multi-TI PASL-GRASE can correct for arterial transit delay in patients with long ATTs. These results are promising for the transfer of ASL to the clinical practice.


Figures

Figure 1
Figure 1
Quantitative analysis of dynamic susceptibility-weighted contrast-enhanced imaging (DSC) and arterial spin labeling (ASL) images. (A) In all, 20 mm circular regions of interest (ROIs) were placed on the magnetization prepared rapid gradient-echo (MPRAGE) image and copied onto coregistered DSC-time-to-peak (TTP), DSC-cerebral blood flow (CBF), and ASL-CBF images. ROIs are colored according to the vascular territory. For relative values, the ratio of each ipsilateral ROI was divided by the mean of all contralateral ROIs of the same vascular territory. In case of DSC-TTP, the values were subtracted from the mean TTP value of all contralateral ROIs. (B) Gray matter masks, perfusion territory masks for anterior cerebral artery (ACA), middle cerebral artery (MCA), and posterior cerebral artery (PCA) were both placed onto DSC-CBF and ASL-CBF images and relative mean values were obtained (mean value of the ipsilateral perfusion territory divided by the mean value of the respective contralateral perfusion territory).
Figure 2
Figure 2
Exemplary patients. (A) A 39-year-old male, occlusion of the left internal carotid artery (ICA). Dynamic susceptibility-weighted contrast-enhanced imaging (DSC)-cerebral blood flow (CBF) shows a hypoperfusion in the lower part of the left middle cerebral artery (MCA) vascular territory. The arterial spin labeling (ASL) perfusion image shows matching perfusion changes as DSC-CBF. Time-to-peak (TTP)-DSC shows an ipsilateral delay (relative TTP (relTTP)=3 seconds) of the whole left MCA territory. This ipsilateral delay is also visible in the ASL-bolus-arrival-time (BAT) map. (B) A 48-year-old male, 99% stenosis of the left ICA. DSC-CBF shows a slight hypoperfusion in the left MCA vascular territory. ASL-CBF confirms this finding in the same area, but additionally shows an area of stronger CBF hypoperfusion in the posterior cerebral artery (PCA) territory. Note corresponding increased intensity in the BAT map and also the right frontal hypointense artifact in ASL-CBF (asterisk) (C) A 57-year-old male, occlusion of the left ICA. DSC-CBF shows a slight hypoperfusion in the left MCA vascular territory. ASL-CBF confirms this finding. However, ASL-CBF shows also arterial transit delay artifacts in this area evidenced by hyperintense serpiginous and dot shaped signals (white arrow). Both, TTP-DSC and ASL-BAT show a corresponding ipsilateral delay (relTTP=2.8 seconds).
Figure 3
Figure 3
Scatter plots and Bland-Altman (BA) plots. Data of all 43 patients are shown. (A) Scatter plots comparing dynamic susceptibility-weighted contrast-enhanced imaging (DSC)-relative cerebral blood flow (relCBF) and arterial spin labeling (ASL)-relCBF of the volume-of-interest (VOI)-based and the region of interest (ROI)-based analysis are depicted for each vascular territory ipsilateral to the steno-occlusion. The respective correlation is shown (*P<0.05; **P<0.0002). (B) BA plots for all vascular- perfusion territories and for VOI- and ROI-based analysis are shown comparing DSC-relCBF and ASL-relCBF. BA plots for anterior cerebral artery (ACA) and middle cerebral artery (MCA) perfusion territory show a mean difference between DSC-relCBF and ASL-relCBF measurements of close to 0 (ACA (VOI, ROI)=(0.03, 0)/MCA (VOI, ROI)=(0, −0.02)) and for posterior cerebral artery (PCA) perfusion territory of −0.07 (PCA (VOI, ROI)=(−0.08, −0.06)). In the VOI-based approach, a spread of ±30% (MCA/PCA) and ±55% (ACA) and in the ROI-based approach of ±60% is seen within ±1.96 s.d. BA plots of the VOI-based analysis for the ACA and MCA territory show high differences for high average relCBF. This might be explained by overestimation of CBF because of macrovascular signals. In the ACA territory, there is an additional bias of the BA plot, probably because of the susceptibility artifacts. (C) All ROIs of the ipsilateral hemisphere were grouped according to a relative TTP (relTTP) delay of >3.1 seconds and <3.1 seconds (3.1 seconds being the highest TI used for ASL in our study). Only 8% (n=120) ROI values were above 3.1 seconds. The ratio (relCBF-ASL/relCBF-DSC) was calculated for both groups and compared. The median of this quotient was significantly lower for ROIs with a relTTP delay of >3.1 seconds (0.97 versus 0.89, P<0.001).
Figure 4
Figure 4
Example of the frontal sinus susceptibility artifact. A 78-year-old male, 80% to 90% stenosis of right internal carotid artery (ICA). Arterial spin labeling (ASL)-cerebral blood flow (CBF) image shows a hypointensity (asterisk) in the anterior cerebral artery (ACA) territory, which is not confirmed by dynamic susceptibility-weighted contrast-enhanced imaging (DSC)-CBF. This hypointensity is located on the right side for right–left (R–L) phase encoding direction and on the left side for left–right (L–R) phase encoding direction. It is visible in tag and control images (inflow time (TI)=1300 milliseconds). In addition, considerable left to right (R–L) and right to left (L–R phase encoding direction) distortion is visible in the ASL-CBF, tag, and control images. The source is a frontal sinus susceptibility artifact. We have run a correction of this susceptibility artifact using TOPUP implemented in FMRIB Software Library (FSL), which successfully corrects for the distortions and the frontal artifact in ASL-CBF, tag, and control images. In addition, a B0-fieldmap is shown that has been scaled from −40 Hz (corresponds black) to +40 Hz (corresponds white). Both geometrical and intensity distortions are corrected as indicated by the hyperintense field above the roof of the sinuses.

References

    1. Detre JA, Leigh JS, Williams DS, Koretsky AP. Perfusion imaging. Magn Reson Med 1992; 23: 37–45. - PubMed
    1. Detre JA, Rao H, Wang DJ, Chen YF, Wang Z. Applications of arterial spin labeled MRI in the brain. J Magn Reson Imaging 2012; 35: 1026–1037. - PMC - PubMed
    1. Wintermark M, Sesay M, Barbier E, Borbély K, Dillon WP, Eastwood JD et al. Comparative overview of brain perfusion imaging techniques. Stroke 2005; 36: e83–e99. - PubMed
    1. Pizzini FB, Farace P, Manganotti P, Zoccatelli G, Bongiovanni LG, Golay X et al. Cerebral perfusion alterations in epileptic patients during peri-ictal and post-ictal phase: PASL vs DSC-MRI. Magn Reson Imaging 2013; 31: 1001–1005. - PubMed
    1. White CM, Pope WB, Zaw T, Qiao J, Naeini KM, Lai A et al. Regional and voxel-wise comparisons of blood flow measurements between dynamic susceptibility contrast magnetic resonance imaging (DSC-MRI) and arterial spin labeling (ASL) in brain tumors. JNeuroimaging 2014; 24: 23–30. - PubMed

Publication types