

Standard error of the genetic correlation: how much data do we need to estimate a purebred-crossbred genetic correlation?
- PMID: 25407726
- PMCID: PMC4236448
- DOI: 10.1186/s12711-014-0079-z
Standard error of the genetic correlation: how much data do we need to estimate a purebred-crossbred genetic correlation?
Abstract
Background: The additive genetic correlation (rg) is a key parameter in livestock genetic improvement. The standard error (SE) of an estimate of rg, r^g, depends on whether both traits are recorded on the same individual or on distinct individuals. The genetic correlation between traits recorded on distinct individuals is relevant as a measure of, e.g., genotype-by-environment interaction and for traits expressed in purebreds vs. crossbreds. In crossbreeding schemes, rg between the purebred and crossbred trait is the key parameter that determines the need for crossbred information. This work presents a simple equation to predict the SE of r^g between traits recorded on distinct individuals for nested full-half sib schemes with common-litter effects, using the purebred-crossbred genetic correlation as an example. The resulting expression allows a priori optimization of designs that aim at estimating rg. An R-script that implements the expression is included.
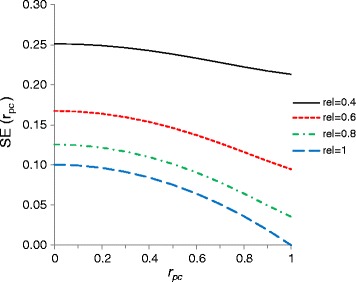
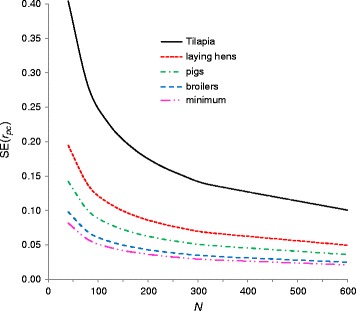
Results: The SE of r^g is determined by the true value of rg, the number of sire families (N), and the reliabilities of sire estimated breeding values (EBV):SEr^g≈1ρx2ρy2+1+0.5ρx4+0.5ρy4-2ρx2-2ρy2rg2+rg4N-1,where ρx2 and ρy2 are the reliabilities of the sire EBV for both traits. Results from stochastic simulation show that this equation is accurate since the average absolute error of the prediction across 320 alternative breeding schemes was 3.2%. Application to typical crossbreeding schemes shows that a large number of sire families is required, usually more than 100. Since SEr^g is a function of reliabilities of EBV, the result probably extends to other cases such as repeated records, but this was not validated by simulation.
Conclusions: This work provides an accurate tool to determine a priori the amount of data required to estimate a genetic correlation between traits measured on distinct individuals, such as the purebred-crossbred genetic correlation.
Figures
References
-
- Falconer DS, Mackay TFC. Introduction to Quantitative Genetics. Essex: Longman Scientific and Technical; 1996.
-
- Robertson A. The sampling variance of the genetic correlation coefficient. Biometrics. 1959;15:469–485. doi: 10.2307/2527750. - DOI
-
- Tallis GM. Sampling errors of genetic correlation coefficients calculated from analyses of variance and covariance. Aust J Stat. 1959;1:35–43. doi: 10.1111/j.1467-842X.1959.tb00271.x. - DOI
-
- Wei M, Van der Werf JHJ. Maximizing genetic response in crossbreds using both purebred and crossbred information. Anim Prod. 1994;59:401–413. doi: 10.1017/S0003356100007923. - DOI
Publication types
MeSH terms
LinkOut - more resources
Full Text Sources
Other Literature Sources
