. 2014 Nov 19;15(1):366.
doi: 10.1186/s12859-014-0366-2.

Rapid evaluation and quality control of next generation sequencing data with FaQCs

Affiliations

Rapid evaluation and quality control of next generation sequencing data with FaQCs

Chien-Chi Lo et al. BMC Bioinformatics. .

Abstract

Background: Next generation sequencing (NGS) technologies that parallelize the sequencing process and produce thousands to millions, or even hundreds of millions of sequences in a single sequencing run, have revolutionized genomic and genetic research. Because of the vagaries of any platform's sequencing chemistry, the experimental processing, machine failure, and so on, the quality of sequencing reads is never perfect, and often declines as the read is extended. These errors invariably affect downstream analysis/application and should therefore be identified early on to mitigate any unforeseen effects.

Results: Here we present a novel FastQ Quality Control Software (FaQCs) that can rapidly process large volumes of data, and which improves upon previous solutions to monitor the quality and remove poor quality data from sequencing runs. Both the speed of processing and the memory footprint of storing all required information have been optimized via algorithmic and parallel processing solutions. The trimmed output compared side-by-side with the original data is part of the automated PDF output. We show how this tool can help data analysis by providing a few examples, including an increased percentage of reads recruited to references, improved single nucleotide polymorphism identification as well as de novo sequence assembly metrics.

Conclusion: FaQCs combines several features of currently available applications into a single, user-friendly process, and includes additional unique capabilities such as filtering the PhiX control sequences, conversion of FASTQ formats, and multi-threading. The original data and trimmed summaries are reported within a variety of graphics and reports, providing a simple way to do data quality control and assurance.


Figures
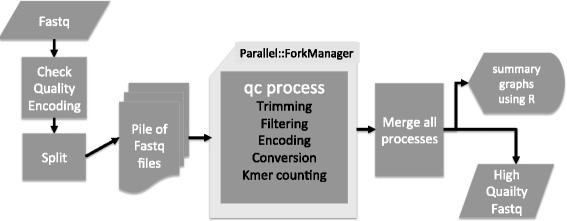
Figure 1
Figure 1
FaQCs Flowchart. FASTQ files input are first checked for the format of quality encoding, then split into a set (pile) of files which are subsets of the original input. Each file is processed independently and managed using the Parallel::ForkManager Perl module. A global data structure is used to store results returned from each parallel process. All reports are merged and a processed FASTQ file along with a series of detailed graphics are output in PDF format.
Figure 2
Figure 2
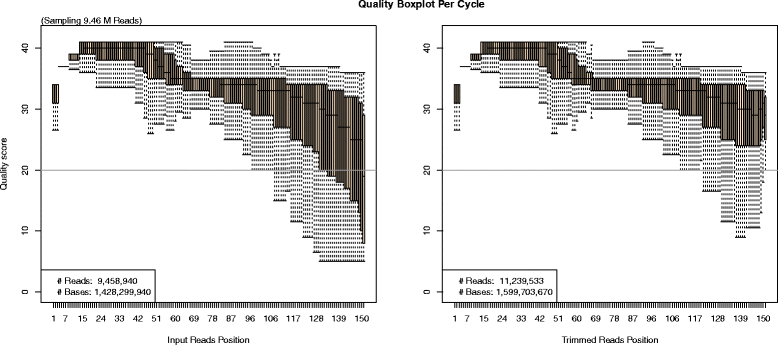
Boxplot graph for the quality scores. Rectangular boxes show the Inter-quartile Range (IQR). The end of the whiskers shows outliers at max 1.5*IQR. Horizontal lines in the box are median values at each bp position. There is a horizontal line at quality 20 indicating the predicted per base error rate of 1/100. For easy comparison, FaQCs generates two boxplots side by side where the left panel is the boxplot of the raw reads and the right represents the processed reads. This is but one set of figures generated in the final PDF report (see Additional file 1: Figure S1).
Figure 3
Figure 3
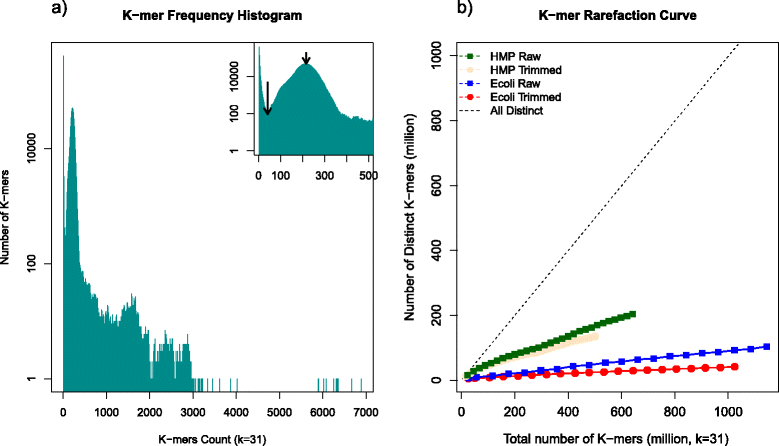
Plots from of k-mer profiling. a) K-mer frequency histogram of E.coli MiSeq dataset shows an obvious peak k-mer coverage near 216X (small arrow, inset figure) and a minimum inflection point at ~41X (long arrow, inset figure). The k-mers below than the minimum inflection point are due to sequencing artifacts and errors. The other small peaks typically indicate repeats in the genome. b) K-mer rarefaction curve shows a reduction of k-mers when trimming. The blue and red soild lines are the k-mer rarefaction curves of raw and trimmed E.coli MiSeq data, respectively. The green and beige solid lines are k-mer rarefaction curves of raw and trimmed data of the HMP Mock data, respectively. The dashed line represents the baseline where all observed k-mers are distinct.

References

    1. Dohm JC, Lottaz C, Borodina T, Himmelbauer H. Substantial biases in ultra-short read data sets from high-throughput DNA sequencing. Nucleic Acids Res. 2008;36(16):e105. doi: 10.1093/nar/gkn425. - DOI - PMC - PubMed
    1. Kwon S, Park S, Lee B, Yoon S. In-depth analysis of interrelation between quality scores and real errors in illumina reads. Conf Proc IEEE Eng Med Biol Soc. 2013;2013:635–638. - PubMed
    1. Cox MP, Peterson DA, Biggs PJ. SolexaQA: At-a-glance quality assessment of Illumina second-generation sequencing data. BMC Bioinformatics. 2010;11:485. doi: 10.1186/1471-2105-11-485. - DOI - PMC - PubMed
    1. Schmieder R, Edwards R. Quality control and preprocessing of metagenomic datasets. Bioinformatics. 2011;27(6):863–864. doi: 10.1093/bioinformatics/btr026. - DOI - PMC - PubMed
    1. Blankenberg D, Von Kuster G, Coraor N, Ananda G, Lazarus R, Mangan M, Nekrutenko A, Taylor J. Current protocols in molecular biology/edited by Frederick M Ausubel [et al.] 2010. Galaxy: a web-based genome analysis tool for experimentalists. - PMC - PubMed

Publication types