. 2014 Nov 19:4:7115.
doi: 10.1038/srep07115.

Crystal structure and stable property of the cancer-associated heterotypic nucleosome containing CENP-A and H3.3

Affiliations

Crystal structure and stable property of the cancer-associated heterotypic nucleosome containing CENP-A and H3.3

Yasuhiro Arimura et al. Sci Rep. .

Abstract

The centromere-specific histone H3 variant, CENP-A, is overexpressed in particular aggressive cancer cells, where it can be mislocalized ectopically in the form of heterotypic nucleosomes containing H3.3. In the present study, we report the crystal structure of the heterotypic CENP-A/H3.3 particle and reveal its "hybrid structure", in which the physical characteristics of CENP-A and H3.3 are conserved independently within the same particle. The CENP-A/H3.3 nucleosome forms an unexpectedly stable structure as compared to the CENP-A nucleosome, and allows the binding of the essential centromeric protein, CENP-C, which is ectopically mislocalized in the chromosomes of CENP-A overexpressing cells.


Figures

Figure 1
Figure 1. Preparation of the CENP-A/H3.3 nucleosome.
(a) Schematic representation of the CENP-A/His6-SUMO-H3.3 nucleosome preparation and the CENP-A/H3.3 nucleosome preparation with the His6-SUMO removal step. The CENP-A and His6-SUMO-H3.3 molecules are colored red and blue, respectively. (b) The reconstituted nucleosomes (lane 1) were separated by native PAGE with the Prep Cell apparatus. Purified nucleosome fractions were analyzed by 6% native PAGE with ethidium bromide staining. The fractions shown in lanes 5–8 were collected. (c) The purified H3.3, CENP-A, and CENP-A/H3.3 nucleosomes were analyzed by 6% PAGE with ethidium bromide staining. (d) The protein compositions of the CENP-A/His6-SUMO-H3.3 nucleosome (lane 2) and the CENP-A/H3.3 nucleosome (lane 3) were analyzed by 18% SDS-PAGE with Coomassie Brilliant Blue staining.
Figure 2
Figure 2. Crystal structure of the human CENP-A/H3.3 nucleosome.
(a) The CENP-A/H3.3 nucleosome structure is presented. CENP-A and H3.3 molecules are colored red and blue, respectively. The 2mFo - DFc maps of the two DNA end regions of the CENP-A/H3.3 were calculated and contoured at the 2.0σ level. (b) Close-up views of the CENP-A αN helix, the H3.3 αN helix, the CENP-A Ser68 residue, the H3.3 Gln68 residue, the CENP-A His104 residue, and the H3.3 Gly102 residue. Electron density maps are presented at the 1.5σ level.
Figure 3
Figure 3. The DNA end close to CENP-A is asymmetrically flexible in the CENP-A/H3.3 nucleosome.
(a) MNase assay. The H3.3, CENP-A, and CENP-A/H3.3 nucleosomes were treated with MNase (0, 0.3, 0.5 and 0.7 units), and the resulting DNA fragments were analyzed by native PAGE. The gel image shown is a representative of four independent experiments, in which similar results were obtained. (b) ExoIII assay. The H3.3, CENP-A, or CENP-A/H3.3 nucleosomes were incubated with or without 2.0 units of ExoIII for 2.5, 5 and 7.5 minutes at 37°C, and the resultant DNA fragments were extracted and analyzed by 14% denaturing PAGE with 7 M urea. The gel image shown is a representative of three independent experiments, in which similar results were obtained.
Figure 4
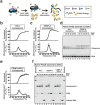
Figure 4. Stability of the CENP-A/H3.3 nucleosome.
(a) Schematic representation of the thermal stability assay. (b) Thermal stability curve of the H3.3 nucleosome. The fluorescence intensity was plotted against each temperature (from 55°C to 90°C). The derivative values of the H3.3 stability curve presented in the upper panel are plotted against the temperatures (bottom panel). Means ± s.d. (n = 3) are shown. (c) A thermal stability curve of the CENP-A nucleosome. The fluorescence intensity was plotted against each temperature (from 55°C to 90°C). The derivative values of the CENP-A stability curve presented in the upper panel are plotted against the temperatures (bottom panel). Means ± s.d. (n = 3) are shown. (d) Tetrasomes, reconstituted with the H3.3-H4 tetramer or the CENP-A-H4 tetramer and DNA, were analyzed by 6% native PAGE. Lane 1 indicates the H3.3 tetrasome before incubation. Lanes 2, 3, 4, 5, and 6 indicate the H3.3 tetrasomes after 25°C, 35°C, 45°C, 55°C, and 65°C incubations, respectively. Lane 7 indicates the CENP-A tetrasome before incubation. Lanes 8, 9, 10, 11, and 12 indicate the CENP-A tetrasomes after 25°C, 35°C, 45°C, 55°C, and 65°C incubations, respectively. DNA was visualized by ethidium bromide staining. The gel image is a representative of seven independent experiments with similar results. (e) A thermal stability curve of the CENP-A/H3.3 nucleosome. The fluorescence intensity was plotted against each temperature (from 55°C to 90°C). The derivative values of the CENP-A/H3.3 stability curve presented in the upper panel are plotted against the temperatures (bottom panel). Means ± s.d. (n = 3) are shown. (f) The H3.3, CENP-A, and CENP-A/H3.3 nucleosomes were incubated for 1 min at each temperature from 25°C, and the samples at 65°C, 72°C, 79°C, and 86°C were analyzed by 6% native PAGE. DNA was visualized by ethidium bromide staining. The gel image is a representative of three independent experiments with similar results.
Figure 5
Figure 5. CENP-C binding to the CENP-A/H3.3 nucleosome.
(a) Schematic representations of CENP-C binding to the H3.3 nucleosome, the CENP-A nucleosome, and the CENP-A/H3.3 nucleosome. (b) The binding of CENP-C to the CENP-A/H3.3 nucleosome. CENP-C(426–537) peptide binding to the H3.3 nucleosome (0.2 μM), the CENP-A nucleosome (0.2 μM), and the CENP-A/H3.3 nucleosome (0.2 μM) was evaluated by a gel mobility shift assay. The CENP-C(426–537) peptide concentrations are 0 μM (lanes 1, 3, and 10), 0.2 μM (lanes 4 and 11), 0.4 μM (lanes 5 and 12), 0.6 μM (lanes 6 and 13), 0.8 μM (lanes 2, 7, and 14), 1.0 μM (lanes 8 and 15), and 1.2 μM (lanes 9 and 16). The gel image is a representative of three independent experiments with similar results.

References

    1. Luger K., Mäder A. W., Richmond R. K., Sargent D. F. & Richmond T. J. Crystal structure of the nucleosome core particle at 2.8 Å resolution. Nature 389, 251–260 (1997). - PubMed
    1. Tan S. & Davey C. A. Nucleosome structural studies. Curr. Opin. Struct. Biol. 21, 128–136 (2011). - PMC - PubMed
    1. Talbert P. B. et al. A unified phylogeny-based nomenclature for histone variants. Epigenetics Chromatin 5, 7 (2012). - PMC - PubMed
    1. Vardabasso C. et al. Histone variants: emerging players in cancer biology. Cell. Mol. Life Sci. 71, 379–404 (2013). - PMC - PubMed
    1. Maze I., Noh K. M., Soshnev A. A. & Allis C. D. Every amino acid matters: essential contributions of histone variants to mammalian development and disease. Nat. Rev. Genet. 15, 259–271(2014). - PMC - PubMed

Publication types

MeSH terms

Associated data