. 2015 Jun 1;38(6):979-88.
doi: 10.5665/sleep.4754.

Arvicanthis ansorgei, a Novel Model for the Study of Sleep and Waking in Diurnal Rodents

Affiliations

Arvicanthis ansorgei, a Novel Model for the Study of Sleep and Waking in Diurnal Rodents

Jeffrey Hubbard et al. Sleep. .

Abstract

Study objectives: Sleep neurobiology studies use nocturnal species, mainly rats and mice. However, because their daily sleep/wake organization is inverted as compared to humans, a diurnal model for sleep studies is needed. To fill this gap, we phenotyped sleep and waking in Arvicanthis ansorgei, a diurnal rodent widely used for the study of circadian rhythms.

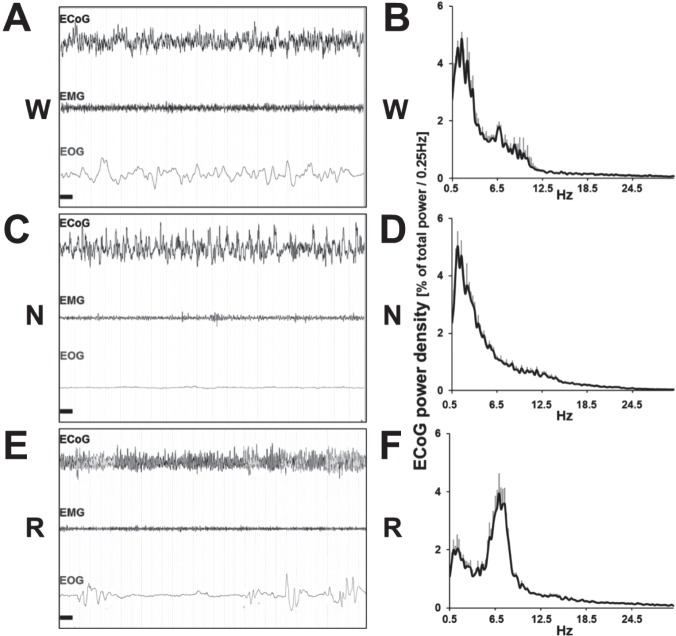
Design: Video-electroencephalogram (EEG), electromyogram (EMG), and electrooculogram (EOG) recordings.

Setting: Rodent sleep laboratory.

Participants: Fourteen male Arvicanthis ansorgei, aged 3 mo.

Interventions: 12 h light (L):12 h dark (D) baseline condition, 24-h constant darkness, 6-h sleep deprivation.

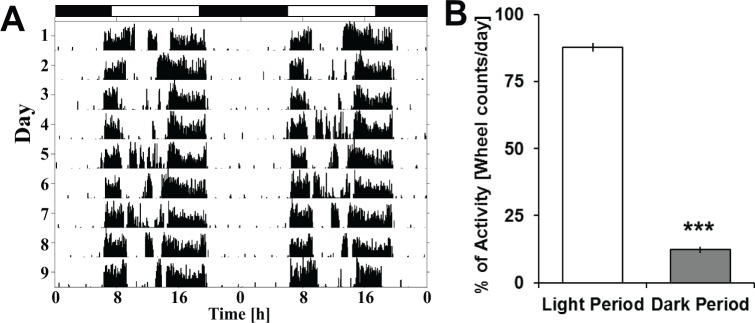
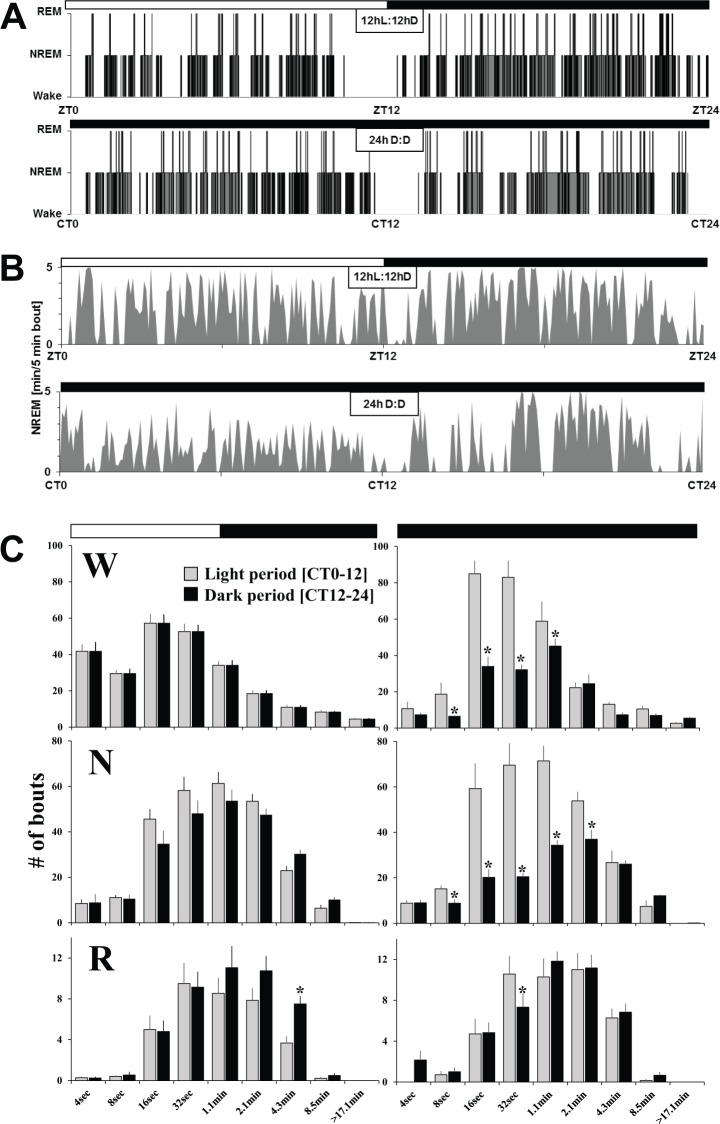
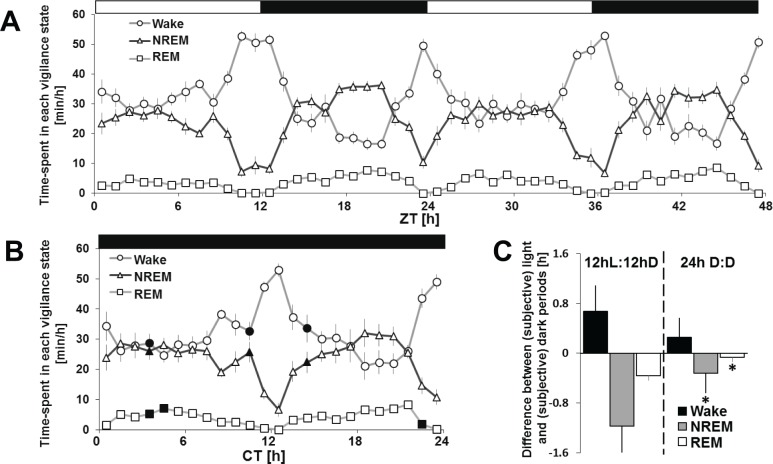
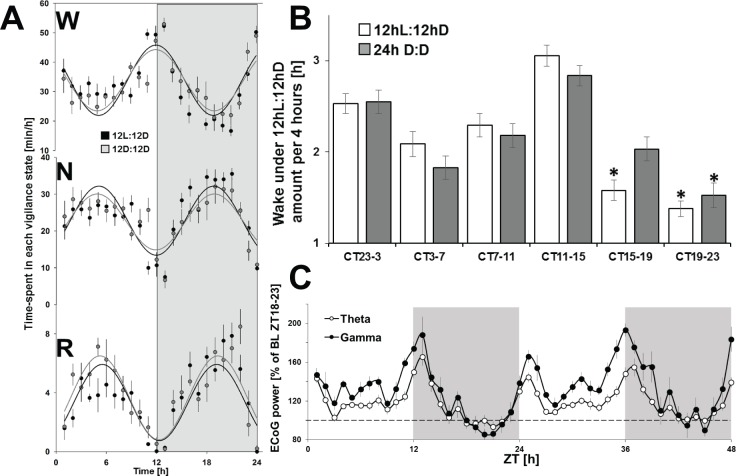
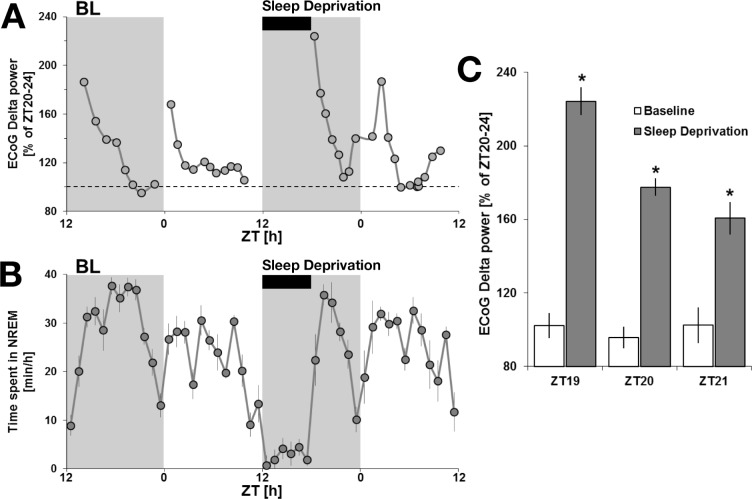
Measurements and results: Wake and rapid eye movement (REM) sleep showed similar electrophysiological characteristics as nocturnal rodents. On average, animals spent 12.9 h ± 0.4 awake per 24-h cycle, of which 6.88 h ± 0.3 was during the light period. NREM sleep accounted for 9.63 h ± 0.4, which of 5.13 h ± 0.2 during dark period, and REM sleep for 89.9 min ± 6.7, which of 52.8 min ± 4.4 during dark period. The time-course of sleep and waking across the 12 h light:12 h dark was overall inverted to that observed in rats or mice, though with larger amounts of crepuscular activity at light and dark transitions. A dominant crepuscular regulation of sleep and waking persisted under constant darkness, showing the lack of a strong circadian drive in the absence of clock reinforcement by external cues, such as a running wheel. Conservation of the homeostatic regulation was confirmed with the observation of higher delta power following sustained waking periods and a 6-h sleep deprivation, with subsequent decrease during recovery sleep.

Conclusions: Arvicanthis ansorgei is a valid diurnal rodent model for studying the regulatory mechanisms of sleep and so represents a valuable tool for further understanding the nocturnality/diurnality switch.

Keywords: Arvicanthis ansorgei; circadian rhythm; crepuscular; direct effects of light; diurnality; nocturnality; rodent; sleep deprivation; sleep homeostasis; sleep regulation.


Figures

Figure 1
Figure 1
Daily wheel-running activity under a standard 12hL:12hD cycle. (A) Actimetry sample from a single animal, double-plotted and centered at ZT0 (7h00) for a total period of 11 days under standard baseline conditions. (B) Differences for total wheel counts under actimetry recording during the light versus dark period. Analysis was done using Student t test and found to be highly significant. Asterisks represents Student t test significance (P < 0.00001).
Figure 2
Figure 2
Samples of polygraphic recordings and electroencephalography (EEG) power spectrum profile in wake, non-rapid eye movement (NREM) sleep, and rapid eye movement (REM) sleep under baseline condition. Samples of EEG, electromyography (EMG), and electrooculography (EOG) recordings obtained during baseline 12hL:12hD condition: (A) During waking a desynchronized EEG pattern occurs in parallel with high levels of EOG and EMG activities. (B) Power spectrum analysis of all waking epochs during baseline. Peaks are noticed in both the delta (0.5–4 Hz) and theta (6–10 Hz) ranges. (C) Recordings during NREM sleep show synchronized slow-wave activity oscillations in the EEG, with a near complete suppression of EMG and EOG activity. (D) Spectral profile is dominated by delta frequencies. (E) During REM sleep a desynchronized EEG pattern emerges with a total flattening of the EMG, reflecting the atonic state of the animal. Rapid eye movements are indicated by EOG activity. (F) Power spectrum profile is dominated by theta activity. Graph represents peak relative frequencies of total power between 0.5–25 Hz and standard error of the mean. Horizontal black bars: 1 sec, window represents 20 sec of recording. N, non-rapid eye movement; R, rapid eye movement; W, wake.
Figure 3
Figure 3
Twenty-four hour distribution of sleep and waking under 12hL:12hD and 24h D:D. Examples of a hypnogram based on 4-sec epoch scoring (A) and of non-rapid eye movement (NREM) sleep per 5-min bouts (B) in two different Arvicanthis ansorgei across 12hL:12hD and 24h D:D conditions. Frequency distribution of W, NREM sleep, and REM sleep episode lengths (C) during 12hL:12hD versus 24h D:D. Vertical bars represent the number of episodes (mean + standard error of the mean) expressed as time spent during light or dark periods (left) or subjective light or dark periods (right), in each state by episode duration. Two-way analyses of variance (ANOVAs) were performed to examine bout length differences as a function of light/dark period as well as lighting condition (12hL:12hD versus 24h D:D). Significance was seen at differing points. pLight condition × L vs. D < 0.05 (W- 16 sec, 17.1 m; N- 16 sec, 32 sec, 1.1 min; R- 4 sec). pLight condition < 0.05 (W- 4 sec, 8 sec, 1.1 min; R- 4 sec). pL vs. D < 0.05 (W- 8 sec, 16 sec, 32 sec, 4.3 min, 8.5 min; N- 8 sec, 16 sec, 32 sec, 1.1 min, 8.5 min; R- 4 sec, 4.3 min). Asterisks represent significance between subjective light and dark phases (one-way ANOVAs, post hoc t tests P < 0.05). D, dark; L, light; N, non-rapid eye movement; R, rapid eye movement; W, wake; ZT, Zeitgeber time; CT, circadian time.
Figure 4
Figure 4
Time-course of sleep and waking under 12hL:12hD and 24h D:D. Vigilance states are represented as the amount of minutes per hour across 48-hours of the 12hL:12hD cycle (A) or 24h D:D (B). (C) Difference between the light and dark periods of total amounts of wake, non-rapid eye movement (NREM) sleep and rapid eye movement (REM) sleep during the 12hL:12hD baseline condition (left), and difference of vigilance states between the subjective light and dark periods under 24h D:D (right). All values are expressed as mean ± standard error of the mean. A two-way ANOVA for time-course and light condition showed significance for any vigilance states between baseline and constant darkness (black points- one-way ANOVA for light condition, post hoc t test, P < 0.05). Asterisks denote significant differences (P < 0.05). CT, circadian time; D, dark; L, light.
Figure 5
Figure 5
Crepuscular regulation of sleep and waking. (A) Sine-waves were calculated for each vigilance state to determine their mathematical profile during 12hL:12hD (gray) and 24h D:D (black). No significant difference was observed between the two conditions. (B) Amounts of wake per periods of 4 h centered on the (subjective – gray bar) D-L-D transitions show predominant wake activity at (subjective – gray bar) circadian time points (CT) and an increased wake during the (subjective – gray bar) light period outside of the (subjective – gray bar) crepuscular zone, as compared to the dark (subjective – gray bar) period outside the (subjective – gray bar) crepuscular zone. Asterisks denote significant differences (P < 0.05) by t test, between the different 4-h periods. All values are expressed as mean ± standard error of the mean. (C) Time-course of electroencephalography theta and gamma power spectrum during waking epochs expressed per hour across the two baseline days. D, dark; L, light; ZT, Zeitgeber time.
Figure 6
Figure 6
Non-rapid eye movement (NREM) sleep and electroencephalography (EEG) delta power under sleep deprivation at ZT12. (A) EEG delta power expressed as a percentage of ZT20-ZT24 during baseline (ZT20-ZT24 was determined to consistently be the period with the lowest sleep pressure). The 6-h sleep deprivation is displayed as well as the preceding baseline day. (B) NREM sleep amounts under baseline conditions are at the maximum level at ZT 18. The rebound of NREM following the 6-h sleep deprivation occurs at ZT 18, which more likely explains why NREM amounts following a 6-h sleep deprivation stay within the baseline range. However, the peak of EEG delta power reached after sleep deprivation, a more reliable marker of the homeostatic process, is increased compared to baseline values. (C) Histograms representing EEG delta power during the first 3 h of recovery after the sleep deprivation as compared to the same baseline ZT (n = 8). A repeated-measures analysis of variance for baseline versus sleep deprivation and time-course showed significance. Asterisks denote significant differences following post hoc protected least significant difference (P < 0.05). BL, baseline; ZT, Zeitgeber time.

Similar articles

Cited by

References

    1. Dijk DJ, Daan S. Sleep EEG spectral analysis in a diurnal rodent: Eutamias sibiricus. J Comp Physiol A. 1989;165:205–15. - PubMed
    1. Walker JM, Glotzbach SF, Berger RJ, Heller HC. Sleep and hibernation in ground squirrels (Citellus spp): electrophysiological observations. Am J Physiol. 1977;233:R213–21. - PubMed
    1. Kas MJ, Edgar DM. Crepuscular rhythms of EEG sleep-wake in a hystricomorph rodent, Octodon degus. J Biol Rhythms. 1998;13:9–17. - PubMed
    1. Ocampo-Garces A, Hernandez F, Palacios AG. REM sleep phase preference in the crepuscular Octodon degus assessed by selective REM sleep deprivation. Sleep. 2013;36:1247–56. - PMC - PubMed
    1. Challet E, Pitrosky B, Sicard B, Malan A, Pevet P. Circadian organization in a diurnal rodent, Arvicanthis ansorgei Thomas 1910: chronotypes, responses to constant lighting conditions, and photoperiodic changes. J Biol Rhythms. 2002;1:52–64. - PubMed

Publication types

MeSH terms