. 2014 Dec 4;516(7529):90-3.
doi: 10.1038/nature13889. Epub 2014 Nov 17.

Inhibition of cell expansion by rapid ABP1-mediated auxin effect on microtubules

Affiliations

Inhibition of cell expansion by rapid ABP1-mediated auxin effect on microtubules

Xu Chen et al. Nature. .

Abstract

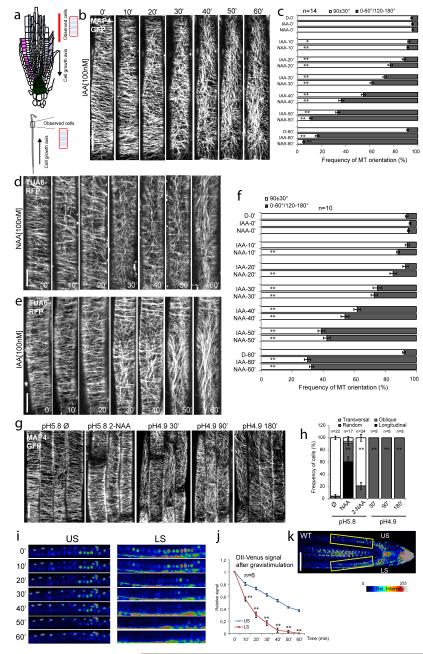
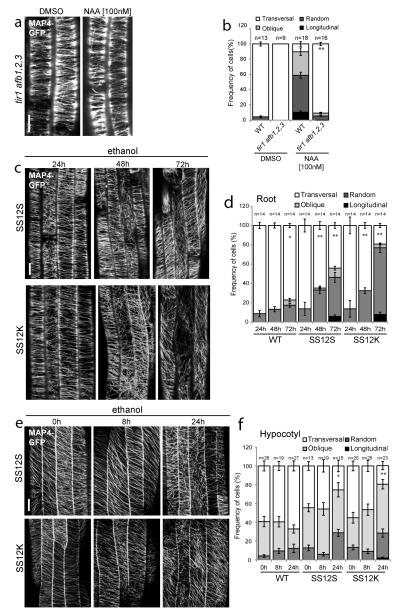
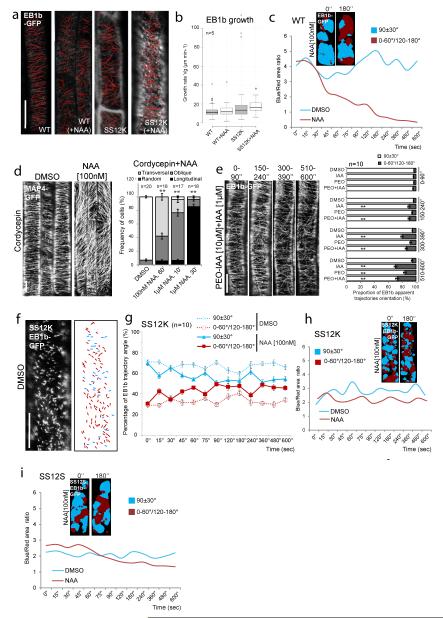
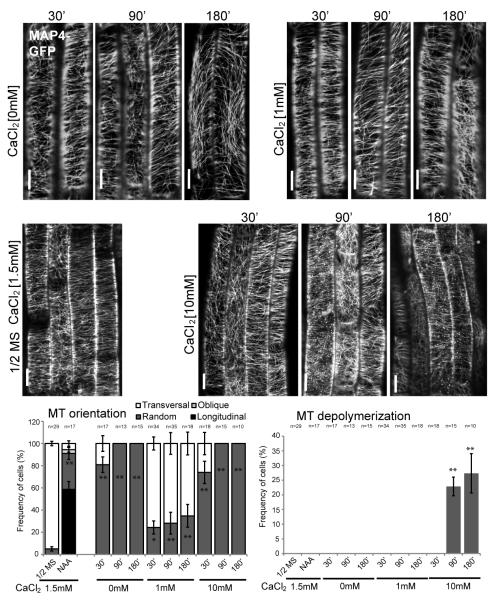
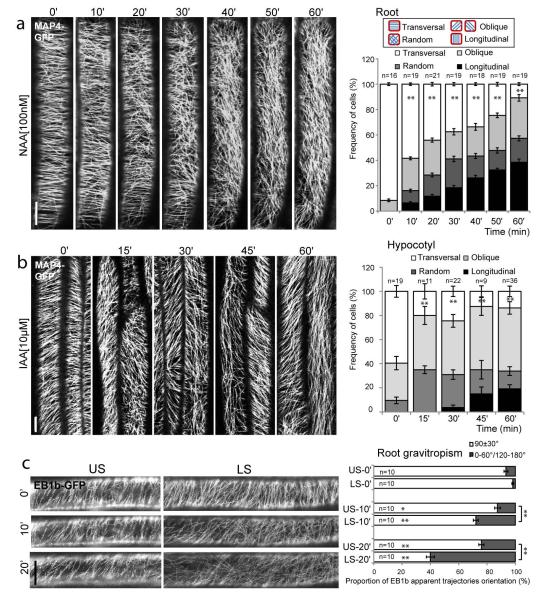
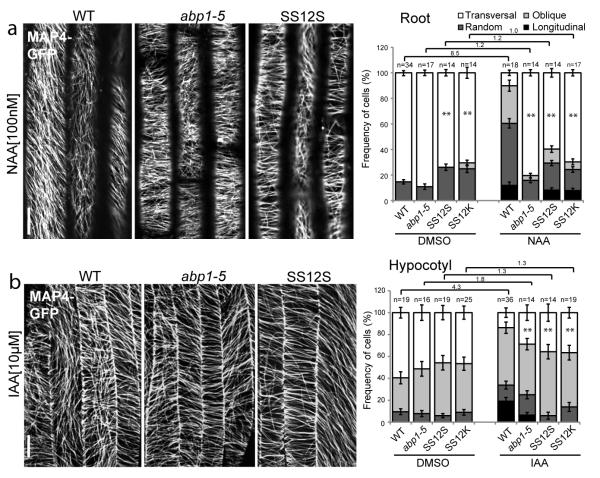
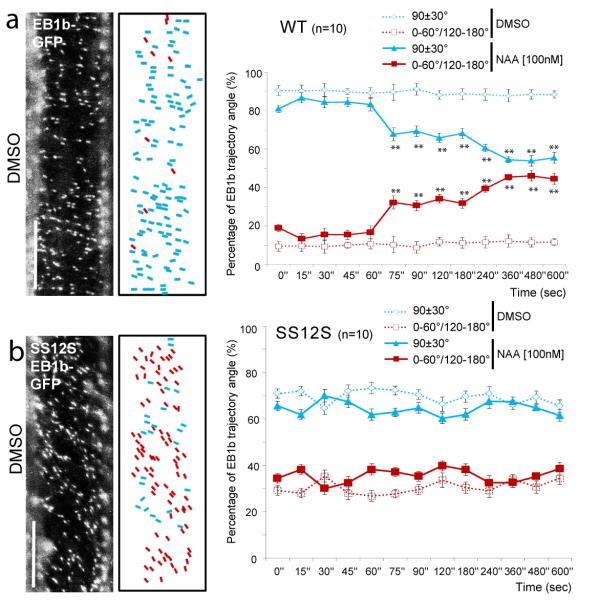
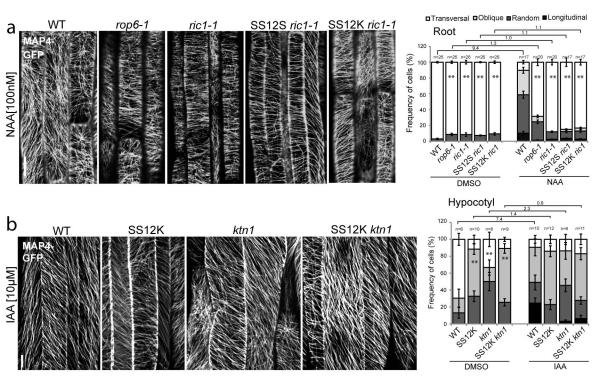
The prominent and evolutionarily ancient role of the plant hormone auxin is the regulation of cell expansion. Cell expansion requires ordered arrangement of the cytoskeleton but molecular mechanisms underlying its regulation by signalling molecules including auxin are unknown. Here we show in the model plant Arabidopsis thaliana that in elongating cells exogenous application of auxin or redistribution of endogenous auxin induces very rapid microtubule re-orientation from transverse to longitudinal, coherent with the inhibition of cell expansion. This fast auxin effect requires auxin binding protein 1 (ABP1) and involves a contribution of downstream signalling components such as ROP6 GTPase, ROP-interactive protein RIC1 and the microtubule-severing protein katanin. These components are required for rapid auxin- and ABP1-mediated re-orientation of microtubules to regulate cell elongation in roots and dark-grown hypocotyls as well as asymmetric growth during gravitropic responses.


Figures

Extended Data Figure 1
Extended Data Figure 1. Auxin induces MT rearrangement in root cells
(a) Schematic diagram of root and dark grown hypocotyl growth. The growth direction of root and hypocotyl is named as cell growth axis. The observed cells for MTs array were in the transition zone (highlighted by red line) of root and in the elongation zone of dark grown hypocotyl (highlighted by grey frame). The arrays of MTs in root and hypocotyl were depicted for the expanding cells. (b-f) MAP4-GFP or TUA6-RFP visualization of MTs orientation in roots was performed by time-lapse observation (every 10min, ’=min) following 100nM NAA or IAA treatment, and deviated angles of individual MTs were quantified as transversal MTs (90±30°) or longitudinal MTs (0-60°/120-180°). In (c) and (f), Student’s T-test was calculated for transversal MTs in comparison to untreated roots (* p<0.05; ** p<0.001). (g-h) MAP4-GFP visualization and quantification of MTs orientation in roots after 1μM 2-NAA treatment for 60min or after transfer of seedlings on acidified 1/2 MS medium at pH4.9 for 30min, 90min and 180min. Student’s T-test was calculated for transversal MTs in treated samples in comparison to 1/2MS (pH5.8) growing roots used as controls (** p<0.001). (i-k) Auxin distribution approximated by DII-Venus at the lower side (LS) and upper side (US) of 90° reoriented WT root (in DII-Venus background). Enlarged pictures (i) are shown as the frames highlighted (k). Signal intensity is represented by the color code as indicated. The relative signal for the US and LS (j) is expressed in comparison to the signal in the respective frame before gravistimulation. Student’s T-test was calculated for the signal between US and LS at each time point (** p<0.001). In all panels, error bars are s.e.m. Scale bars: 5 μm (b, d, e, g) and 30 μm (k).
Extended Data Figure 2
Extended Data Figure 2. Functional inactivation of ABP1 resulted in MT defects gradually increasing with time of ABP1 inactivation
(a-b) MAP4-GFP visualization of MTs orientation in WT and tir1-1afb1-1afb2-1afb3-1 (abbreviated as tir1afb1,2,3) seedlings following 100nM NAA treatment for 60min. The proportion of cells with the four categories of MTs orientation patterns was determined, and the student’s T-test was calculated for the category of transversal MT in comparison to WT treated in the same condition (** p<0.001). (c-f) MAP4-GFP visualization and quantification of MTs orientation in roots (c-d) or dark grown hypocotyls (e-f) of WT, SS12S and SS12K seedlings following different time of ethanol induction as indicated. Student’s T-test was calculated for the transversal MTs in comparison to WT exposed for the same time to ethanol vapors than the conditional ABP1 lines (* p<0.05, ** p<0.001). In all panels, error bars are s.e.m. Scale bars: 5μm (a, c) and 10μm (e).
Extended Data Figure 3
Extended Data Figure 3. ABP1 is involved in MT rearrangement following gravistimulation
(a) Rearrangement of MTs at the LS compared with the US of 90° reoriented roots of WT, SS12S, SS12K, abp1-5 (all expressing MAP4-GFP). Two different types of MTs orientation (90±30° or 0-60°/120-180°) were quantified. Student’s T-test was calculated for the category of transversal MTs in comparison to each 0’ time point and calculated for transversal MTs in the LS in comparison of the US at each time point (** p<0.001). (b-c) Auxin distribution simulated by DII-Venus at the LS compared with the US of 90° reoriented roots of SS12S and SS12K (all in DII-Venus background, enlarged pictures was visualized as the frames highlighted). Image stacks were taken every 10min, and in total 60 min (’). The ratio of the LS signal divided by the US one is shown in the chart (c). Student’s T-test was calculated for the signal ratio at each time point of SS12S/K compared with WT (** p<0.001). Signal intensity is represented by the color code as indicated. To be compared to WT data (Extended Data Fig. 1i-k). (d) The deviated angles of 90° gravistimulated-roots of WT, abp1-5, SS12S and SS12K seedlings were calculated for every 30min, in total 8h (Student’s T-test, *p<0.05, ** p<0.001). In all panels, error bars are s.e.m. Scale bars: 5 μm (a) and 30 μm (b).
Extended Data Figure 4
Extended Data Figure 4. Auxin effect on fast responsiveness of MT dynamics is dependent on ABP1
(a-b) Acquisition and quantification of the rate of EB1b movement in roots of untreated or 100nM NAA-treated (60min) WT or SS12K (expressing EB1b-GFP) by measuring EB1b-GFP growth events as highlighted by red lines (Student’s T-test, p>0.05). Box plots indicate the 25 percentage (bottom boundary), median (middle line), 75 percentage (top boundary), the nearest observations within 1.5 times, the interquartile range and outliers. (c) EB1b movement was simulated as transversal (blue, 90±30°) or longitudinal (red, 0-60°/120-180°) trajectories before (0”) and after 180”100 nM NAA treatment in WT background (color maps). The blue/red surface ratio is quantified as the chart (n=5). Corresponding to Fig. 3a. (d) MTs orientation patterns after 400μM cordycepin plus NAA cotreatment. Student’s T-test was calculated for the category of transversal MT in comparison to only cordycepin treatment (** p<0.001). (e) EB1b trajectories (simulated by time-stack from 10min videos) were visualized and quantified after DMSO, IAA (1μM), PEO-IAA (10μM), and PEO-IAA (10μM) plus IAA (1μM) treatments. The left panel shows successive frames of 90sec acquisitions following IAA application of pretreated PEO-IAA WT roots. Student’s T-test was calculated for the category of transversal MTs in comparison to DMSO treatment at each time point (** p<0.001). (f-i) Projections of EB1b-GFP in SS12K roots (f) and quantification (g) from every 15 sec acquisitions during 10 min (Supplementary Video 4, 6) following DMSO or 100 nM NAA application (n=10). Blue and red strips represent transversal (90±30°) and oblique/longitudinal (0-60°/120-180°) directions, respectively (f). Color maps show the simulated transversal or longitudinal trajectories of EB1b before (0”) and after 180”100 nM NAA treatment in SS12K (h) or SS12S (i) roots. The blue/red surface ratio is quantified as the charts (n=5) (h-i). The data of SS12S (i) is corresponding to Fig. 3b. Compared to WT situation (Fig. 3a, Extended Data Fig. 4c). In all panels, error bars are s.e.m and scale bars are 5 μm.
Extended Data Figure 5
Extended Data Figure 5. Overexpressed ABP1 induced auxin effect on fast responsiveness of MT dynamics
(a-c) ABP1 and ABP1-GFP transcripts (a) and ABP1 protein level (b-c) were detected in WT and XVE>>ABP1-OE line before and after 2μM estradiol induction for 12h or 48h prior to RNA or protein extraction. The transcript levels of ABP1 in WT with DMSO treatment was standardized as “1” (a). 22KDa native ABP1 band and 49KDa ABP1-GFP band were detected and quantified in the right chart. The protein level of native ABP1 or ABP1-GFP in WT was standardized as “1” for each ABP1 and ABP1-GFP, respectively (b-c). Student’s T-test, ** p<0.001. (d) Time-lapse observation of MTs orientation in the roots of XVE>>ABP1-OE roots expressing TUA6-RFP, WT and abp1-5 (both expressing MAP4-GFP) upon 100 nM NAA treatment. The percentage of reorientated MTs (0-60°/120-180°) was quantified. Reorientated MTs in the inducible XVE>>ABP1-OE TUA6-RFP roots were calculated in comparison to none-inducible roots, and abp1-5 MAP4-GFP was compared to MAP4-GFP situation at each time point (Student’s T-test, * p<0.05, ** p<0.001). In all panels, error bars are s.e.m and scale bars are 5 μm.
Extended Data Figure 6
Extended Data Figure 6. Calcium starvation disrupts MT orientation and high calcium increases MT depolymerization
Orientation and polymerization status of MTs were visualized following transfer of seedlings to different concentrations of CaCl2 for 30min, 90min or 180min. Low calcium level disrupted MTs organization leading to predominantly random pattern and high calcium caused MT depolymerization. Student’s T-test was calculated for the category of transversal MTs in comparison to seedlings grown and transferred on standard 1/2 MS (with 1.5mM CaCl2) seedlings (*p<0.05, ** p<0.001). In all panels, error bars are s.e.m. and scale bars are 5μm.
Extended Data Figure 7
Extended Data Figure 7. Auxin-ABP1 controls MT arrangement through the downstream ROP6-RIC1-KTN1 signaling
(a) MAP4-GFP visualization of MTs orientation in the root of WT, rop6-1, ric1-1, SS12S ric1-1, SS12K ric1-1 following DMSO application for 60 min. Corresponding to quantifications in Fig. 4a. (b-c) MTs reorientation patterns were visualized by MAP4-GFP in the roots of WT and rop6-1+/− following DMSO or 100nM NAA application for 60 min (Student’s T-test, p>0.05). (d) The transcript level of the scFv12 coding the recombinant antibody responsible for ABP1 knockdown in WT, ric1-1, ktn1, SS12S, SS12K, SS12S ric1-1, SS12K ric1-1, SS12S ktn1 and SS12K ktn1 after 48h ethanol induction. The transcript level of the scFv12 in SS12S was standardized as “1” (Student’s T-test, p>0.05). (e) MTs orientation by MAP4-GFP in dark grown hypocotyls of WT, SS12K, ktn1, SS12K ktn1 (with 24h ethanol induction) following DMSO application for 60 min. Corresponding to Fig. 4b. In all panels, error bars are s.e.m. Scale bars: 5μm (a-b) and 10μm (d).
Figure 1
Figure 1. Auxin induces MT reorientation
(a-b) MAP4-GFP visualization of MTs orientation in roots (a) and etiolated hypocotyls (b) by time-lapse imaging following 100 nM NAA or 10 μM IAA treatment, respectively. The cartoon illustrates the four categories of MTs orientation. (c) EB1b-GFP visualization of MTs trajectories at the LS and US sides of 90° gravistimulated roots. EB1b trajectories were quantified as transversal (90±30°) or longitudinal (0-60°/120-180°) MTs. In all panels, error bars are s.e.m. and student’s T-test was calculated for transversal MTs (*p<0.05, ** p<0.001). Scale bars: 5 μm (a, c), 10 μm (b).
Figure 2
Figure 2. ABP1 is required for auxin regulation of MT reorientation
(a-b) MAP4-GFP visualization of MTs reorientation in WT, abp1-5, SS12S/K root (a) and hypocotyl (b) induced with ethanol vapors for 48h (a) and 8h (b) and following 60 min treatment with DMSO, 100 nM NAA (a) or 10 μM IAA (b). The ratio of transversal MTs in DMSO-versus NAA-treated is indicated above the charts (a, b). In all panels, error bars are s.e.m. and student’s T-test was calculated for transversal MTs (** p<0.001). Scale bars: 5 μm (a) and 10 μm (b).
Figure 3
Figure 3. Auxin effect on fast responsiveness of MT rearrangement is dependent on ABP1
(a-b) Projections of EB1b-GFP in WT (a) or SS12S (b) roots (left panels) and quantification (right charts) from every 15 sec acquisitions during 10 min (Supplementary Video 1, 2, 3, 5) following DMSO or 100 nM NAA application (n=10). Blue and red strips represent transversal (90±30°) and oblique/longitudinal (0-60°/120-180°) directions, respectively. In all panels, error bars are s.e.m. determined by student’s T-test (*p<0.05, ** p<0.001). Scale bars: 5 μm.
Figure 4
Figure 4. Auxin-ABP1 control MT arrangement through downstream ROP6-RIC1 and involvement of KTN1
(a) MTs orientation and quantification in roots of WT, rop6-1, ric1-1, SS12S/K ric1-1 following 60 min of DMSO or 100 nM NAA application. (b) MTs orientation and quantification in 24h ethanol induced hypocotyls of WT, SS12K, ktn1 and SS12K ktn1 following 60 min of DMSO or 10 μM IAA application. The ratio of transversal MTs in DMSO-versus NAA/IAA-treated is indicated above the charts (a, b). In all panels, error bars are s.e.m. and student’s T-test was calculated for transversal MTs (** p<0.001). Scale bars: 5 μm (a) and 10 μm (b).

Comment in

References

    1. Perrot-Rechenmann C. Cellular responses to auxin: division versus expansion. Cold Spring Harb. Perspect. Biol. 2010;2:a001446. - PMC - PubMed
    1. Sedbrook JC, Kaloriti D. Microtubules, MAPs and plant directional cell expansion. Trends Plant Sci. 2008;13:303–310. - PubMed
    1. Chapman EJ, Estelle M. Mechanism of auxin-regulated gene expression in plants. Annu. Rev. Genet. 2009;43:265–285. - PubMed
    1. Lucas J, Shaw SL. Cortical microtubule arrays in the Arabidopsis seedling. Curr. Opin. Plant Biol. 2008;11:94–98. - PubMed
    1. Blancaflor EB. The cytoskeleton and gravitropism in higher plants. J. Plant Growth Regul. 2002;21:120–136. - PubMed

Publication types

MeSH terms