. 2014 Dec 4;516(7529):94-8.
doi: 10.1038/nature13960. Epub 2014 Nov 19.

An enteric virus can replace the beneficial function of commensal bacteria

Affiliations

An enteric virus can replace the beneficial function of commensal bacteria

Elisabeth Kernbauer et al. Nature. .

Abstract

Intestinal microbial communities have profound effects on host physiology. Whereas the symbiotic contribution of commensal bacteria is well established, the role of eukaryotic viruses that are present in the gastrointestinal tract under homeostatic conditions is undefined. Here we demonstrate that a common enteric RNA virus can replace the beneficial function of commensal bacteria in the intestine. Murine norovirus (MNV) infection of germ-free or antibiotic-treated mice restored intestinal morphology and lymphocyte function without inducing overt inflammation and disease. The presence of MNV also suppressed an expansion of group 2 innate lymphoid cells observed in the absence of bacteria, and induced transcriptional changes in the intestine associated with immune development and type I interferon (IFN) signalling. Consistent with this observation, the IFN-α receptor was essential for the ability of MNV to compensate for bacterial depletion. Importantly, MNV infection offset the deleterious effect of treatment with antibiotics in models of intestinal injury and pathogenic bacterial infection. These data indicate that eukaryotic viruses have the capacity to support intestinal homeostasis and shape mucosal immunity, similarly to commensal bacteria.


Figures
Extended data figure 1
Extended data figure 1. Mono-association of germfree mice with MNV does not lead to uncontrolled viral replication or disease
(a) Schematic of MNV mono-association procedure (see methods for additional details). Germfree (GF) breeder pairs (F0) within a gnotobiotic isolator were infected with 3×10⁶ plaque forming units (pfu) of MNV.CR6, which was allowed to transmit naturally to offspring (F1). Weaned offspring were maintained in isolators until adulthood, and then either used for analysis or as breeders to generate additional experimental animals (F2). (b) Successful transmission to offspring and the persistent presence of the virus in mono-associated GF mice (GF+MNV) was confirmed by performing a plaque assay using stool harvested from 8 week old offspring (~1 month after weaning). The amount of virus in stool from GF mice, antibiotics (ABX)-treated WT and IFNAR−/− mice, and conventional (Conv) mice infected with 3×10⁶ pfu of the indicated strains of MNV for 10 days are also shown, N = 5 mice per group. (c-f) Mice receiving the indicated treatments did not display significant histopathology in the small intestine (c,e) and colon (d,f) based on blind quantification of H&E-stained sections using a previously described scoring system. Mice receiving a pathology score of 1 displayed mild blunting of villi (additional details in Methods section). No histopathology was detected in spleens, and no other signs of disease were noted. Note that a previous publication in which mice were reported to display pathologies following MNV infection used a different strain of MNV, an early time point (24 hours post-infection), and mice on a different background (129/Sv) . The lack of pathology in C57BL/6 mice persistently infected with MNV.CR6 is consistent with our previous publication. N = 5-7 mice/group. *p<0.05; **p<0.01. All graphs display means ± SEM.
Extended data figure 2
Extended data figure 2. MNV improves several deficiencies related to intestinal immunity in germfree mice
(a,b) Representative images of crypts from small intestinal tissue sections stained with H&E (a) and an anti-lysozyme antibody (b) harvested from GF, GF+MNV (mono-association), and Conv mice. Scale bar represents 1 μm. (c,d) Quantification of the above images show an increase in granules per Paneth cell (c) and lysozyme positive cells per crypt (d) in GF+MNV mice, indicating that the presence of MNV partially reverses Paneth cell abnormalities due to the absence of bacteria. N = 5 mice/group. (e-h) MNV mono-association of GF mice increases the number of CD4+ (e,g) and CD8+ (f,h) T cells (TCRβ+) in small intestinal (SI) lamina propria (LP) and mesenteric lymph nodes (MLN). (i-n) Flow cytometry analysis indicates that MNV mono-association of GF mice also increases the number of IFN-γ expressing CD4+ and CD8+ T cells in SI LP (i,k) and MLN (j,l). IL-17 expression by CD4+ T cells is also influenced by the presence of MNV (m,n). N = 10 (o,p) GF+MNV mice display increased IgA levels in SI tissue (o) and IgG2c levels in serum (p). N = 5 mice per group. (q) Percentage of T-bet+ cells in the SI LP after gating on live and lin cells remain unchanged by MNV infection of GF mice. N = 10 mice/group. ns = not significant; *p<0.05; **p<0.01; ***p<0.001, ****p<0.0001. All graphs display means ± SEM from at least two independent experiments
Extended data figure 3
Extended data figure 3. MNV infection of adult germfree mice has similar effects as mono-association of germfree mice from birth
6-8 week old adult GF mice were infected with MNV.CR6 for 10 days and examined for reversal of intestinal abnormalities. (a,b) Quantification of villi width (a) and granules per Paneth cell (b) in H&E-stained small intestinal sections. N = 5 mice/group. (c) Quantification of the number of CD3+ T cells in the SI LP by flow cytometric analysis. N = 6 mice/group. (d, e) Quantification of IFN-γ producing CD3+CD4+ (d) and CD3+CD8+ (e) T cells by flow cytometry. (f) Quantification of small intestinal IgA by ELISA. N = 6 mice/group. *p<0.05. All graphs display means ± SEM from at least two independent experiments.
Extended data figure 4
Extended data figure 4. The effect of MNV is specific to mice depleted of bacteria
Conv mice were infected with 3×10⁶ pfu of MNV.CR6 to determine the effect of MNV in the presence of commensal bacteria. (a,b) Representative images of H&E-stained small intestinal sections of Conv and Conv+MNV mice showing no aberrant changes after MNV infection. Scale bar represents 100 μm in (a) and 1 μm in (b). (c,d) Villi width (c) and Paneth cell granules (d) were quantified from at least 50 villi and 30 crypts of 2-5 mice per group. (e-h) Cell numbers of CD4+TCRβ+ (e), CD8+TCRβ+ (f), IFN-γ producing CD4+ (g), and IFN-γ producing CD8+ T cells in SI LP (h). N = 6 mice/group. ns = not significant, *p<0.05. All graphs display means ± SEM from at least two independent experiments.
Extended data figure 5
Extended data figure 5. MNV mono-association of GF mice increases colonic lymphocyte populations
(a-b) Representative images of H&E stained colonic small intestinal sections (a) of GF, GF+MNV (mono-association with MNV.CR6) and Conv mice. Scale bar represents 100 μm. (b) In above mice the crypt height was measured showing a significant difference in GF and Conv mice. (c) Percentages of NKT cells (CD1d+, TCRβ+) in colonic lamina propria of GF, GF+MNV and conv mice. (d-g) Percentages of CD4+TCRβ+ (d) and CD8+TCRβ+ cells (f), and percentages of IFN-γ producing CD4+ (e) and CD8+ T cells (g) in the colonic LP of GF, GF+MNV and conv mice. ns = not significant; *p<0.05; **p<0.01. N = 5 mice/group. All graphs display means ± SEM from at least two independent experiments.
Extended data figure 6
Extended data figure 6. The effect of MNV on the small intestine of GF mice is not strain specific
(a) Phylogenetic tree of the capsid sequences of indicated MNV strains. (b-d) Quantification of the villi width (b), granules (b) and CD3+ cells (d) in small intestinal sections prepared from Conv mice, GF mice, and GF mice infected with the indicated strains of MNV for 10 days. (e-h) Percentages of CD4+TCRβ+ (e) and CD8+TCRβ+ cells (g), and percentages of IFN-γ producing CD4+ (f) and CD8+ T cells (h) in the SI LP of indicated mice. N = 6 mice/group. ns = not significant *p<0.05; **p<0.01; ***p<0.001, ****p<0.0001. All graphs display means ± SEM from at least two independent experiments
Extended data figure 7
Extended data figure 7. Antibiotics treatment induces intestinal abnormalities that can be reversed by Bacteroides thetaiotamicron, Lactobacillus johnsonii or MNV.CR6
(a-g) Percentages of CD4+TCRβ+ (a) and CD8+TCRβ+ cells (b), and percentages of IFN-γ producing CD4+ (c) and CD8+ T cells (d) in SI LP in Conv mice with and without ABX. N = 5-10 mice/group. (e) Schematic of ABX treatment for introducing bacteria. After 14 days, ABX-containing water was replaced by regular water after 14 days. Mice were then inoculated with Bacteroides thetaiotamicron (B. theta), Lactobacillus johnsonii (L. johnsonii), or left untreated for 10 days prior to analyses. (f-h) Bacterial loads of colon (f), small intestine (g) and stool (h) of ABX-treated mice inoculated with B. theta or L. johnsonii for 10 days. (i,j) Small intestinal sections stained with H&E (i) or anti-CD3 antibody (j) indicating that inoculation with MNV.CR6, B. theta or L. johnsonii have similar effects on intestinal morphology. (k,l) Mice that received ABX during the whole course of the experiment with or without MNV (ABX and ABX+MNV) were compared to mice treated as in (e) using the previously described measurements: quantification of villi width (k), CD3+ cells per villi (l), and percentages of CD4+ (m), CD8+ (o), IFN-γ+CD4+ (n) and IFN-γ+CD8+ (p) T cells in the SI LP. N = 8 mice/group. ns: not significant, *p<0.05, **p<0.01, and ***p<0.001. All graphs display means ± SEM from at least two independent experiments.
Extended data figure 8
Extended data figure 8. Type I interferon induction by Poly(I:C) changes small intestinal architecture without affecting the T cell compartment
(a) qRT-PCR quantification of the type I interferon (IFN-I) inducible gene MX2 in small intestinal tissue of untreated GF mice, GF mice injected for 10 days with Poly(I:C), MNV.CR6 mono-associated GF mice (GF+MNV), and conv mice indicate that the poly(I:C) injection procedure induces an IFN-I response. Values represent fold induction of MX2 compared to untreated GF mice after normalizing to Gapdh. (b-d) Quantification of the villi width (b), granules (c) and CD3+ cells in the small intestine of same mice of H&E stained small intestinal sections. (e-h) Percentages of CD4+TCRβ+ (e), CD8+TCRβ+ cells (g), and IFN-γ producing CD4+ (f) and CD8+ (h) T cells from the SI LP. N = 6 mice/group. ns = not significant, ***p<0.001, and ****p<0.0001. All graphs display means ± SEM from at least two independent experiments.
Extended data figure 9
Extended data figure 9. MNV infection alters the host response to a super infection with C. rodentium
(a) Taxon-specific 16S qRT-PCR for Lactobacilli, Enterobacteriacea, Fusobacteria, Bacteroides and C. rodentium normalized to total 16S gene expression in stool of mice infected for 9 days with C. rodentium after ABX pretreatment with or without MNV.CR6 infection showing similar colonization of mice throughout the groups. (b-c) Fold induction of C. rodentium virulence factors tir (b) and ler (c) compared to the ABX group after normalization to recA in stool of indicated mice on day 9 post C. rodentium infection. (d-f) MNV.CR6 infection of ABX-treated mice prior to C. rodentium infection increases IgA levels in colonic tissue (d), stool (e), and IgG2c levels in serum (f) at day 9 post C. rodentium infection. (g-i) At day 9 post C. rodentium infection, ABX+MNV mice display elevated expression of IFN-γ (g), Gbp2 (h), and IL-10 (i) in colonic tissue compared to ABX mice. N = 5 mice/group. ns = not significant, *p<0.05, **p<0.01, and ***p<0.001. All graphs display means ± SEM from at least two independent experiments.
Figure 1
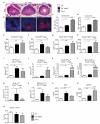
Figure 1. MNV reverses intestinal abnormalities in germfree mice
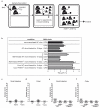
(a,b) Representative small intestinal (SI) sections from germfree (GF), GF mono-associated with MNV.CR6 (GF+MNV), or conventional (Conv) mice stained with H&E (a,b) or anti-CD3 antibody (c,d). Scale bar = 100 μm in (a,d) and 10 μm in (c,d). (e,f) Quantification of villi width (e) and CD3+ cells (f) per villus. 50 villi were quantified from 6-8 mice/group. (g,h) Total number of cells in the SI lamina propria (LP) and mesenteric lymph nodes (MLNs). N = 7-11 mice/group. (i) Flow cytometry analysis of SI LP cells for Gata3, Rorγt, IL-22, and IL-13 expression in live, lin cells (CD11b, CD19 and CD3). (j-m) Percent Gata3+ (j) and Rorγt+ (k), and ratio of Rorγt+ to Gata3+ (l) and IL-22+ to IL-13+ (m) lin cells from (i). N = 10 mice/group. (n) Summary of comparisons between GF, GF+MNV, and Conv mice. GF+MNV have similar villi width, T cell numbers in SI LP and MLNs, and antibody levels as conventional mice and are designated (++) indicating restoration to the maximal value. GF+MNV display partial increases in the number of Paneth cell granules, lysozyme expression, and IFN-γ expression. For ILC2s, GF mice display the maximal value and GF+MNV are similar to Conv. ns: not significant, *p<0.05; **p<0.01; ****p<0.0001. Graphs display means ± SEM from at least two independent experiments.
Figure 2
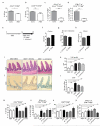
Figure 2. MNV reverses intestinal abnormalities induced by antibiotics
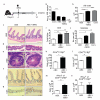
(a) Schematic for introducing MNV.CR6 into antibiotics (ABX)-treated mice (ABX+MNV). (b) 16S qRT-PCR analysis of stool from Conv, ABX-treated, ABX+MNV, and GF mice. n.d. = not detected. (c-g) Representative SI sections from ABX only and ABX+MNV mice stained with H&E or anti-CD3 antibody. Scale bars represent 100 μm in (c,f); 10 μm in (d,g) and 1 μm in (e). (h-j) Quantification of villi width (h), CD3+ cells per villus (i), and granules per Paneth cell (j) for the mice in (c-g). N = 6-10 mice/group. (k,l) Number of CD4+ (k) and CD8+ T cells (l) in SI LP of ABX and ABX+MNV mice. (m,n) Number of IFN-γ+ CD4+ (m) and CD8+ (n) T cells for mice in (k) and (l). *p<0.05; **p<0.01; ***p<0.001. Graphs display means ± SEM from at least two independent experiments
Figure 3
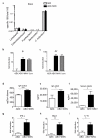
Figure 3. MNV induced changes are dependent on a type I interferon response
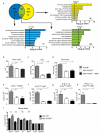
(a) RNA-seq analysis of SI tissue from GF mice inoculated with MNV.CR6, conventionalized with bacteria (Conv), or left untreated. Venn diagram represents number of transcripts displaying >1.4 fold enrichment upon conventionalization (I), inoculation with MNV.CR6 (II), or in both conditions (III) compared to untreated mice. Bar graphs represent gene ontology (GO) terms displaying association with the above gene sets. N = 3-4 mice. (b-d) Quantification of villus width (b), CD3+ cells per villus (c) and granules per Paneth cells (d) of IFNAR−/− mice that received ABX, ABX+MNV.CR6, or left untreated. 50 villi or 30 crypts per mouse were quantified. N = 6 mice/group. (e-h) Total number of CD4+ (e) and CD8+ (f) T cells, and IFN-γ+ CD4+ (g) and CD8+ (h) T cells in the SI LP of IFNAR−/− mice that received ABX, ABX+MNV.CR6, or left untreated. (i) Plaque forming units (pfu) of MNV.CR6 per cm tissue or per g stool from ABX-treated wild-type (WT) and IFNAR−/− mice 10 days post-infection. Dashed line denotes limit of detection. N = 3 mice/group. ns: not significant, *p<0.05; **p<0.01; ***p<0.001. Graphs display means ± SEM.
Figure 4
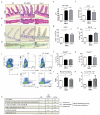
Figure 4. MNV protects antibiotics-treated mice from intestinal injury and Citrobacter rodentium super-infection
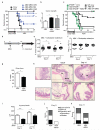
(a) Survival following DSS treatment of conventional mice (Conv), mice receiving ABX only, and mice receiving ABX and infected with indicated MNV strains. N = 12 mice/group. Statistical significance represents comparisons between ABX-treated mice infected with indicated MNV strains versus the ABX only group. (b) Colon length of Conv, ABX only, and ABX+MNV.CR6 mice on day 6 of DSS treatment. N = 3-5 mice/group. (c) Survival of conv WT and IFNAR−/−, and ABX-treated WT and IFNAR−/− mice with and without MNV.CR6 infection, treated with DSS. N = 7 mice/group. (d) Schematic of MNV.CR6 and C. rodentium co-infection in ABX-treated mice. ABX was removed prior to C. rodentium infection. (e,f) Quantification of weight loss (e) and colony forming units (cfu) in stool (f) in mice receiving treatment as illustrated in (d) on day 9 and 11 post-infection with C. rodentium. N = 5 mice/group. (g) Diarrhea from the above mice on day 9 post-infection. (h-k) Representative H&E-stained cecal sections (h) from above mice with arrows spanning hyperplasia and stars denoting ulceration and edema, quantification of hyperplasia (i), and histopathology score at day 9 and 11 (see methods) (j,k) (N = 5 mice/group). *p<0.05; **p<0.01; ***p<0.001. Bar graphs display means ± SEM and bars in (e) and (f) represent mean from at least two independent experiments.
Figure 5
Figure 5

Comment in

Similar articles

Cited by

References

    1. Honda K, Littman DR. The microbiome in infectious disease and inflammation. Annu Rev Immunol. 2012;30:759–95. - PMC - PubMed
    1. Duerkop BA, Hooper LV. Resident viruses and their interactions with the immune system. Nat Immunol. 2013;14:654–9. - PMC - PubMed
    1. Virgin HW. The Virome in Mammalian Physiology and Disease. Cell. 2014;157:142–150. - PMC - PubMed
    1. Norman JM, Handley SA, Virgin HW. Kingdom-agnostic Metagenomics and the Importance of Complete Characterization of Enteric Microbial Communities. Gastroenterology. 2014;146:1459–69. - PMC - PubMed
    1. Donaldson EF, Lindesmith LC, Lobue AD, Baric RS. Norovirus pathogenesis: mechanisms of persistence and immune evasion in human populations. Immunol Rev. 2008;225:190–211. - PubMed

Supplemental references

    1. Marchiando AM, et al. A deficiency in the autophagy gene Atg16L1 enhances resistance to enteric bacterial infection. Cell Host Microbe. 2013;14:216–24. - PMC - PubMed
    1. Strong DW, Thackray LB, Smith TJ, Virgin HW. Protruding domain of capsid protein is necessary and sufficient to determine murine norovirus replication and pathogenesis in vivo. J Virol. 86:2950–8. - PMC - PubMed
    1. Gonzalez-Hernandez MB, Bragazzi Cunha J, Wobus CE. Plaque assay for murine norovirus. J Vis Exp. :e4297. - PMC - PubMed
    1. Cadwell K, et al. A key role for autophagy and the autophagy gene Atg16l1 in mouse and human intestinal Paneth cells. Nature. 2008;456:259–63. - PMC - PubMed
    1. Robinson MD, McCarthy DJ, Smyth GK. edgeR: a Bioconductor package for differential expression analysis of digital gene expression data. Bioinformatics. 26:139–40. - PMC - PubMed

Publication types

MeSH terms

Associated data