. 2015 Feb 5;518(7537):107-10.
doi: 10.1038/nature13905. Epub 2014 Nov 17.

MicroRNA silencing for cancer therapy targeted to the tumour microenvironment

Affiliations

MicroRNA silencing for cancer therapy targeted to the tumour microenvironment

Christopher J Cheng et al. Nature. .

Abstract

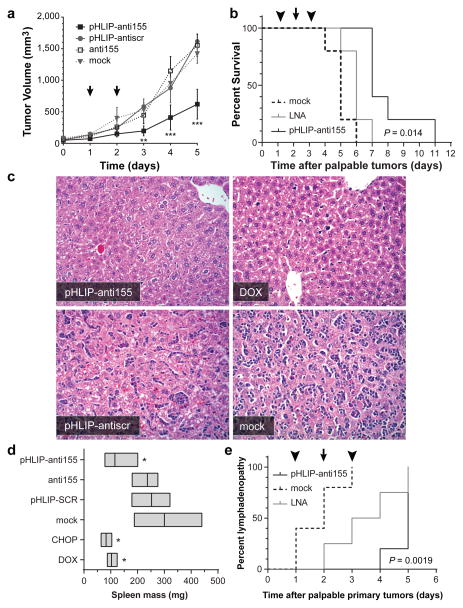
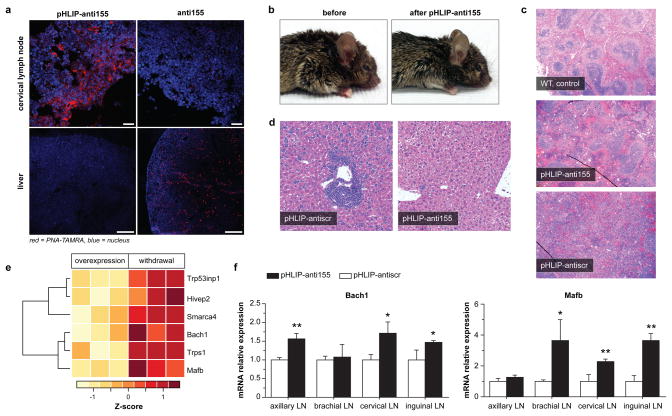
MicroRNAs are short non-coding RNAs expressed in different tissue and cell types that suppress the expression of target genes. As such, microRNAs are critical cogs in numerous biological processes, and dysregulated microRNA expression is correlated with many human diseases. Certain microRNAs, called oncomiRs, play a causal role in the onset and maintenance of cancer when overexpressed. Tumours that depend on these microRNAs are said to display oncomiR addiction. Some of the most effective anticancer therapies target oncogenes such as EGFR and HER2; similarly, inhibition of oncomiRs using antisense oligomers (that is, antimiRs) is an evolving therapeutic strategy. However, the in vivo efficacy of current antimiR technologies is hindered by physiological and cellular barriers to delivery into targeted cells. Here we introduce a novel antimiR delivery platform that targets the acidic tumour microenvironment, evades systemic clearance by the liver, and facilitates cell entry via a non-endocytic pathway. We find that the attachment of peptide nucleic acid antimiRs to a peptide with a low pH-induced transmembrane structure (pHLIP) produces a novel construct that could target the tumour microenvironment, transport antimiRs across plasma membranes under acidic conditions such as those found in solid tumours (pH approximately 6), and effectively inhibit the miR-155 oncomiR in a mouse model of lymphoma. This study introduces a new model for using antimiRs as anti-cancer drugs, which can have broad impacts on the field of targeted drug delivery.


Conflict of interest statement

The authors declare no conflict of interest.

Figures

Extended Data Figure 1
Extended Data Figure 1. Distribution of pHLIP to the renal system and lymph node metastases
a, Intravenous injection of A750-pHLIP distributes to the (white arrow) kidneys and (blue arrow) tumor in a representative mir-155LSLtTA subcutaneous flank model (n=3); time points indicate hours after a single injection of A750-pHLIP. Previous reports have observed systemic distribution of pHLIP to kidneys in other mouse models. Similarly, we speculate that the increased uptake of pHLIP peptide in the kidneys is due to excretion and increased acidity of renal tubule cells. Initially kidneys are highly enriched for pHLIP, which is gradually excreted while pHLIP shows a more steady accumulation in the tumor. b, Representative example showing A750-pHLIP distribution to the (white arrow) bladder and (yellow arrow) enlarged axillary lymph node 36 hours after intravenous administration into mir-155LSLtTA mice with lymphadenopathy (n=3). c, In addition to distributing to the (white arrow) primary mir-155LSLtTA flank tumor and (red arrow) kidneys, A750-pHLIP distributes to (black arrows) enlarged lymph nodes that resulted from metastatic spread; intravital fluorescence of A750-pHLIP was detected 48 hours after intravenous injection into nude transplant mice with conspicuous lymphadenopathy (shown is a representative animal from n=3).
Extended Data Figure 2
Extended Data Figure 2. Assessment of pHLIP-PNA conjugation and activity
a, HPLC elution profiles of (top) free PNA, (middle) reaction mixture of PNA and pHLIP-C(Npys), and (bottom) purifed pHLIP-PNA incubated in DTT. HPLC was used to purify pHLIP-PNA (black arrow). Shown is the fluorescence detection of TAMRA (ex/em: 540/575) which was conjugated to the PNA; samples were also detected by absorbance at 260 and 280 nm (data not shown). b, Tricine SDS-PAGE evaluation of pHLIP-PNA conjugation. Gel was visualized by (top) TAMRA fluoresence to detect labeled PNA and (bottom) Coomassie stain to detect both PNA and peptide. c, Gelshift analysis of pHLIP-antimiR-155 binding to miR-155 and disulfide reduction in the presence of DTT. d, High magnification confocal projections of A549 cells incubated with labeled pHLIP-antimiR (against control miR-182); scale bars represent 7.5 μm. The diffuse intracellular fluorescence is indicative of freely distributed antimiR throughout the cytosol—note that the presence of marginal punctate fluorescence at both pH levels suggests that endocytosis is probably an additional mode of cell entry. e, Toledo DLBCL lymphocytes were incubated with labeled pHLIP-anti155 at pH 6.2; fluorescence of a representative live cell is overlayed on a bright field micrograph; scale bars represent 2 μm. f, Flow cytometry analysis of Toledo cells incubated with labeled pHLIP-anti155; cell association was dependent on dose (top, pH 6.2) and pH (bottom, 500 nM dose). g, Inhibition of miR-155 demonstrated by derepression of a miR-155 dual luciferase sensor in KB cells. h, Inhibition of miR-21 demonstrated by desuppression of luciferase expression in A549 cells transfected with a Renilla luciferase sensor. Data are shown as mean ± s.d., with n = 3; statistical analysis performed with two-tailed Student’s t-test; two asterisks, P < 0.01; three asterisks, P < 0.001.
Extended Data Figure 3
Extended Data Figure 3. Pathology of the mir-155LSLtTA model of oncomiR addiction
a, Organomegaly in representative diseased mir-155LSLtTA mice: (top) conspicuous lymphadenopathy seen in the (black arrow) cervical and (white arrow) brachial lymph nodes; (middle) enlarged exposed (white arrows) cervical and (black arrows) axillary lymph nodes; and (bottom) enlarged (black arrows) spleen. b, Histopathology of mir-155LSLtTA mice: H&E stain of an enlarged spleen shows expansion of the white pulp by a nodular, neoplastic infiltrate; staining of the spleen shows CD20+ and CD10+ B cells of follicular center origin. Analysis of enlarged lymph nodes indicates DLBCL with lymph node architecture effaced by a confluent population of B220+ neoplastic lymphocytes and a Ki-67 proliferative index at nearly 100%, n=5. c, Tumor regression due to DOX-induced miR-155 withdrawal in a subcutaneous tumor model established from transplanted splenic mir-155LSLtTA lymphocytes; time points indicate hours after initial administration of DOX. With a cancer phenotype that is relevant to human disease yet can be modulated by miRNA silencing, this is an excellent model for evaluating miR-155-targeted therapies.
Extended Data Figure 4
Extended Data Figure 4. Experimental schematics for mouse tumor studies
a, Workflow for treatment of the mir-155LSLtTA subcutaneous flank model for the early endpoint and survival studies; Day 1 indicates time of first injection. For the “early treatment” experiments in Figure 3a,b,d–f,h and Extended Figure 5b,c mice were treated on days 1 and 2 with pHLIP-anti155, mock buffer, pHLIP-antiscr and anti155 only; fed DOX starting on day 3; or treated with CHOP regimen on days 2–4. For survival experiments in Figure 3c,g and Extended Figure 5a mice were treated on days 1–3 with pHLIP-anti155, LNA against miR-155, and mock buffer. b, Workflow for investgation of the mir-155LSLtTA model of lymphoma for the biodistribution and miR-155 silencing studies. For experiments in Figure 4a and Extended Data Figure 8a,b mice were treated on day 1 with pHLIP-anti155, anti155 only, and mock buffer. For experiments in Figure 4b–d,h and Extended Data Figure 8c–g mice were treated on day 1 and day 3 with pHLIP-anti155, pHLIP-antiscr, and mock buffer; or fed DOX 16 hours before harvest.
Extended Data Figure 5
Extended Data Figure 5. Administration of pHLIP-anti155 to mice with subcutaneous lymphoma flank tumors
a, Fold change in tumor size in response to miR-155 withdrawal and CHOP treatment (n=3); arrow represents initiation of DOX treatment (n=3, food pellets enriched with DOX at 2.3 gm/kg, Bio-Serv), white triangle represents CHOP treatment (systemic injection of Cyclophosphamide at 40 mg/kg, Doxorubicin at 3.3 mg/kg, and Vincristine at 0.5mg/kg; oral gavage of Prednisone at 0.2 mg/kg), gray triangles represent maintenance administration of Prednisone. b, Tumor growth response to systemically administered antimiR treatment; symbols represent intravenous injections of 2 (arrowhead) or 1 (arrow) mg/kg of pHLIP-conjugated antimiR-155, molar equivalent of phosphorothioated antimiR-155 LNA, or mock delivery solution; n = 5, data are shown as mean ± s.e.; statistical comparison of pHLIP-anti155 to LNA performed with two-way ANOVA; three asterisks, P < 0.001, four asterisks, P < 0.0001. c, Representative histologic analysis of kidneys (H&E, 100x magnification) harvested from early endpoint study, in which all of the mice from Figure 3a and Extended Data Figure 5a were sacrificed at the same time for analysis. Kidney sections reveal an absence of microscopic changes in treated animals (pHLIP-anti155) that would be indicative of renal toxicity (compare with normal renal sections in mock control). d, Representative pHLIP-antiscr-treated mouse (top) with primary flank tumor (white arrow) and enlarged inguinal lymph node (black arrow) compared to an untreated mouse with no tumor (bottom). e, Measurement of circulating lymphocytes in blood collected at time of sacrifice in early endpoint study; dotted line denotes average level in nude mice with no tumor. f, Although pHLIP interacts with the outer leaflet of lipid membranes, no significant change in red blood cell (RBC) levels was detected after intraveous treatment of mice with subcutaneous mir-155LSLtTA transplant tumors. This supports the specificity of pHLIP treatments on cells of tumor origin since pHLIP-antimiR treatments affect the levels of circulating lymphocytes (Extended Data Fig. 5e); data are shown as mean ± s.d.
Extended Data Figure 6
Extended Data Figure 6. Toxicology assessment of intravenously administered pHLIP-anti155 to C57BL/6J mice
a, Serum-based clinical chemistry evaluation of systemic toxicity with focus on liver and kidney function; dosing schedule consisted of injections of 2 mg/kg of pHLIP-anti155 (and equamolar dose of LNA) on Day 10 and 12, as well as 1 mg/kg on Day 11. Blood samples were serially harvested retro-orbitally on Day 0 (10 days before start of treatment), as well as 1 day and 14 days after treatment. b, Circulating white blood cell count collected 14 days after treatment. c, Mouse mass throughout duration of the study. d, Organ mass normalized to total body mass at time of harvest. a–d, For all analyses mock n = 4; pHLIP-anti155 n = 5, and LNA n = 5; dotted lines indicate typical wild type values for C57BL/6J mice.
Extended Data Figure 7
Extended Data Figure 7. Administration of pHLIP-anti155 to mice with KB oral squamous cell carcinoma xenograft tumors
a, Intravenous injection of pHLIP-anti155 (**) and phosphorothioated LNA against miR-155 (*) significantly enhanced survival compared to mock buffer treatment; n = 4 for all groups; arrowheads indicate injections of 2 mg/kg (or molar equivalent for LNA). Survival cutoff criteria included tumor volume greater than 1 cm3 or compassionate euthanisia, which was mandated for three mock-treated mice with ulcerated tumors. b, Fold change in tumor size in response to treatment; measurements were plotted until the mock negative control group was euthanized. c, Tumor bioluminescence in response to treatment; Day 8 represents luciferase activity before first injection. d, Representative images of tumor bioluminescence. Data are shown as mean ± s.e.; statistical analysis performed with (a) Mantel-Cox analysis or (c) two-tailed Student’s t-test, asterisk, P < 0.05; two asterisks, P < 0.01.
Extended Data Figure 8
Extended Data Figure 8. Administration of pHLIP-anti155 to mir-155LSLtTA mice with lymphoma
a, Quantification of liver distribution of TAMRA-labeled PNA delivered with and without conjugation to pHLIP; ImageJ was used to measure fluorescence from five confocal sections per mouse liver, n = 3 mice per group. b, Visualization of whole liver fluorescence after antimiR administration; pHLIP-anti155 liver fluorescence is similar to the autofluorescence seen in the mock group. c, Lymph node tumor burden (A = axillary, B = brachial, C = cervical, and I = inguinal lymph nodes); in these specific images taken from diseased littermates, pHLIP-antiscr-treated mice had a more than 3-fold larger aggregate lymph node mass (3.179 g) than pHLIP-anti155-treated mice (1.006 g). d,e, Size of harvested (d) spleens (n = 4) and (e) lymph nodes (axillary, brachial, cervical, and inguinal; n = 5) with respect to wild type; n < 6 (i.e. total number of treated mice) due to size data not collected. f,g, TUNEL analysis of treated cervical lymph nodes of mir-155LSLtTA mice (n = 6). h, Percent of white pulp in treated spleens; n = 6. i, Measurement of lymphocyte infiltration into liver; n = 6. j, Low magnification H&E images of livers from Fig. 4d. k, Flow cytometry analysis of B220-positive cells comprising the spleens of treated mice; B220 is typically a marker for B cells, though varied expression is seen on some T cells, natural killer cells, and macrophages, n=4. l, Representative H&E image of healthy kidneys from pHLIP-anti155-treated mice; n=6. Data are shown as mean ± s.d. (a, d, e, g, h) or mean ± s.e. (i); statistical analysis performed with two-tailed Student’s t-test; two asterisks, P < 0.01; four asterisks, P < 0.0001.
Extended Data Figure 9
Extended Data Figure 9. Differential gene expression analysis of miR-155 withdrawal
a, Experimental design for RNA-seq analysis of miR-155 addicted tumors compared to tumors undergoing miR-155 withdrawal and tumor regression. b, RNA-seq differential gene expression analysis of three independent tumors that overexpress miR-155 in comparison to three independent tumors undergoing DOX-induced miR-155 withdrawal; shown are all differentially expressed genes with FDR < 0.05; rows are clustered by euclidean distance measure. c, KEGG pathway analysis of significantly upregulated genes after miR-155 withdrawal. d, Selection of potential miR-155 targets involved in tumor regression. Intersection of genes (Group I) that are both predicted miR-155 targets (Supplementary Table 2) and overexpressed after miR-155 withdrawal from mir-155LSLtTA tumors (Supplementary Table 1) with genes inferred from three separate miR-155 target analyses. (Group II) Xu et al. used RNA-seq to compare Mutu I B cells that overexpress miR-155 with cells transformed with a control vector. (Group III) Gottwein et al. identified shared targets between miR-155 and a viral orthologue, miR-K12-11. (Group IV) Loeb et al. used HITS-CLIP to identify miR-155 targets without perfect seed matches in T cells. e, qPCR determination of gene expression levels in Toledo cells treated for 48 hours with 500 nM pHLIP-anti155 at pH 6.2; data are shown as mean ± s.d., n = 3; statistical analysis performed with two-tailed Student’s t-test, asterisk, P < 0.05.
Extended Data Figure 10
Extended Data Figure 10. Expression levels of putative targets in response to miR-155 silencing in mir-155LSLtTA mice
qPCR validation of potential miR-155 targets involved in tumor regression using mir-155LSLtTA mice with conspicous lymphadenopathy treated with (black bars) DOX for 16 hours compared to (white bars) untreated mice with lymphadenopathy; all samples are normalized to β-actin, n=3. Genes were selected based on criteria described in Supplementary Table 3. As shown in Fig. 4F, both Bach1 and Mafb have utility as biomarkers for miR-155 withdrawal-induced tumor regression.
Figure 1
Figure 1. Targeting miR-155-addicted lymphoma using pHLIP
a,b, Targeting distribution of pHLIP labeled with Alexa Fluor 750 (A750-pHLIP) 36 hours after systemic administration to (a) nude mouse with miR-155 flank tumors (n=3) and (b) mir-155LSLtTA mouse with lymphadenopathy (n=3), Alexa Fluor 750 conjugated to cysteine was the control. c, Schematic of pHLIP-mediated PNA antimiR delivery. (1) At pH less than 7, the C-terminus of pHLIP inserts across lipid bilayers, which facilitates delivery of attached antimiR-155. (2) The disulfide between pHLIP and antimiR-155 is reduced in the cytosol. (3) Intracellular antimiR-155 is free to inhibit miR-155.
Figure 2
Figure 2. Intracellular translocation of PNA antimiRs mediated by pHLIP
a, Confocal projections of A549 cells incubated with labeled pHLIP-antimiR (against control miR-182); scale bars represent 25 μm. b, Effects of miR-155 inhibition on KB cell viability; all data are normalized to cells treated with vehicle buffer. Data are shown as mean ± s.d., with n = 3; statistical analysis performed with two-way ANOVA; three asterisks, P < 0.001.
Figure 3
Figure 3. Targeted silencing of miR-155 has beneficial effects in mice with subcutaneous mir-155LSLtTA tumors
a, Tumor growth response to treatment; arrows represent 1 mg/kg PNA dose per intravenous injection; all with n = 3, except for pHLIP-anti155 group with n=4. b, Survival in response to antimiR treatment; cutoff criteria include tumor volume greater than 1 cm3 or clinically mandated euthanasia. Symbols represent 2 (arrowhead) or 1 (arrow) mg/kg intravenous injections; LNA is a fully phosphorothioated LNA antimiR against miR-155; n = 4 for all groups; (*) for pHLIP-anti155 compared to LNA. c, Representative histologic analysis of livers (H&E, 200x magnification) harvested from early endpoint study (Fig. 3a and Extended Data Fig. 5a). d, Mass range of spleens from mice in early endpoint study; all with n = 3, except for pHLIP-anti155 group with n=4. e, Time to development of conspicuous lymphadenopathy in survival study; (**) for pHLIP-anti155 compared to mock. Data are shown as mean ± s.d., statistical analysis performed with (a) two-way ANOVA or (b,e) Mantel-Cox test or (d) two-tailed Student’s t-test; asterisk, P < 0.05; two asterisks, P < 0.01; three asterisks, P < 0.001.
Figure 4
Figure 4. Delivery of pHLIP-anti155 to mir-155LSLtTA mice with lymphadenopathy
a, Confocal projections of systemic, tumor-targeted delivery of antimiR-155 to mir-155LSLtTA mice using pHLIP; scale bars represent 25 μm (top, enlarged cervical lymph node) and 250 μm (bottom, liver), n = 3. b, Representative mir-155LSLtTA mouse before and after treatment with pHLIP-anti155, n = 6. c,d, Representative H&E analysis of (c) spleens and (d) livers harvested from diseased littermate mir-155LSLtTA mice after treatment, n = 6, control spleen represents wild type mice with no treatment. e, Heatmap showing selected upregulated genes upon miR-155 withdrawal. f, qPCR determination of gene expression levels in lymphoid tissue from mir-155LSLtTA mice. Data are shown as mean ± s.d., n = 3; statistical analysis performed with two-tailed Student’s t-test, asterisk, P < 0.05; two asterisks, P < 0.01.

Comment in

References

    1. He L, Hannon GJ. MicroRNAs: small RNAs with a big role in gene regulation. Nat Rev Genet. 2004;5:522–531. - PubMed
    1. Calin GA, Croce CM. MicroRNA signatures in human cancers. Nat Rev Cancer. 2006;6:857–866. - PubMed
    1. Esquela-Kerscher A, Slack FJ. Oncomirs - microRNAs with a role in cancer. Nat Rev Cancer. 2006;6:259–269. - PubMed
    1. Medina PP, Nolde M, Slack FJ. OncomiR addiction in an in vivo model of microRNA-21-induced pre-B-cell lymphoma. Nature. 2010;467:86–90. - PubMed
    1. Babar IA, et al. Nanoparticle-based therapy in an in vivo microRNA-155 (miR-155)-dependent mouse model of lymphoma. Proc Natl Acad Sci USA. 2012;109:E1695–E1704. - PMC - PubMed

Publication types

MeSH terms

Associated data