. 2014 Nov 19;9(11):e113428.
doi: 10.1371/journal.pone.0113428. eCollection 2014.

Involvement of IKAP in peripheral target innervation and in specific JNK and NGF signaling in developing PNS neurons

Affiliations

Involvement of IKAP in peripheral target innervation and in specific JNK and NGF signaling in developing PNS neurons

Anastasia Abashidze et al. PLoS One. .

Abstract

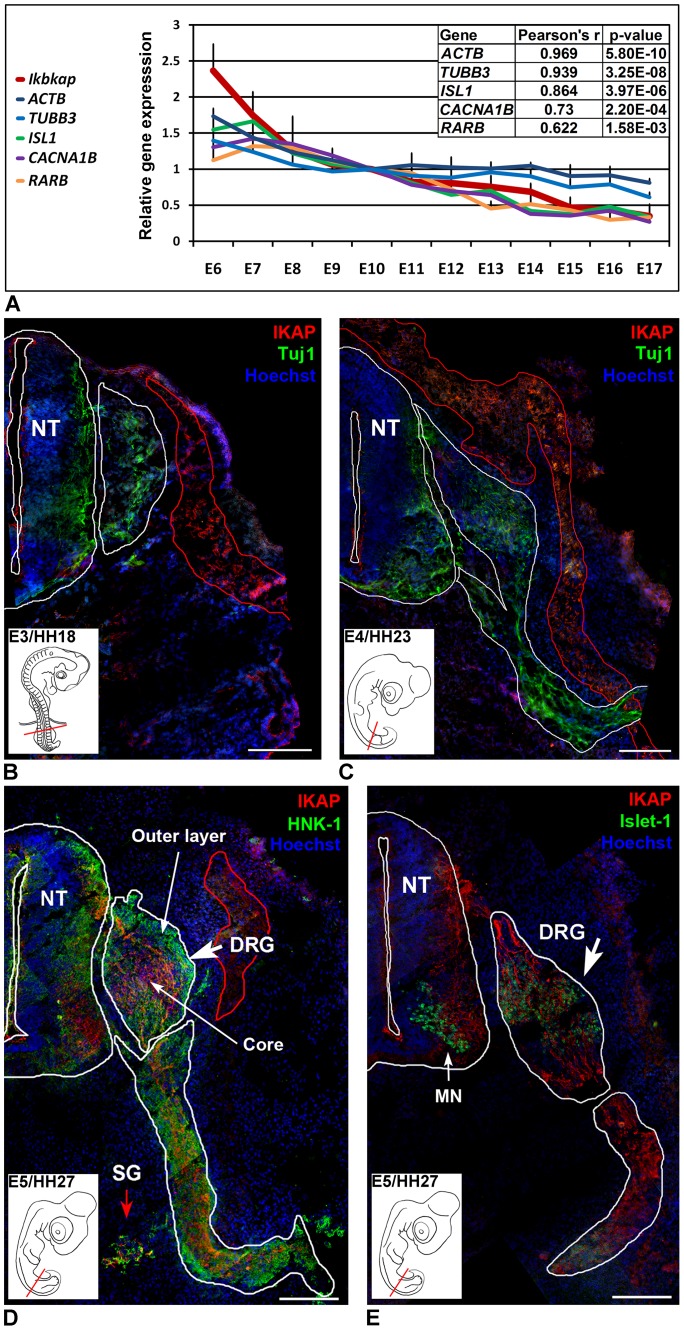
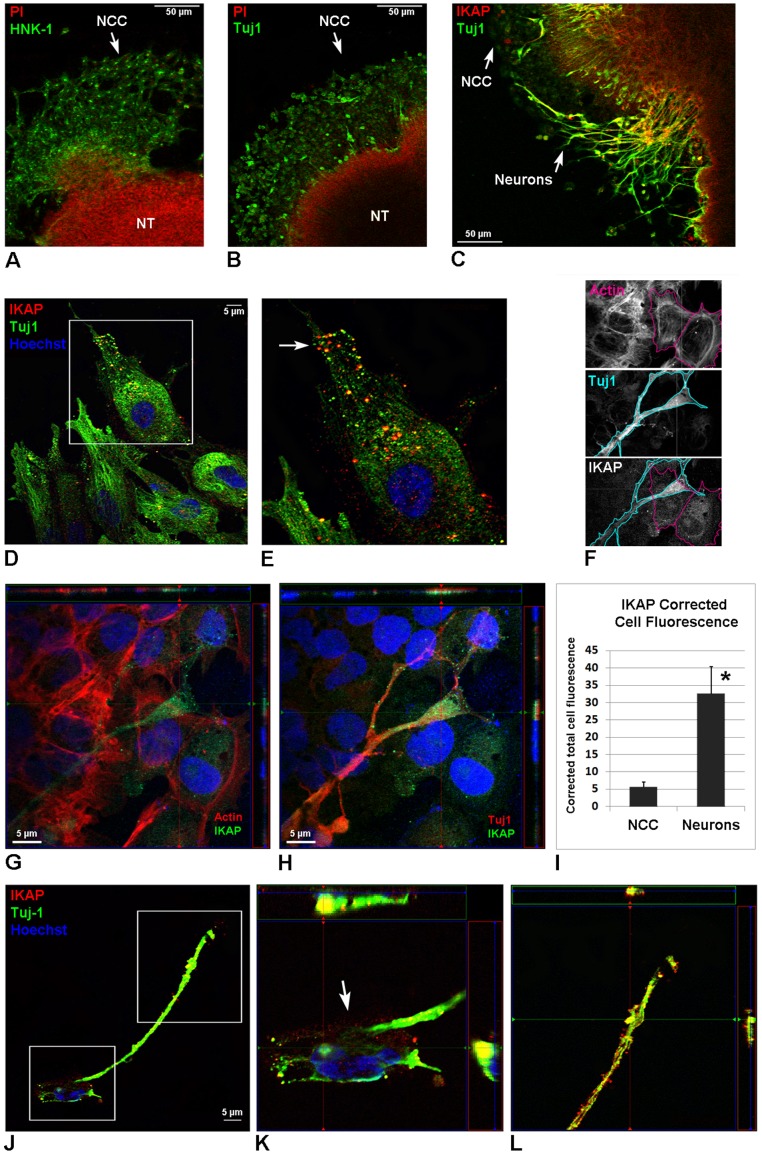
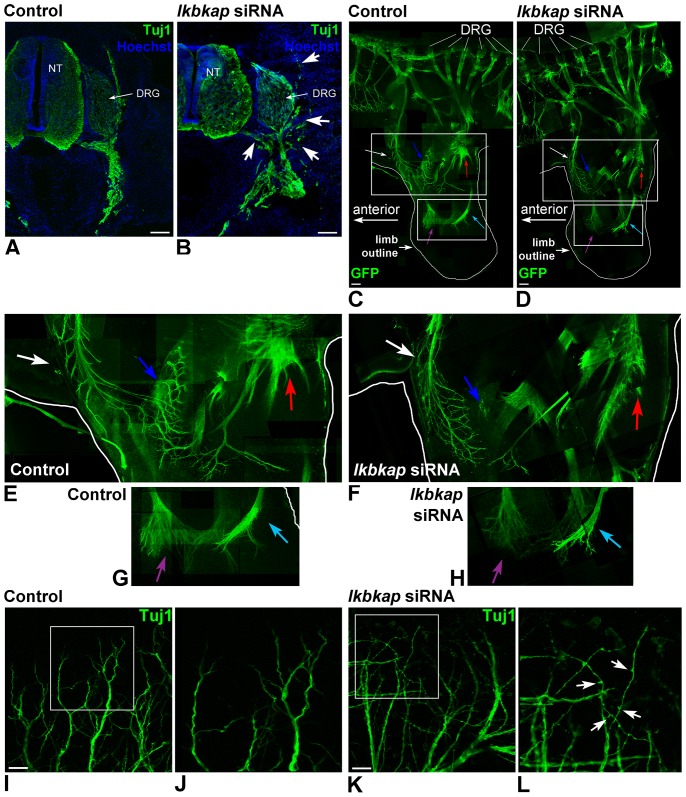
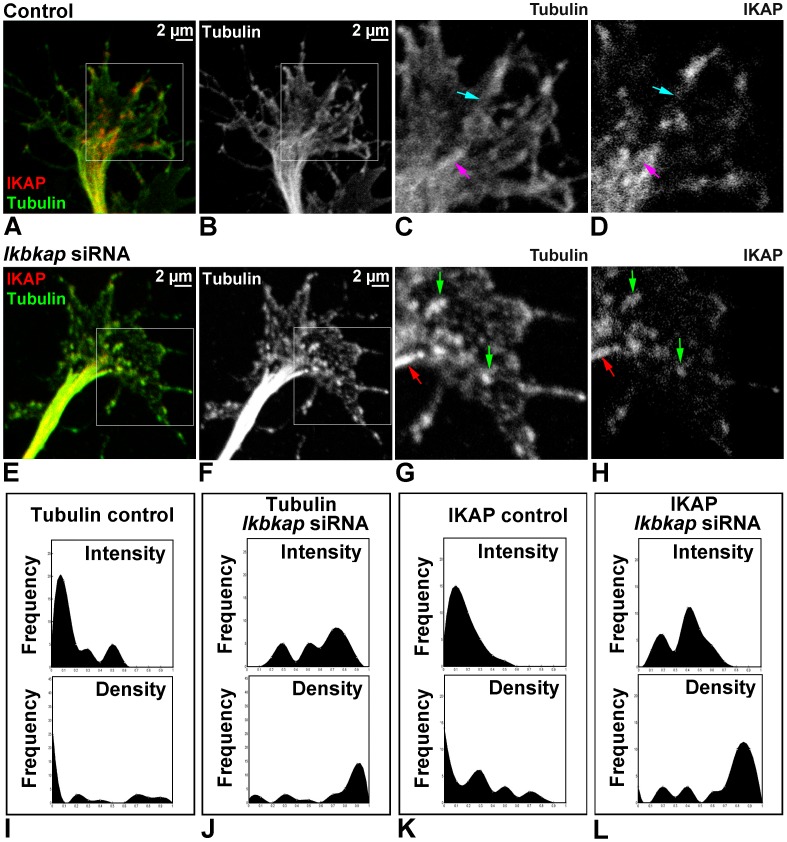
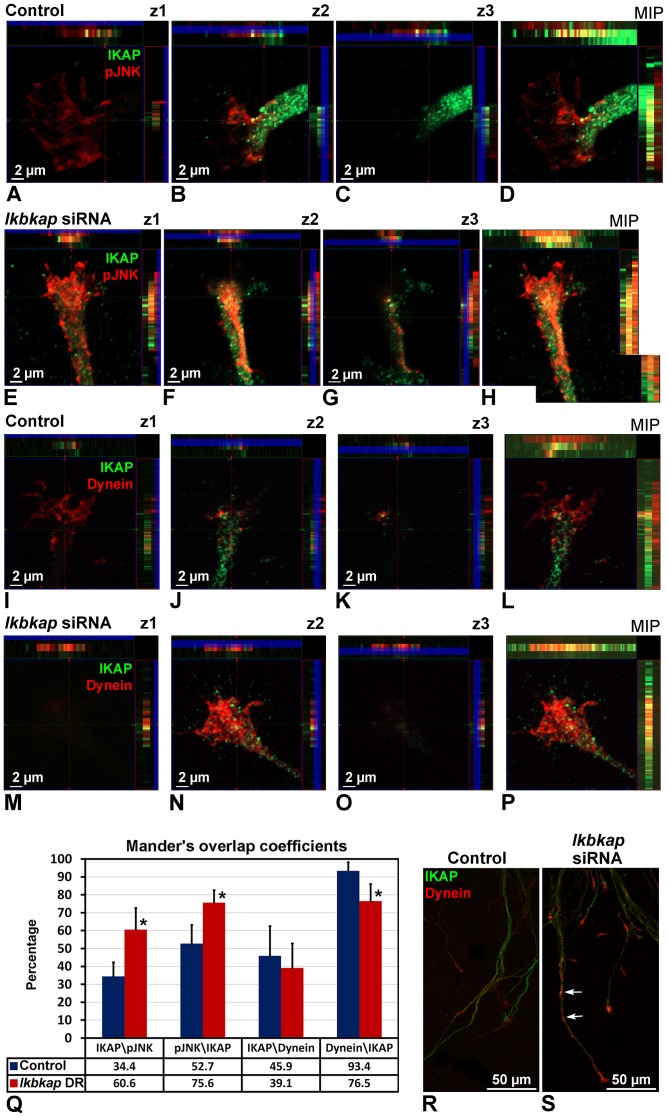
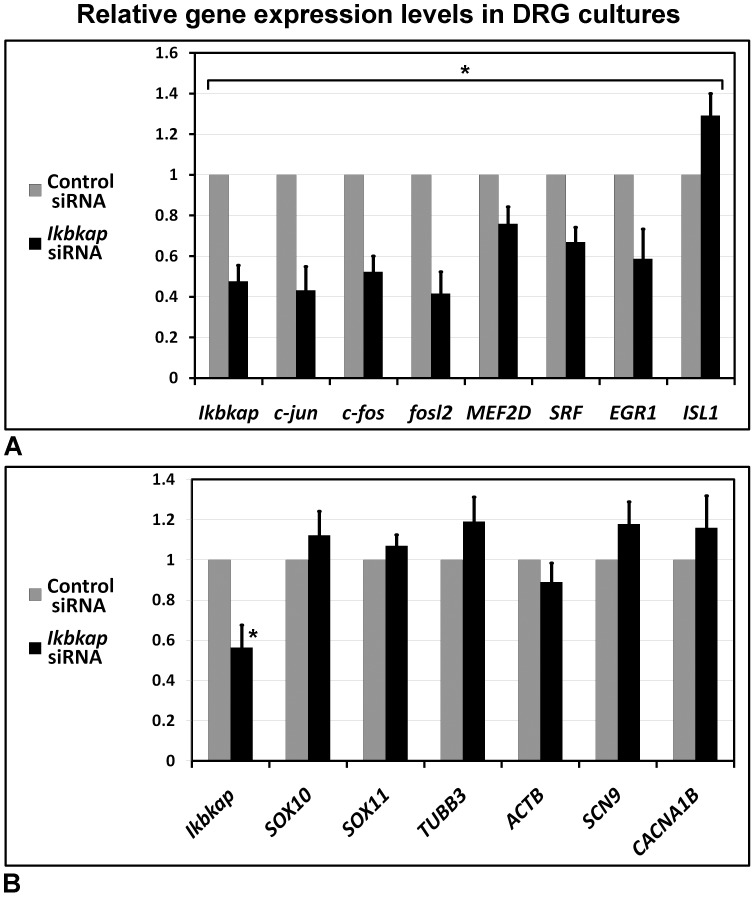
A splicing mutation in the ikbkap gene causes Familial Dysautonomia (FD), affecting the IKAP protein expression levels and proper development and function of the peripheral nervous system (PNS). Here we attempted to elucidate the role of IKAP in PNS development in the chick embryo and found that IKAP is required for proper axonal outgrowth, branching, and peripheral target innervation. Moreover, we demonstrate that IKAP colocalizes with activated JNK (pJNK), dynein, and β-tubulin at the axon terminals of dorsal root ganglia (DRG) neurons, and may be involved in transport of specific target derived signals required for transcription of JNK and NGF responsive genes in the nucleus. These results suggest the novel role of IKAP in neuronal transport and specific signaling mediated transcription, and provide, for the first time, the basis for a molecular mechanism behind the FD phenotype.


Conflict of interest statement

Competing Interests: The authors have declared that no competing interests exist.

Figures

Figure 1
Figure 1. IKAP expression in the developing PNS.
(A) QRT-PCR analysis of expression levels of ikbkap, neural specific βIII-Tubulin (TUBB3), β-Actin (ACTB), Islet-1 (ISL1), Retinoic Acid receptor β (RARB), and CACNA1B in developing lumbar DRG of E6-E18 embryos. E10 was used arbitrarily as normalizing time point reference. Data from three independent experiments are presented as means ±SD, N = 5 embryos at each time point. Correlation data was obtained following Pearson's correlation test. (B–E) Tiling reconstruction showing IKAP expression in transverse sections of E3/HH18-E5/HH27 embryos at the hind limb level, stained with Hoechst 33342 to visualize nuclei (blue), and IKAP specific antibody (red) in combination with Tuj1 (B–C, green), HNK-1 (D, green), or with Islet-1 (E, green). Size bars 100 µm. NT- Neural tube, DRG – Dorsal Root Ganglia, SG – Sympathetic Ganglia, MN – motor neurons.
Figure 2
Figure 2. Characterization of IKAP expression in differentiating NCC neuronal cultures.
Neural tubes were explanted from the embryos just before the onset of NCC migration (E2/HH11), allowing NCC to migrate and differentiate in culture. (A–B) Migrating NCC after 24 h in culture stained for Propidium iodide (PI) to visualize nuclei, specific NCC marker HNK-1 (A), neural specific tubulin (Tuj1, B). (C) Migrating NCC after 72 hours in culture stained Tuj1 and PI. (D–E) IKAP expression in migrating NCC (24 h in culture) show vesicular pattern and colocalized with Tuj1 at the leading edge of the cell (E, white arrow). Boxed area in D is magnified in E. (F–H) Immunofluorescence confocal images of quadruple stained cells show IKAP staining with Alexa-488 conjugated secondary antibody (green in G and H) either in combination with Phalloidin conjugated with TRITC for Actin labeling (red in G) or together with Tuj1 stained with Alexa 647 conjugated secondary antibody (red in H). Hoechst 33342 (blue) was added to stain nuclei in these images. (F) For IKAP fluorescence quantification in NCC versus developing neurons (I), NCC cell borders were selected using actin staining (upper panel), neuron cell borders were selected using Tuj1 staining (middle panel), and these cell borders were overlaid on IKAP stained picture (bottom panel). Then Area, Integrated Density, and Mean Gray Value were measured in the cells using ImageJ, and Corrected Total Cell Fluorescence (CTCF) was calculated as described in methods from a sample number of 15 neurons versus 15 NCC. (G–H) Two images of differentiating NCC showing the same confocal plane (72 h in culture). Note that IKAP levels increase in the outgrowing neurites of differentiating neurons, and that IKAP is colocalized with Tuj1 (H, red), but not with actin (G, red). (I). Corrected Total Cell Fluorescence (CTCF) in NCC and differentiating neurons. Data are represented as mean ±SD. (J–L) IKAP expression in NCC derived neurons show vesicular pattern and predominantly is localized along Tuj1 positive extending filaments within growing neurites (L), and to lesser extent at the soma region of the cell (K, indicated by an arrow). Boxed areas in J are magnified in K and L. (G–H) and (K–L) show a set of orthogonal slices, where the middle panel represent the xy plane, left panel represent the yz plane, and upper panel represent the xz plane.
Figure 3
Figure 3. Ikbkap downregulation affects target innervation in vivo.
(A–B) The embryos were electroporated with control or ikbkap specific siRNA at E2/HH11, and allowed to develop until E6. The transverse serial sections were stained with Tuj1 antibody to display neuronal patterns and with Hoechst 33342 to visualize nuclei. In ikbkap downregulated embryos abnormal peripheral nerve projections are visualized at various positions (B, white arrows) compared to control embryos (A), n = 5 embryos per treatment. Size bar 100 µm. (C–H) To visualize growing nerves, the embryos were co-electroporated with control siRNA plus pCAAG GFP expressing vector or ikbkap specific siRNA plus pCAAG GFP expressing vector at E2/HH11, and allowed to develop until E6 (N = 6). Representative tiling reconstruction with serial z-planes composed of multiple images of GFP labeled nerves taken at the lumbar and hindlimb regions (outlined in white) of control siRNA treated embryos are shown in (C, E, G), and of ikbkap specific siRNA treated embryos in (D, F, H). Boxed areas in C and D are magnified in E–G and F–H respectively. Size bar 100 µm. (I–L) Close up of skin innervations in abdomen region of Tuj1 stained whole mount embryos from previous experiment. I, J – control siRNA treated embryos; K, L – ikbkap specific siRNA treated embryos. White arrows indicate abnormal branching points. Size bar 10 µm.
Figure 4
Figure 4. Ikbkap downregulation affect β-tubulin structure in growth cone.
DRG from lumbar region of E10 embryos were electroporated with control or ikbkap specific siRNA, grown on laminin for 48 hours as described in methods, and stained with IKAP (red) and β-tubulin (green) antibodies. (A–H) Representative confocal images of the growth cone areas of control (A–D) and ikbkap siRNA treated (E–H) neurons. Boxed areas in A–B and E–F are magnified in C–D and G–H respectively. Colored arrows indicate IKAP localization along stable tubulin fibers (magenta arrows in C and D; red arrows in G and H), and along dynamic tubulin fibers (light blue arrows in C and D; green arrows in G and H). (I–L) Histograms representing the fluorescence intensities and densities of IKAP and β-tubulin signals at the growth cone area measured from multiple images by custom image analysis tool (see Methods).
Figure 5
Figure 5. Ikbkap downregulation affects pJNK and dynein localization in growth cones.
DRG from lumbar region of E10 embryos were electroporated with control or ikbkap specific siRNA, grown on laminin for 48 hours as described in methods, and stained for IKAP, phosphorylated JNK (pJNK) (A–H), or dynein (I–P, R, S). Confocal analysis of three serial z-sections of the growth cone was performed in images from three independent experiments. The total depth of the image z-stacks is 2.66 µm, z1 represents 0–0.88 µm, z2 represents 0.88–1.77 µm, and z3 represents 1.77–2.66 µm slices. (Q) Mander's overlap coefficient of IKAP-pJNK and IKAP-dynein localization was performed using ImageJ colocalization plugin (JACoP) as described in methods. Data are presented as mean ±SD. (R, S) Dynein accumulation along the developing neurites is observed in ikbkap downregulated cultures (S, arrows) compared with control neurites (R).
Figure 6
Figure 6. Ikbkap downregulation affects expression of pJNK and NGF responsive genes in DRG neurons.
DRG from the lumbar region of E10 embryos were electroporated with control or ikbkap specific siRNA, grown on laminin for 48 hours, and processed for QRT-PCR as described in methods. Data are presented as relative gene expression levels of mean ±SD.

Similar articles

Cited by

References

    1. Riley CM, Day RL, Greeley DMCL, William S (1949) Central Autonomic Dysfunction with defective Lacrimation: Report of five Cases. Pediatrics 3: 468. - PubMed
    1. Axelrod FB (2004) Familial Dysautonomia. Muscle Nerve 29: 352–363. - PubMed
    1. Anderson SL, Coli R, Daly IW, Kichula Ea, Rork MJ, et al. (2001) Familial dysautonomia is caused by mutations of the IKAP gene. Am J Hum Genet 68: 753–758 10.1086/318808 - DOI - PMC - PubMed
    1. Slaugenhaupt SA, Blumenfeld A, Gill SP, Leyne M, Mull J, et al. (2001) Tissue-specific expression of a splicing mutation in the IKBKAP gene causes familial dysautonomia. Am J Hum Genet 68: 598–605. - PMC - PubMed
    1. Cuajungco MP, Leyne M, Mull J, Gill SP, Lu W, et al. (2003) Tissue-specific reduction in splicing efficiency of IKBKAP due to the major mutation associated with familial dysautonomia. Am J Hum Genet 72: 749–758 10.1086/368263 - DOI - PMC - PubMed

Publication types

MeSH terms