. 2015 Jul;53(1):74-86.
doi: 10.1165/rcmb.2014-0343OC.

A pneumocyte-macrophage paracrine lipid axis drives the lung toward fibrosis

Affiliations

A pneumocyte-macrophage paracrine lipid axis drives the lung toward fibrosis

Freddy Romero et al. Am J Respir Cell Mol Biol. 2015 Jul.

Abstract

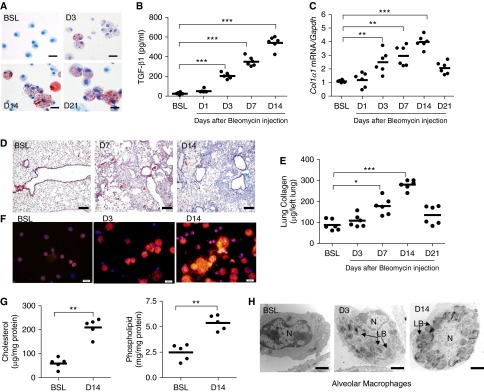
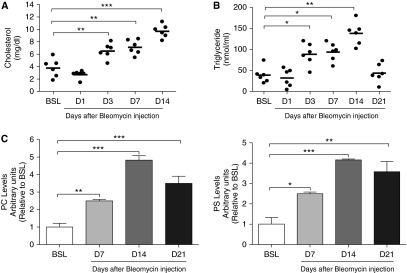
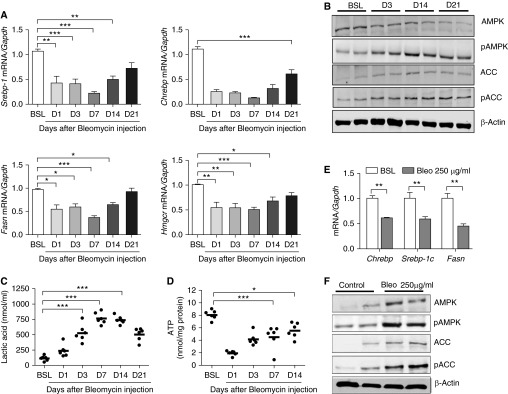
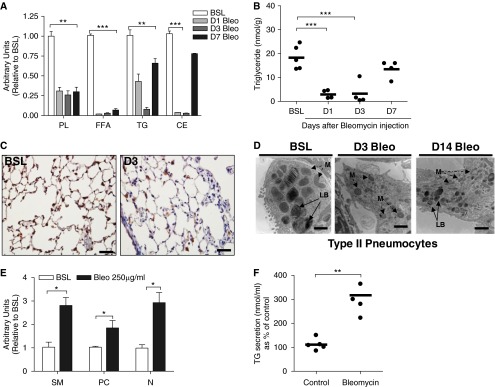
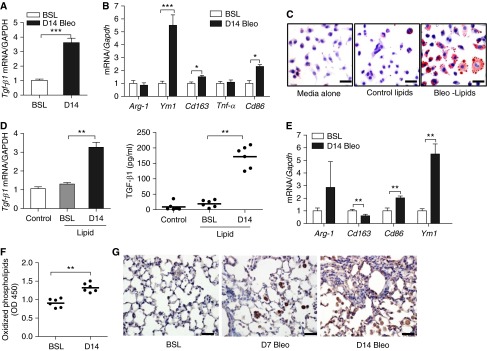
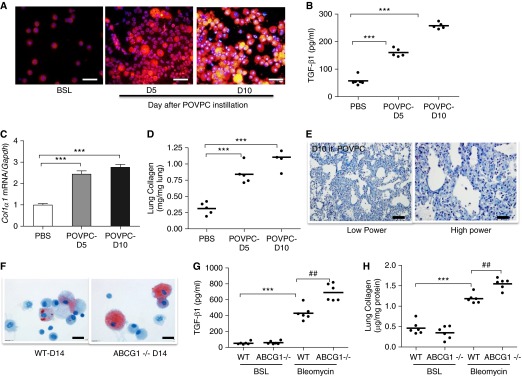
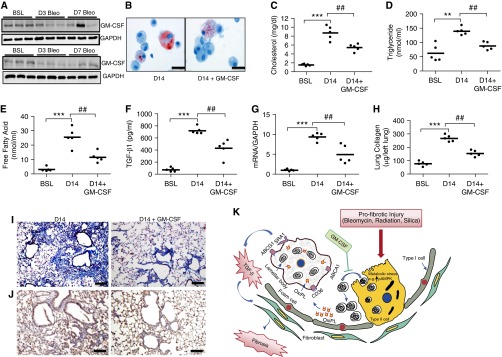
Lipid-laden macrophages, or "foam cells," are observed in the lungs of patients with fibrotic lung disease, but their contribution to disease pathogenesis remains unexplored. Here, we demonstrate that fibrosis induced by bleomycin, silica dust, or thoracic radiation promotes early and sustained accumulation of foam cells in the lung. In the bleomycin model, we show that foam cells arise from neighboring alveolar epithelial type II cells, which respond to injury by dumping lipids into the distal airspaces of the lungs. We demonstrate that oxidized phospholipids accumulate within alveolar macrophages (AMs) after bleomycin injury and that murine and human AMs treated with oxidized phosphatidylcholine (oxPc) become polarized along an M2 phenotype and display enhanced production of transforming growth factor-β1. The direct instillation of oxPc into the mouse lung induces foam cell formation and triggers a severe fibrotic reaction. Further, we show that reducing pulmonary lipid clearance by targeted deletion of the lipid efflux transporter ATP-binding cassette subfamily G member 1 increases foam cell formation and worsens lung fibrosis after bleomycin. Conversely, we found that treatment with granulocyte-macrophage colony-stimulating factor attenuates fibrotic responses, at least in part through its ability to decrease AM lipid accumulation. In summary, this work describes a novel mechanism leading to foam cell formation in the mouse lung and suggests that strategies aimed at blocking foam cell formation might be effective for treating fibrotic lung disorders.

Keywords: alveolar macrophages; foam cells; oxidized phospholipids; pulmonary fibrosis; type II pneumocytes.


Figures

Figure 1.
Figure 1.
Bleomycin induces foam cell formation in the lung. (A) Oil Red O staining of alveolar macrophages (AMs) cytospun onto glass slides. AMs were isolated from bronchoalveolar lavage (BAL) fluid at baseline (BSL) and at Day (D) 3, D14, and D21 after bleomycin (n = 5, each group). Scale bar, 20 μm. (B) Transforming growth factor (TGF)-β1 in BAL fluid at BSL and at D1, D3, D7, and D14 after bleomycin (n = 6, each group). (C) Quantitative messenger RNA (mRNA) expression for Col1α1 gene in whole lung at BSL and at D1, D3, D7, D14, and D21 after bleomycin administration. Gene expression is normalized to glyceraldehyde 3-phosphate dehydrogenase (Gapdh) (n = 6, each group). (D) Trichrome staining of lung at BSL and D7 and D14 after bleomycin administration. Increases in collagen (blue) are evident in lung at D7 and D14 after bleomycin (n = 3) but not at D3 after injury (data not shown). The same magnification was used in all images (scale bar, 75 μm). (E) Quantification of lung collagen (Sircol assay) at BSL and at D3, D7, D14, and D21 after bleomycin administration (n = 6). (F) Nile red staining of AMs after cells were cytospun onto glass slides. AMs were isolated at BSL and at D3 and D14 after bleomycin (n = 5). Scale bar, 20 μm. (G) Cholesterol and phospholipid content in freshly isolated AMs from BSL and D14 bleomycin-injured mice (n = 5). (H) Representative electromyographic images of AMs at BSL and at D3 and D14 after bleomycin. Marked intracellular phospholipid accumulation (black onion-skin structures consistent with lamellar bodies [LB]) is evident in AMs at D3 and D14 after bleomycin injury (scale bar, 2 μm). The nucleus is labeled N. Data are expressed as mean ± SE. In B, C, and E, the statistical significance was assessed with one-way ANOVA; in G, Student’s t test was used. *P < 0.05, **P < 0.01, and ***P < 0.001 versus the BSL group.
Figure 2.
Figure 2.
Profibrotic injury promotes surfactant lipid accumulation in BAL fluid after bleomycin. (A) Total cholesterol in BAL fluid at BSL and at D1, D3, D7, and D14 after bleomycin (n = 6). (B) Triglyceride concentration in BAL fluid at BSL and at D1, D3, D7, and D14 days after bleomycin (n = 6). (C) Thin-layer chromotography performed for phospholipids on BAL fluid from mice (n = 6) at BSL and at D7, D14, and D21 after bleomycin. Phosphatidylcholine (PC) and phosphatidylserine (PS) are increased at D7, D14, and D21 (P < 0.01) after bleomycin (based on densitometry measurements). Data are expressed as mean ± SE. The statistical significance was assessed with a one-way ANOVA test. *P < 0.05, **P < 0.01, and ***P < 0.001 versus the BSL group.
Figure 3.
Figure 3.
Bleomycin induces metabolic stress in alveolar type II epithelial (ATII) cells. (A) Quantitative mRNA expression for sterol-response element binding protein (Srebp-1), carbohydrate response element binding protein (Chrebp), fatty acid synthase (Fasn), and 3-hydroxy-3-methylglutaryl coenzyme A reductase (Hmgcr) at BSL and at various time points after bleomycin (Bleo; n = 6). (B) Western blot analysis for total adenosine monophosphate–activated protein kinase (AMPK) and phosphorylated AMPK (pAMPK) (Thr172) and acetyl CoA carboxylase (ACC) (Ser79) in whole lung homogenates at BSL and at D3, D14, and D21 after bleomycin. The image is representative of two independent experiments. (C) Lactic acid in BAL fluid at BSL and at D1, D3, D7, D14, and D21 after bleomycin (n = 6). (D) Tissue ATP concentration in whole lung at BSL and at D1, D3, D7, and D14 after bleomycin (n = 6). (E) Quantitative mRNA expression for Chrebp, Srebp-1, and Fasn in MLE-12 cells cultured in the presence or absence of bleomycin (n = 3 independent experiments). (F) Western blot analysis for total and pAMPK and ACC in MLE-12 cells cultured in the presence or absence of bleomycin. The image is representative of at least two independent experiments. Data are expressed as mean ± SE. In A, C, and D, the statistical significance was assessed with one-way ANOVA; Student’s t test was used in E. *P < 0.05, **P < 0.01, and ***P < 0.001 versus the BSL group. pACC = phosphorylated acetyl CoA carboxylase.
Figure 4.
Figure 4.
Bleomycin injury induces surfactant release from ATII cells. (A) Thin-layer chromatography for tissue lipids (phospholipids [PL], free fatty acids [FFA], triglycerides [TG], and cholesterol esters [CE]) in whole lung at BSL and at D1, D3, and D7 after bleomycin. By densitometry, PL, FFA, TG, CE are decreased at D1, D3, and D7 after bleomycin (n = 5, each group). (B) Triglyceride concentration in whole lung at BSL and at D1, D3, and D7 after bleomycin (n = 4, each group). (C) Immunohistochemical staining for ABCA3. Staining for ABCA3 (brown) is decreased on D3 after bleomycin. The same magnification was used in all images detection with a 40× objective lens. Scale bar, 100 μm. (D) Representative electron microscopic images of ATII cells at BSL and at D3 and D14 after bleomycin. Marked reduction in the size of LBs is observed in ATII cells after bleomycin. Scale bar, 2 μm. M, mitochondria. (E) Bleomycin promotes release of phospholipids from MLE-12 cells. By densitometry, PC, sphingomyelin (SM), and neutral lipids (N) are increased after bleomycin treatment (P < 0.05). The image is representative of two independent experiments. (F) Bleomycin promotes release of triglycerides from MLE-12 cells (n = 5 independent experiments). Data are expressed as mean ± SE. In A through D, the statistical significance was assessed with one-way ANOVA; a Student’s t test was used in E and F. *P < 0.05, **P < 0.01, and ***P < 0.001 versus the BSL group.
Figure 5.
Figure 5.
Foam cell formation promotes macrophage production of TGF-β1. (A) Quantitative mRNA expression for Tgf-β1 in AMs isolated from lung at BSL and at 14 days after bleomycin (n = 6). (B) Quantitative mRNA expression for Arg-1, Cd163, Cd86, and Ym1 in AMs isolated from BAL fluid at BSL and at 14 days after bleomycin (n = 6). (C) Oil Red O staining of MH-S cells after culture in media alone or in media supplemented with surfactant lipid extracts from the lungs of mice at BSL or at 14 days after bleomycin. Scale bar, 20 μm. (D) Measurement of Tgf-β1 transcript (left) and protein (right) in MH-S cells. Cells were cultured in media alone or in media supplemented with lipid extracts from uninjured or Day 14 bleomycin-injured lungs (n = 3 independent experiments). (E) Quantitative mRNA expression for Arg-1, Cd163, Cd86, and Ym1 in MH-S cells. Cells were cultured in media alone or in media supplemented with lipid extracts from uninjured or from Day 14 bleomycin-injured lungs (n = 3 independent experiments). (F) ELISA for oxidized phosphatidylcholine (oxPc) in BAL fluid at BSL and at 14 days after bleomycin (n = 5). (G) Immunohistochemical staining for oxPc (brown stain) in lung at BSL and at 7 and 14 days after bleomycin. Staining for oxPc is increased in AMs after bleomycin. The same magnification was used in all images detection with a 40× objective lens. Data are expressed as mean ± SE. Scale bar, 20 μm. In A through F, the statistical significance was assessed with Student’s t test; one-way ANOVA was used in B and E. OD, optical density. *P < 0.05, **P < 0.01, and ***P < 0.001 versus the BSL group or control.
Figure 6.
Figure 6.
Oxidized phospholipids induce lung fibrosis in mice. (A) Nile red staining of AMs after cells were cytospun onto glass slides. AMs were isolated at BSL and at 5 and 10 days after oxidized phospholipid (POVPC) instillation (n = 5). Scale bar, 20 μm. (B) TGF-β1 in BAL fluid at BSL and at 5 and 10 days after POVPC instillation (n = 5). (C) Quantitative mRNA expression for Col1α1 in whole lung at BSL and at 5 and 10 days after POVPC instillation. Gene expression is normalized to Gapdh. (D) Quantification of lung collagen (Sircol assay) at BSL and at 5 and 10 days after POVPC. (E) Trichrome stain of the lung at BSL (data not shown) and at 10 days after POVPC. Collagen is markedly increased after POVPC administration. Low power (scale bar, 100 μM); high power (scale bar, 20 μm). (F) Oil Red O staining of AMs from wild-type (WT) and Abcg1−/− mice at 14 days after bleomycin. The number and size of foam cells is increased in Abcg1−/− mice when compared with WT mice (n = 6). Scale bar, 20 μm. (G) TGF-β1 in BAL fluid from WT and Abcg1−/− mice at 14 days after bleomycin. TGF-β1 concentration is increased in BAL fluid from Abcg1−/− mice when compared with age-matched WT mice (n = 6). (H) Quantification of lung collagen (Sircol assay) in WT and Abcg1−/− mice at 14 days after bleomycin. Collagen content is increased in lung from Abcg1−/− mice when compared with age-matched WT mice (n = 6). Data are expressed as mean ± SE. The statistical significance was assessed with one-way ANOVA. ***P < 0.001 versus the BSL or PBS groups; ##P < 0.01 versus the WT-bleomycin group.
Figure 7.
Figure 7.
Treatment with granulocyte-macrophage colony-stimulating factor (GM-CSF) attenuates lung lipid abnormalities and abrogates the fibrotic response to bleomycin injury. (A) Western blot analysis for GM-CSF at BSL and at D3, D7, D14, and D21 after bleomycin (n = 6). The image is representative of at least two independent experiments. (B) Oil Red O staining of AMs cytospun onto glass slides. Scale bar, 20 μm. AMs were isolated from BAL fluid at D14 after bleomycin in mice treated with vehicle or GM-CSF for 14 consecutive days (n = 5, each group). (CE) Cholesterol, triglyceride, and free fatty acid concentration in BAL fluid from bleomycin-injured mice treated with daily with vehicle or GM-CSF (10 μg, intraperitoneally) (n = 5). (F) TGF-β1 in BAL fluid at D14 after bleomycin in mice treated with vehicle or with daily GM-CSF (10 μg, intraperitoneally) (n = 5). (G) Quantitative mRNA expression for Col1α1 in lung at BSL and at D14 after bleomycin in mice treated with vehicle or with daily GM-CSF (10 μg, intraperitoneally) (n = 6). (H) Quantification of lung collagen (Sircol assay) at BSL and at D14 after bleomycin in mice treated with vehicle or with daily GM-CSF (intraperitoneally; n = 5). (I) Trichrome staining of the lung at BSL and at D14 after bleomycin in mice treated with vehicle or with daily GM-CSF (10 μg, intraperitoneally). The same magnification was used for acquiring all images. Scale bar, 100 μm. (J) Immunohistochemical staining for oxPc (brown stain) in lung at D14 after bleomycin in mice treated with daily vehicle or GM-CSF (10 μg, intraperitoneally). The same magnification was used for acquiring all images. Scale bar, 100 μm. (K) Schematic illustration of the proposed sequence of events leading to lung fibrosis after bleomycin. Profibrotic injury induces metabolic stress in lung epithelium, leading to accumulation of abnormal lipids in the distal airspaces of the lung. Uptake of oxPc by macrophages leads to foam cell formation and promotes TGF-β1 production. Treatment with GM-CSF attenuates metabolic stress, extracellular lipid accumulation, foam cell formation, and the severity of lung fibrosis after bleomycin. Data in this figure are expressed as mean ± SE. The statistical significance was assessed with one-way ANOVA. **P < 0.01 and ***P < 0.001, bleomycin versus the BSL group; ##P < 0.01, bleomycin alone versus the bleomycin plus GM-CSF group. ABCA1, ATP-binding cassette, subfamily A, member 1; ABCG1, ATP-binding cassette subfamily G member 1; CD36, cluster of differentiation 36; OxiPL, oxidized phospholipid; SRA1, scavenger receptor A1.

References

    1. van Moorsel CH, van Oosterhout MF, Barlo NP, de Jong PA, van der Vis JJ, Ruven HJ, van Es HW, van den Bosch JM, Grutters JC. Surfactant protein C mutations are the basis of a significant portion of adult familial pulmonary fibrosis in a dutch cohort. Am J Respir Crit Care Med. 2010;182:1419–1425. - PubMed
    1. Seibold MA, Wise AL, Speer MC, Steele MP, Brown KK, Loyd JE, Fingerlin TE, Zhang W, Gudmundsson G, Groshong SD, et al. A common MUC5B promoter polymorphism and pulmonary fibrosis. N Engl J Med. 2011;364:1503–1512. - PMC - PubMed
    1. Walters DM, Cho HY, Kleeberger SR. Oxidative stress and antioxidants in the pathogenesis of pulmonary fibrosis: a potential role for Nrf2. Antioxid Redox Signal. 2008;10:321–332. - PubMed
    1. Misharin AV, Morales-Nebreda L, Mutlu GM, Budinger GR, Perlman H. Flow cytometric analysis of macrophages and dendritic cell subsets in the mouse lung. Am J Respir Cell Mol Biol. 2013;49:503–510. - PMC - PubMed
    1. Redente EF, Keith RC, Janssen W, Henson PM, Ortiz LA, Downey GP, Bratton DL, Riches DW. Tumor necrosis factor-α accelerates the resolution of established pulmonary fibrosis in mice by targeting profibrotic lung macrophages. Am J Respir Cell Mol Biol. 2014;50:825–837. - PMC - PubMed

Publication types

MeSH terms