Comparative Study
. 2014 Nov 20;515(7527):355-64.
doi: 10.1038/nature13992.

A comparative encyclopedia of DNA elements in the mouse genome

Feng Yue  1 Yong Cheng  2 Alessandra Breschi  3 Jeff Vierstra  4 Weisheng Wu  5 Tyrone Ryba  6 Richard Sandstrom  4 Zhihai Ma  2 Carrie Davis  7 Benjamin D Pope  6 Yin Shen  8 Dmitri D Pervouchine  3 Sarah Djebali  3 Robert E Thurman  4 Rajinder Kaul  4 Eric Rynes  4 Anthony Kirilusha  9 Georgi K Marinov  9 Brian A Williams  9 Diane Trout  9 Henry Amrhein  9 Katherine Fisher-Aylor  9 Igor Antoshechkin  9 Gilberto DeSalvo  9 Lei-Hoon See  7 Meagan Fastuca  7 Jorg Drenkow  7 Chris Zaleski  7 Alex Dobin  7 Pablo Prieto  3 Julien Lagarde  3 Giovanni Bussotti  3 Andrea Tanzer  10 Olgert Denas  11 Kanwei Li  11 M A Bender  12 Miaohua Zhang  13 Rachel Byron  13 Mark T Groudine  14 David McCleary  8 Long Pham  8 Zhen Ye  8 Samantha Kuan  8 Lee Edsall  8 Yi-Chieh Wu  15 Matthew D Rasmussen  15 Mukul S Bansal  15 Manolis Kellis  16 Cheryl A Keller  5 Christapher S Morrissey  5 Tejaswini Mishra  5 Deepti Jain  5 Nergiz Dogan  5 Robert S Harris  5 Philip Cayting  2 Trupti Kawli  2 Alan P Boyle  2 Ghia Euskirchen  2 Anshul Kundaje  2 Shin Lin  2 Yiing Lin  2 Camden Jansen  17 Venkat S Malladi  2 Melissa S Cline  18 Drew T Erickson  2 Vanessa M Kirkup  18 Katrina Learned  18 Cricket A Sloan  2 Kate R Rosenbloom  18 Beatriz Lacerda de Sousa  19 Kathryn Beal  20 Miguel Pignatelli  20 Paul Flicek  20 Jin Lian  21 Tamer Kahveci  22 Dongwon Lee  23 W James Kent  18 Miguel Ramalho Santos  19 Javier Herrero  24 Cedric Notredame  3 Audra Johnson  4 Shinny Vong  4 Kristen Lee  4 Daniel Bates  4 Fidencio Neri  4 Morgan Diegel  4 Theresa Canfield  4 Peter J Sabo  4 Matthew S Wilken  25 Thomas A Reh  25 Erika Giste  4 Anthony Shafer  4 Tanya Kutyavin  4 Eric Haugen  4 Douglas Dunn  4 Alex P Reynolds  4 Shane Neph  4 Richard Humbert  4 R Scott Hansen  4 Marella De Bruijn  26 Licia Selleri  27 Alexander Rudensky  28 Steven Josefowicz  28 Robert Samstein  28 Evan E Eichler  4 Stuart H Orkin  29 Dana Levasseur  30 Thalia Papayannopoulou  31 Kai-Hsin Chang  30 Arthur Skoultchi  32 Srikanta Gosh  32 Christine Disteche  33 Piper Treuting  34 Yanli Wang  35 Mitchell J Weiss  36 Gerd A Blobel  37 Xiaoyi Cao  38 Sheng Zhong  38 Ting Wang  39 Peter J Good  40 Rebecca F Lowdon  40 Leslie B Adams  40 Xiao-Qiao Zhou  40 Michael J Pazin  40 Elise A Feingold  40 Barbara Wold  9 James Taylor  11 Ali Mortazavi  17 Sherman M Weissman  21 John A Stamatoyannopoulos  4 Michael P Snyder  2 Roderic Guigo  3 Thomas R Gingeras  7 David M Gilbert  6 Ross C Hardison  5 Michael A Beer  23 Bing Ren  8 Mouse ENCODE Consortium
Affiliations
Comparative Study

A comparative encyclopedia of DNA elements in the mouse genome

Feng Yue et al. Nature. .

Abstract

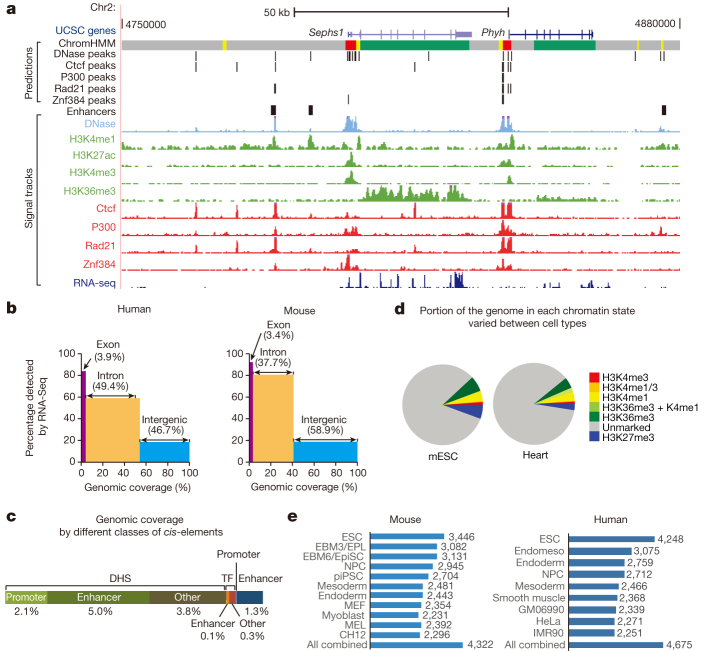
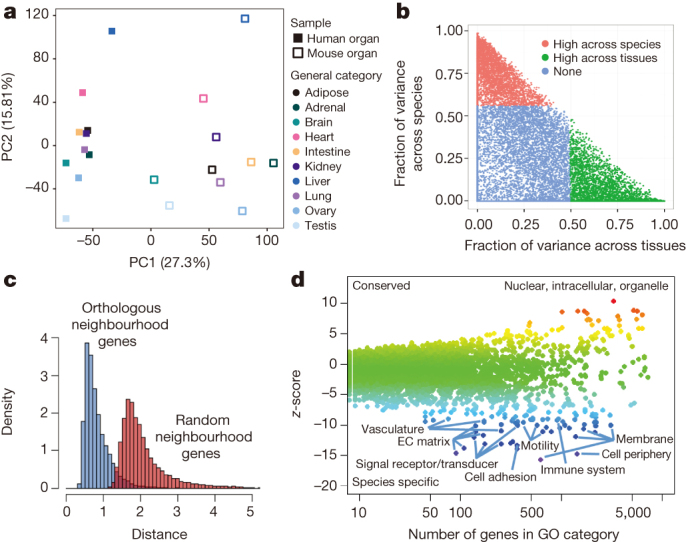
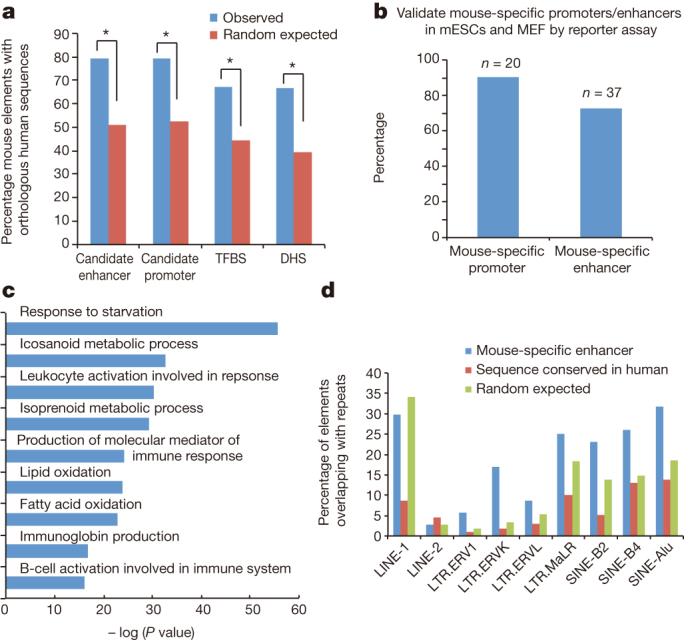
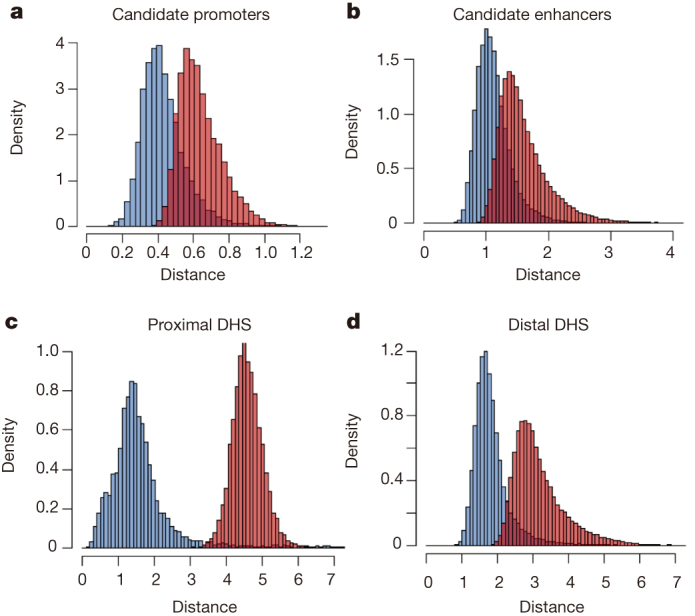
The laboratory mouse shares the majority of its protein-coding genes with humans, making it the premier model organism in biomedical research, yet the two mammals differ in significant ways. To gain greater insights into both shared and species-specific transcriptional and cellular regulatory programs in the mouse, the Mouse ENCODE Consortium has mapped transcription, DNase I hypersensitivity, transcription factor binding, chromatin modifications and replication domains throughout the mouse genome in diverse cell and tissue types. By comparing with the human genome, we not only confirm substantial conservation in the newly annotated potential functional sequences, but also find a large degree of divergence of sequences involved in transcriptional regulation, chromatin state and higher order chromatin organization. Our results illuminate the wide range of evolutionary forces acting on genes and their regulatory regions, and provide a general resource for research into mammalian biology and mechanisms of human diseases.


Conflict of interest statement

The authors declare no competing financial interests.

Figures

Figure 1
Figure 1. Overview of the mouse ENCODE data sets.
a, A genome browser snapshot shows the primary data and annotated sequence features in the mouse CH12 cells (Methods). b, Chart shows that much of the human and mouse genomes is transcribed in one or more cell and tissue samples. c, A bar chart shows the percentages of the mouse genome annotated as various types of cis-regulatory elements (Methods). DHS, DNase hypersensitive sites; TF, transcription factor. d, Pie charts show the fraction of the entire genome that is covered by each of the seven states in the mouse embryonic stem cells (mESC) and adult heart. e, Charts showing the number of replication timing (RT) boundaries in specific mouse and human cell types, and the total number of boundaries from all cell types combined. ESC, embryonic stem cell; endomeso, endomesoderm; NPC, neural precursor; GM06990, B lymphocyte; HeLa-S3, cervical carcinoma; IMR90, fetal lung fibroblast; EPL, early primitive ectoderm-like cell; EBM6/EpiSC, epiblast stem cell; piPSC, partially induced pluripotent stem cell; MEF, mouse embryonic fibroblast; MEL, murine erythroleukemia; CH12, B-cell lymphoma. PowerPoint slide
Figure 2
Figure 2. Comparative analysis of the gene expression programs in human and mouse samples.
a, Principal component analysis (PCA) was performed for RNA-seq data for 10 human and mouse matching tissues. The expression values are normalized across the entire data set. Solid squares denote human tissues. Open squares denote mouse tissues. Each category of tissue is represented by a different colour. b, Gene expression variance decomposition (see Methods) estimates the relative contribution of tissue and species to the observed variance in gene expression for each orthologous human–mouse gene pair. Green dots indicate genes with higher between-tissue contribution and red dots genes with higher between-species contributions. c, Neighbourhood analysis of conserved co-expression (NACC) in human and mouse samples. The distribution of NACC scores for each gene is shown. d, A scatter plot shows the average of NACC score over the set of genes in each functional gene ontology category. Highlighted are those biological processes that tend to be more conserved between human and mouse and those processes that have been less conserved (see Supplementary Table 21 for list of genes). PowerPoint slide
Figure 3
Figure 3. Comparative analysis of the cis-elements predicted in the human and mouse genome.
a, Chart shows the fractions of the predicted mouse cis-regulatory elements with homologous sequences in the human genome (Methods). TFBS, transcription factor binding site. b, A bar chart shows the fraction of the DNA fragments tested positive in the reporter assays performed either using mouse embryonic stem cells (mESCs) or mouse embryonic fibroblasts (MEF). c, A chart shows the gene ontology (GO) categories enriched near the predicted mouse-specific enhancers. d, A bar chart shows the percentage of the predicted mouse-specific enhancers containing various subclasses of LTR and SINE elements. As control, the predicted mouse cis elements with homologous sequences in the human genome or random genomic regions are included. PowerPoint slide
Figure 4
Figure 4. Analysis of conservation in biochemical activities at the predicted mouse cis-regulatory sequences with human orthologues.
a, b, Histograms show the distribution of the NACC score for the chromatin modification H3K27ac signal at the predicted mouse promoters (a) or enhancers (b). c, d, Histograms show the distributions of NACC scores for DNase I signal at the promoter proximal (c) and distal (d) DNase I hypersensitive sites (DHS). PowerPoint slide
Figure 5
Figure 5. Chromatin landscape is stable within individual cell lineages.
a, Map displaying the distribution of chromatin states over the neighbourhoods of human–mouse one-to-one orthologue genes in CH12 cells. The gene neighbourhood intervals were sorted by the transcription level of each gene, shown by white dots. TSS, transcription start site. b, c, Distribution of chromatin states in human–mouse one-to-one orthologues that are differentially expressed genes between erythroid progenitor and erythroblasts models (b) and between erythroblast and megakaryocyte (c). PowerPoint slide
Figure 6
Figure 6. Human GWAS hits when mapped onto mouse genome are associated with specific chromatin states.
a, A self-organization map of histone modification H3K4me1 shows association between kidney H3K4me1 state and specific GWAS hits associated with urate levels (Methods). b, Liver-specific H3K36me3 unit shows enrichment in GWAS hits related to cholesterol, alcohol dependence and triglyceride levels. c, Brain-specific H3K27me3 high unit shows enrichment in GWAS SNPs associated with neurological disorders. d, Characterization of every unit with statistically significant GWAS enrichments in terms of highest histone modification signal in at least one sample. Units with no signal in top 100 map units for every histone modification are listed as none. RPKM, reads per kilobase per million reads mapped. PowerPoint slide
Figure 7
Figure 7. Replication timing boundaries preserved among tissues are conserved in mice and humans.
a, Depiction of a timing transition region (TTR) between the early and late replication domains. Early and late boundaries are defined as slope changes at either end of TTRs. b, Boundaries conserved between species for matched mouse and human cell types as a function of preservation among mouse cell types. c, Percentage of boundaries conserved between species (bar graph) and overall conservation of boundaries between comparable mouse and human cell types (CH12 versus GM06990, mESC versus hESC, mouse epiblast stem cells (mEpiSC) versus hESC) as a function of preservation among mouse cell types. d, A Venn diagram compares the replication timing boundaries identified in the mouse and human genome. PowerPoint slide
Extended Data Figure 1
Extended Data Figure 1. Clustering analysis of human and mouse tissue samples.
a, RNA-seq data from Ilumina Body Map (adipose, adrenal, brain, colon, heart, kidney, liver, lung, ovary and testis) were analysed together with that from the matched mouse samples using clustering analysis. Genes with high variance across tissues were used, resulting in cell samples clustering by tissues, not by species. b, Clustering employing genes with high variance between species shows clustering by species instead of tissues. c, Principal Component Analysis (PCA) was performed for RNA-seq data for 10 human and mouse matching tissues. The expression values are normalized within each species and we observed the clustering of samples by tissue types.
Extended Data Figure 2
Extended Data Figure 2. Comparative analysis of sequence conservation in the cis elements predicted in the human and mouse genome.
a, The predicted mouse-specific promoters and enhancers can function in human embryonic stem cells (hESCs). Percentages of predicted enhancers or promoters that test positive are shown in a bar chart. b, A bar chart shows the percentage of the predicted mouse-specific promoters containing various subclasses of LTR and SINE elements. As control, the predicted mouse cis elements with homologous sequences in the human genome or random genomic regions are included.
Extended Data Figure 3
Extended Data Figure 3. Replication timing boundaries preserved among tissues are conserved during evolution.
a, Heat map of TTR overlap with positive (yellow) or negative (blue) slope. Replication timing (RT) boundaries were identified as clustered TTR endpoints (grey) above the 95th percentile (dashed line) of randomly resampled positions (black). b, Examples of constitutive boundaries (blue regions) and regulated boundaries (grey regions) highlighted. c, Spearman correlations between differences in chromatin feature enrichment and differences in RT in non-overlapping 200-kb windows. d, Percentage of boundaries preserved between the indicated number of human cell types. e, f, Distribution of boundary replication timing in mouse (e) and human (f) as a function of preservation level between cell types. g, Comparison of changes in replication timing versus various histone marks across a segment of mouse chromosome 6.

References

    1. Paigen K. One hundred years of mouse genetics: an intellectual history. I. The classical period (1902–1980) Genetics. 2003;163:1–7. - PMC - PubMed
    1. Chinwalla AT, et al. Initial sequencing and comparative analysis of the mouse genome. Nature. 2002;420:520–562. - PubMed
    1. Odom DT, et al. Tissue-specific transcriptional regulation has diverged significantly between human and mouse. Nature Genet. 2007;39:730–732. - PMC - PubMed
    1. Schmidt D, et al. Five-vertebrate ChIP-seq reveals the evolutionary dynamics of transcription factor binding. Science. 2010;328:1036–1040. - PMC - PubMed
    1. Stefflova K, et al. Cooperativity and rapid evolution of cobound transcription factors in closely related mammals. Cell. 2013;154:530–540. - PMC - PubMed

Publication types

MeSH terms

Grants and funding