. 2014 Nov 20;515(7527):371-375.
doi: 10.1038/nature13985.

Principles of regulatory information conservation between mouse and human

Collaborators, Affiliations

Principles of regulatory information conservation between mouse and human

Yong Cheng et al. Nature. .

Abstract

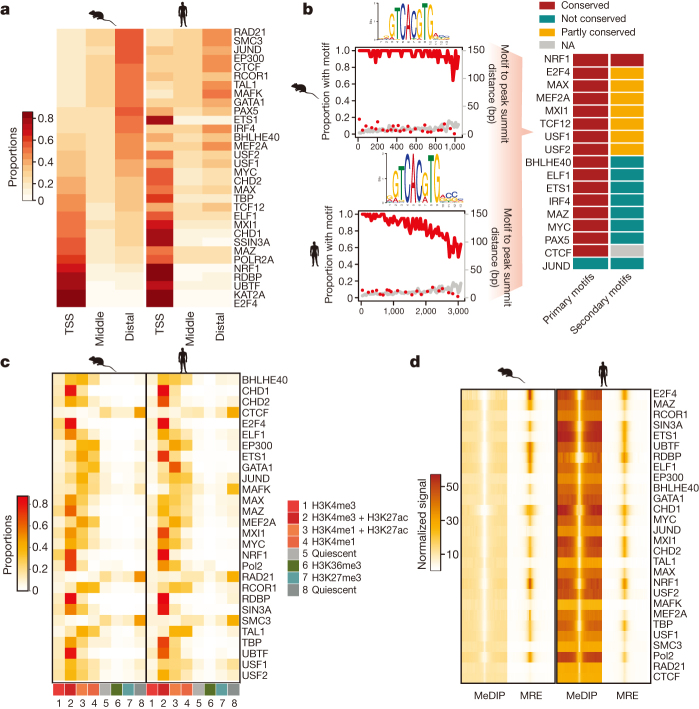
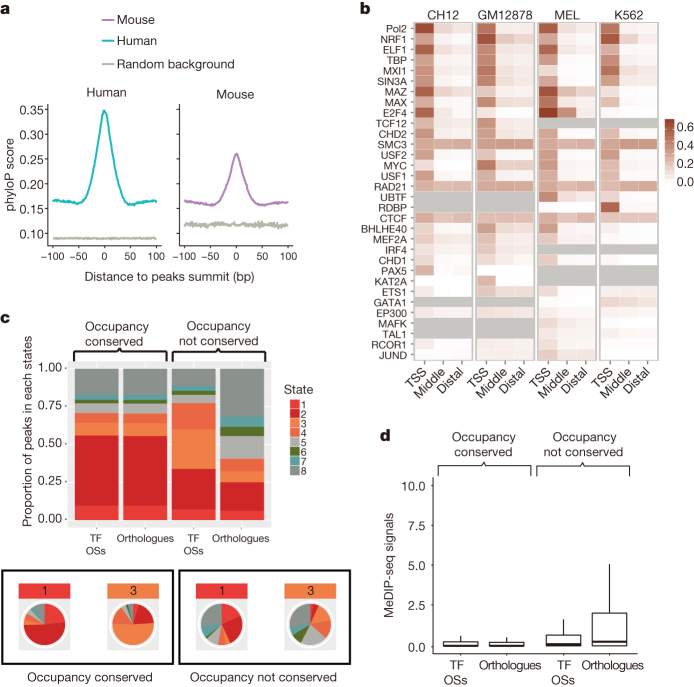
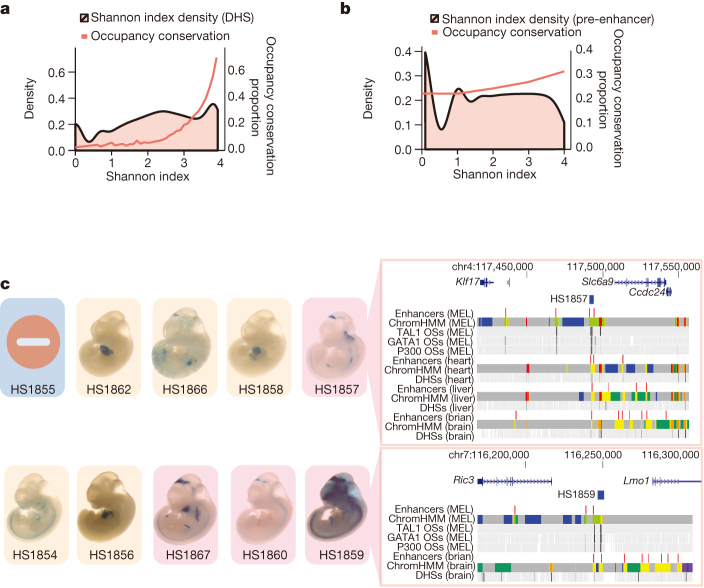
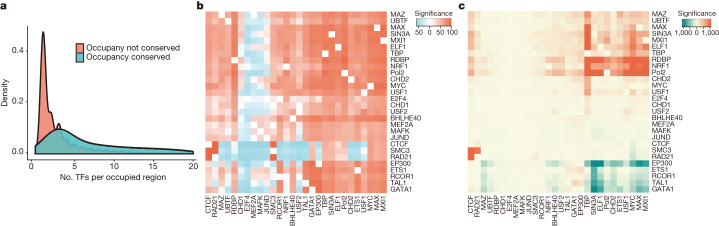
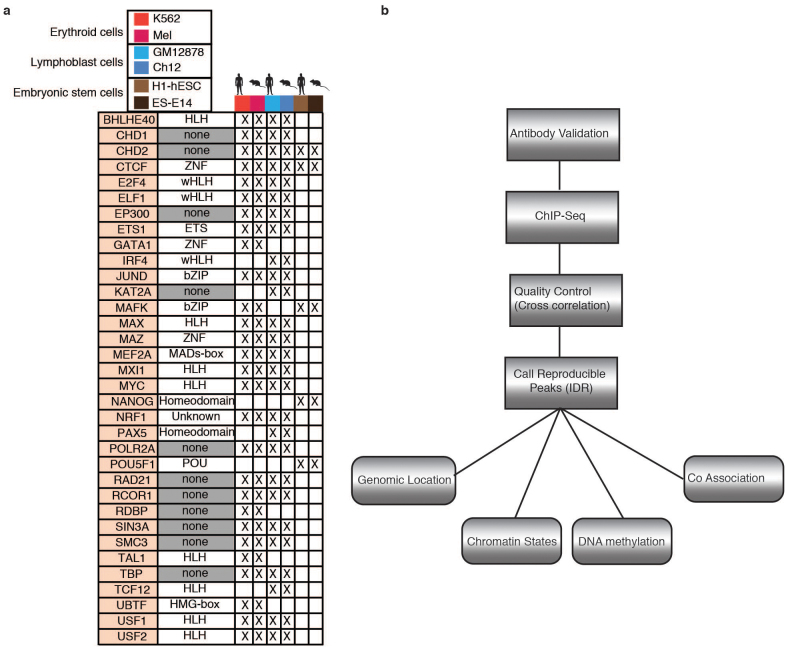
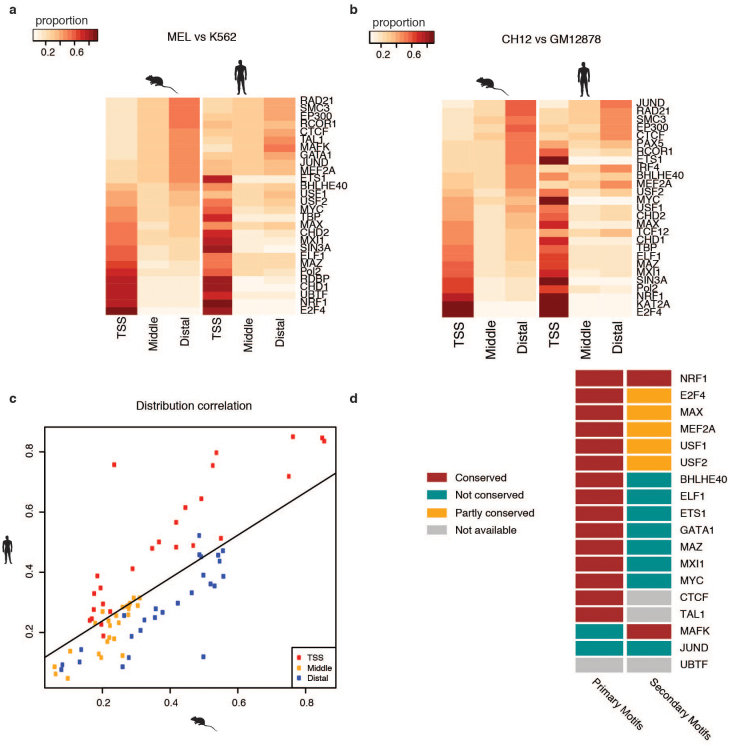
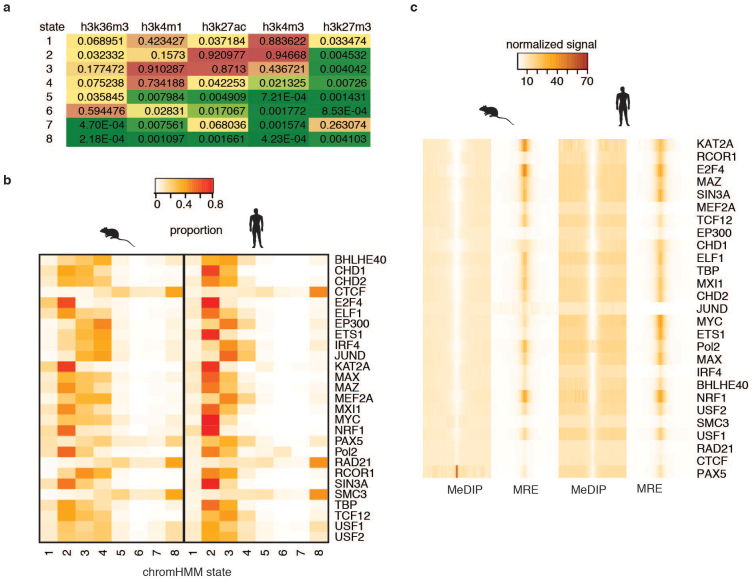
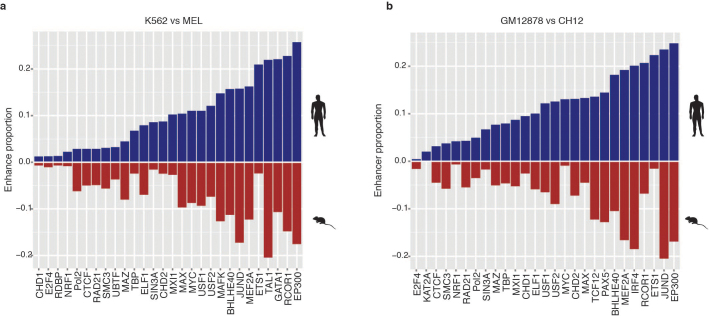
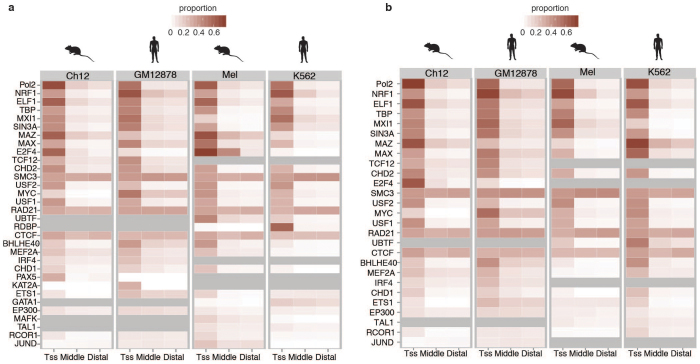
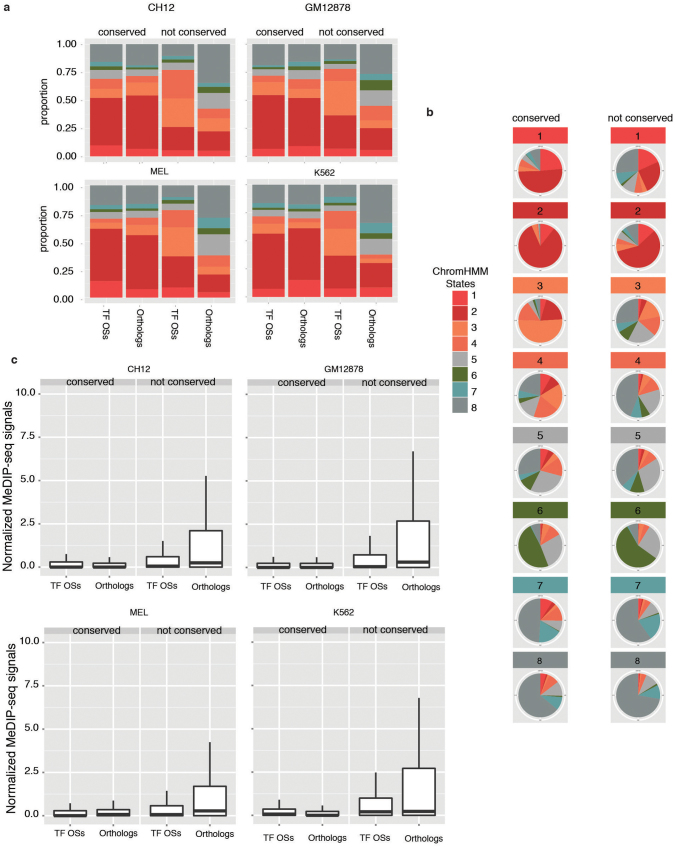
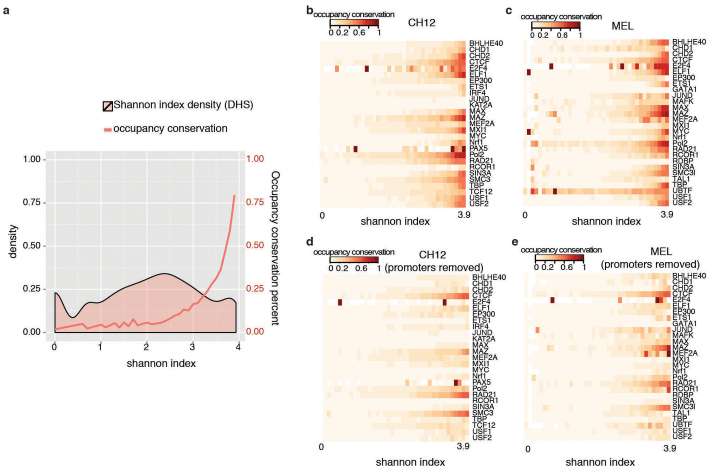
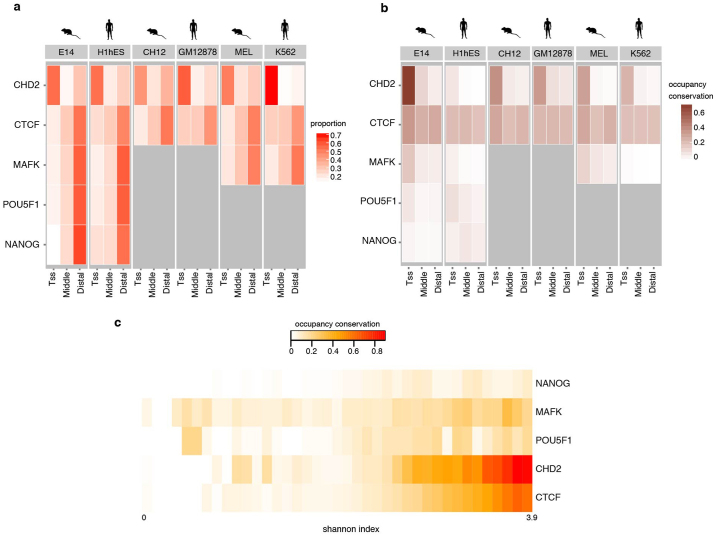
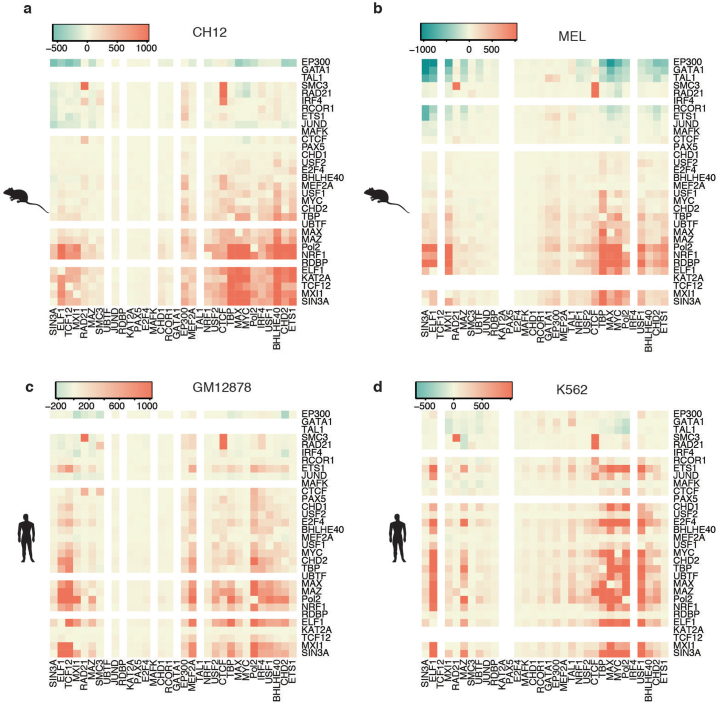
To broaden our understanding of the evolution of gene regulation mechanisms, we generated occupancy profiles for 34 orthologous transcription factors (TFs) in human-mouse erythroid progenitor, lymphoblast and embryonic stem-cell lines. By combining the genome-wide transcription factor occupancy repertoires, associated epigenetic signals, and co-association patterns, here we deduce several evolutionary principles of gene regulatory features operating since the mouse and human lineages diverged. The genomic distribution profiles, primary binding motifs, chromatin states, and DNA methylation preferences are well conserved for TF-occupied sequences. However, the extent to which orthologous DNA segments are bound by orthologous TFs varies both among TFs and with genomic location: binding at promoters is more highly conserved than binding at distal elements. Notably, occupancy-conserved TF-occupied sequences tend to be pleiotropic; they function in several tissues and also co-associate with many TFs. Single nucleotide variants at sites with potential regulatory functions are enriched in occupancy-conserved TF-occupied sequences.


Conflict of interest statement

The authors declare no competing financial interests.

Figures

Figure 1
Figure 1. General features comparison between orthologous TF OSs.
a, Each row represents one TF, and each column represents one genomic region. Heat-map colour shows the proportions of TF OSs (combination of different cell lines in the same species) that are located in each genomic region. b, Motif comparison for sequence-specific TFs examined in lymphoblast cells. In the right panel, each row represents one TF. The level of motif conservation is encoded by colour. Detailed results for the USF2 example are in the left panels. Peaks were divided into different bins according to the occupancy signal (higher signal on the left, lower on the right). The proportions of peaks with the motif in each bin (red lines) and the average distances between motif sites and peak summit in each bin (grey lines) are plotted against ranks of peak bins. Red dots indicate the proportion of control regions (±500 bp flanking the USF2 OS) that have the motif. NA, not available. c, TF OS chromatin state preference comparison between MEL and K562 cells. Heat map shows the percentage of TF OSs (rows) that overlap with eight different chromatin states (columns). d, The average signal distributions for MeDIP-seq and MRE-seq in MEL and K562 cells. Five-kilobase flanking regions centred on the TF OS peak summits were divided into 50-bp bins. Signals were aggregated in each bin. PowerPoint slide
Figure 2
Figure 2. Conservation and divergence of TF OSs.
a, Blue and purple lines represent the average phyloP score distribution near (±100 bp) the ChIP-seq peak summit in human and mouse. The grey line represents the distribution for randomly selected background sequences. The x axis is the distance to the peak summit, and the y axis is the average phyloP score. b, The heat map represents the occupancy conservation of TF (rows) OSs in the four cell lines. The colour intensity represents the proportion of TF OSs for which occupancy is conserved between mouse and human in different genomic regions (columns). c, Comparison of the chromatin state change between TF OSs and orthologous sequences. TF OSs that can be aligned between mouse and human are divided into two groups according to the occupancy conservation status (‘occupancy conserved’ versus ‘occupancy not conserved’). Top, the y axis is the proportion of TF OSs and their orthologous sequences in each chromatin state. Bottom, detailed chromatin state change in human orthologues for mouse TF OSs in chromatin states 1 and 3. The pie charts show the distribution of chromatin states in the orthologous sequence in the second species. d, Comparison of the DNA methylation change between TF OSs and orthologous sequences. The y axis gives the normalized DNA methylation signals (MeDIP-seq). TF OSs are divided into two categories according to the occupancy conservation status as in c. PowerPoint slide
Figure 3
Figure 3. Conservation of occupancy is associated with chromatin accessibility and enhancer activity in multiple tissues.
a, Association between occupancy conservation and chromatin accessibility across several tissues. The density plot represents the frequency that TF OSs are in accessible chromatin in varying numbers of cell types. The x axis is the Shannon index density calculated on the basis of the DHS signals in 55 tissues or cell lines in mouse; high values mean the TF OS is in accessible chromatin in many cell types. The red line shows the fraction of TF OSs at which occupancy is conserved within each bin of Shannon index. b, Association between occupancy conservation and enhancer usage across several tissues. The density plot represents the frequency that TF OSs are in chromatin indicative of enhancer activity (calculated using histone H3 acetyl Lys 27 (H3K27ac) ChIP-seq signals) in varying numbers of cell types. The x axis is the Shannon index calculated based on H3K27ac signal across 23 tissues or cell lines. The red line shows the fraction of TF OSs at which occupancy is conserved within each bin of Shannon index. pre-enhancer, presumptive enhancer. c, Results of transgenic mouse enhancer assays of ten occupancy-conserved GATA1 binding sites. The stained embryo images are highlighted by activity in different tissues: light pink for those showing enhancer activity only in heart and vascular tissues, darker pink for those with activities in other tissues. Right panel shows genes, enhancers predicted by histone modifications, chromatin states (using the software ChromHMM, see Methods), factor occupancy, and DHS signals across different tissues for regions containing two GATA1 OSs. PowerPoint slide
Figure 4
Figure 4. TFs co-association and occupancy conservation.
a, Density plot shows the distribution of co-associated TF numbers in each TF-binding region. The x axis represents the total number of occupied TFs per region. b, Pair-wise TF co-association in MEL cells. The colour intensity represents the extent of co-association between the TFs denoted in the rows and columns compared to the random expectation (details in Supplementary Methods). Red represents co-association higher than random expectation, blue represents co-association lower than random expectation. c, Conditional TF OSs occupancy conservation in MEL cells. The colour intensity represents for a given TF (columns), whether the co-association with the other TF (rows) is more enriched in lineage-specific binding sites (green) or occupancy-conserved binding sites (red). The colour scale represents the extent (–log P value) of the enrichment significance. PowerPoint slide
Extended Data Figure 1
Extended Data Figure 1. TF ChIP-seq data overview and analysis workflow.
a, All TFs in this study are grouped according to species and cell types. TF DNA binding domains are list in the second column. The TFs without binding domains are highlighted in grey. The TFs assayed were cross-marked, whereas TFs not assayed are depicted in white. b, Flowchart for the analysis pipeline for inter- and intra-species comparisons.
Extended Data Figure 2
Extended Data Figure 2. TF OSs distribution and motifs.
a, An illustration of TF OS distribution relative to TSSs in MEL and K562 cells. Each row represents one TF, each column represents one genomic region. Heat-map colour shows the proportions of TF OSs that are located in different genomic regions. b, Similar TF OS distribution plot as a in CH12 and GM12878 cells. c, Correlation between mouse and human TF OS distribution. Dot plot shows the correlation of orthologous TF OS distribution in each genomic region. Each dot represents proportion of OSs for one TF in one genomic region. The x axis is the proportion in mouse genome, and the y axis is the proportion in human genome. d, Motif comparison for sequence specific TFs examined in erythroid progenitor cells (MEL and K562). Each row represents one TF. The level of motif conservation is encoded by colour.
Extended Data Figure 3
Extended Data Figure 3. TF OS chromatin states and DNA methylation status preference comparison.
a, Emission matrix of ChromHMM trained by five histone modification markers (H3K4me1, H3K4me3, H3K36me3, H3K27me3 and H3K27ac). b, Heat map shows the proportion of TF OSs (rows) that overlap with each chromatin state (columns) generated by ChromHMM using five different histone markers in CH12 and GM12878 cells. c, The average signal distributions for MeDIP-seq and MRE-seq in CH12 and GM12878 cells. The 5-kb flanking regions centred on the TF OS peak summits were divided into 50-bp bins. Signals were aggregated in each bin.
Extended Data Figure 4
Extended Data Figure 4. Proportion of predicted enhancers in the orthologous TF OSs.
Bar graphs show the proportions of TF OSs that overlapped with the predicted enhancers. a, Results in MEL and K562 cells. b, Results in CH12 and GM12878 cells. The x axis represents different TFs, the y axis represents the proportion of TF OSs that overlapped with predicted enhancers.
Extended Data Figure 5
Extended Data Figure 5. Occupancy conservation adjusted by sequence conservation.
a, The heat map represents the adjusted occupancy conservation of TF (row) OSs in the four cell lines. The colour intensity represents the proportion of TF OSs that are occupancy-conserved between mouse and human in different genomic regions (column). To remove the bias introduced by variation of sequence conservation at different genomic loci, only TF OSs in which the sequence can be aligned between mouse and human were included in this analysis. b, The heat map is similar to Fig. 2b. TFs showing remarkable difference on total binding peaks numbers between the mouse and human were excluded.
Extended Data Figure 6
Extended Data Figure 6. Comparison of the epigenetic features between TF OSs and orthologous sequences.
a, The y axis represents the proportion of TF OSs in each chromatin state. TF OSs that can be aligned between mouse and human are divided into two categories according to the occupancy conservation status. Each panel represents distribution of TF OSs in one cell line. b, Each panel represents mouse TF OSs in one chromatin state. The pie chart in each panel shows the proportions of chromatin states in the orthologous sequence in human. Panels in the left column represent the occupancy-conserved TF OSs, and panels in the right column represent the TF OSs that can be aligned but without occupancy conservation. c, The y axis represents the normalized DNA methylation signals (MeDIP-seq). TF OSs that can be aligned between mouse and human are divided into two categories according to the occupancy conservation status (both sequence and occupancy are conserved (OCC) and sequence is conserved but occupancy is not conserved (SCNC)). Each panel represents distribution in one cell line.
Extended Data Figure 7
Extended Data Figure 7. Conservation of occupancy is associated with chromatin accessibility and enhancer activity in several tissues.
a, Association between occupancy conservation and chromatin accessibility across several tissues. The density plot represents the frequency that TF OSs (removed DNA sequences occupied by CTCF, RAD21 and SMC3) are in accessible chromatin in varying numbers of cell types. The x axis is the Shannon index calculated based on the DHS signals in 55 mouse tissues or cell lines; high values mean the TF OS is in accessible chromatin in many cell types. The red line shows the fraction of TF OSs at which occupancy is conserved within each bin of the Shannon index. b, c, The association between occupancy conservation and chromatin accessibility across multiple tissues for each TF (row) in CH12 and MEL cells. TF OSs are divided into different bins according to the value of the Shannon index (columns). The colour intensity represents the proportion of occupancy-conserved TF OSs within each bin. d, e, Similar distribution to b and c but only for TF OSs that are located 2 kb away from TSSs.
Extended Data Figure 8
Extended Data Figure 8. Consistency of observations between embryonic stem cells and cell lines.
a, Genomic distribution of five TF OSs in embryonic stem cells. b, Occupancy conservation in different genomic locations between human and mouse embryonic stem cells. c, Occupancy conservation of TF OSs in embryonic stem cells is associated with function in many tissues.
Extended Data Figure 9
Extended Data Figure 9. Relationship between occupancy conservation and pair-wised TFs co-association.
ad, Occupancy conservation and TF co-association analysis was conducted as described in Fig. 4c for all four cell lines. The TFs were kept in the same order across the four cell lines for easy visualization.

References

    1. Odom DT, et al. Tissue-specific transcriptional regulation has diverged significantly between human and mouse. Nature Genet. 2007;39:730–732. doi: 10.1038/ng2047. - DOI - PMC - PubMed
    1. Schmidt D, et al. Five-vertebrate ChIP-seq reveals the evolutionary dynamics of transcription factor binding. Science. 2010;328:1036–1040. doi: 10.1126/science.1186176. - DOI - PMC - PubMed
    1. Stefflova K, et al. Cooperativity and rapid evolution of cobound transcription factors in closely related mammals. Cell. 2013;154:530–540. doi: 10.1016/j.cell.2013.07.007. - DOI - PMC - PubMed
    1. Kunarso G, et al. Transposable elements have rewired the core regulatory network of human embryonic stem cells. Nature Genet. 2010;42:631–634. doi: 10.1038/ng.600. - DOI - PubMed
    1. Borneman AR, et al. Divergence of transcription factor binding sites across related yeast species. Science. 2007;317:815–819. doi: 10.1126/science.1140748. - DOI - PubMed

Publication types