. 2014 Nov 20;515(7527):402-5.
doi: 10.1038/nature13986.

Topologically associating domains are stable units of replication-timing regulation

Affiliations

Topologically associating domains are stable units of replication-timing regulation

Benjamin D Pope et al. Nature. .

Abstract

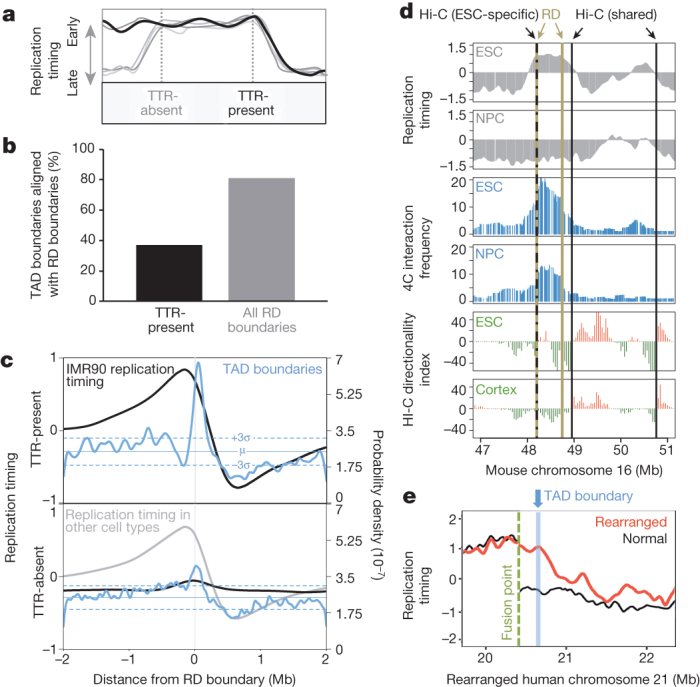
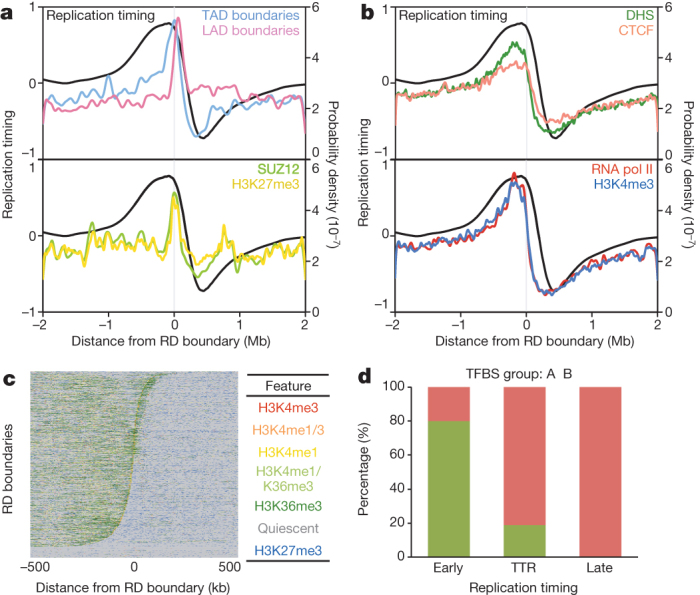
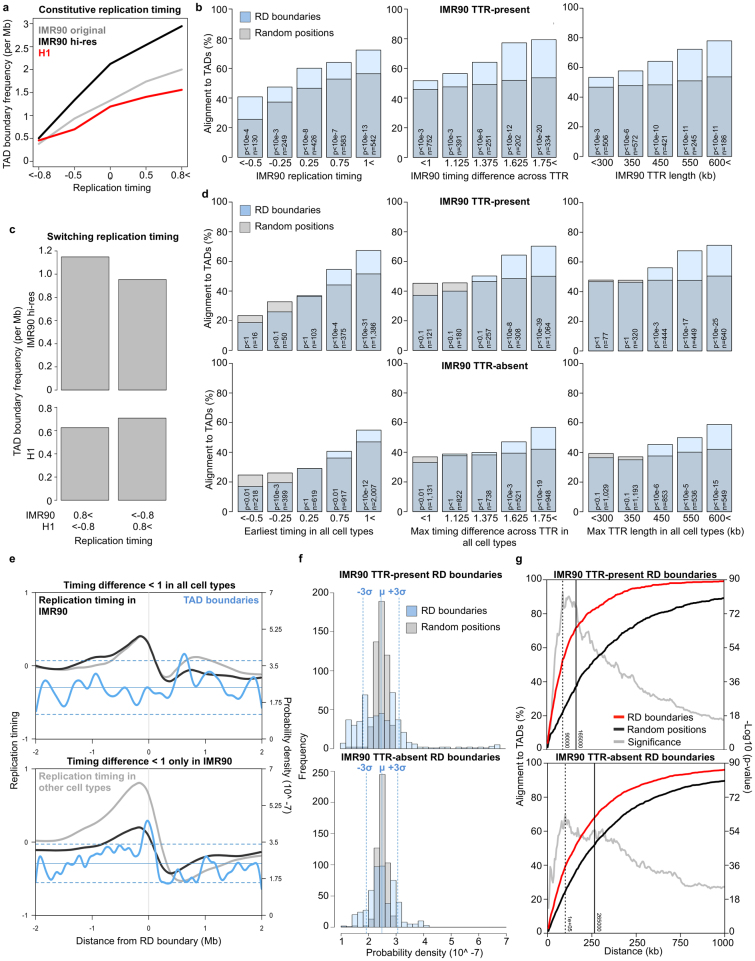
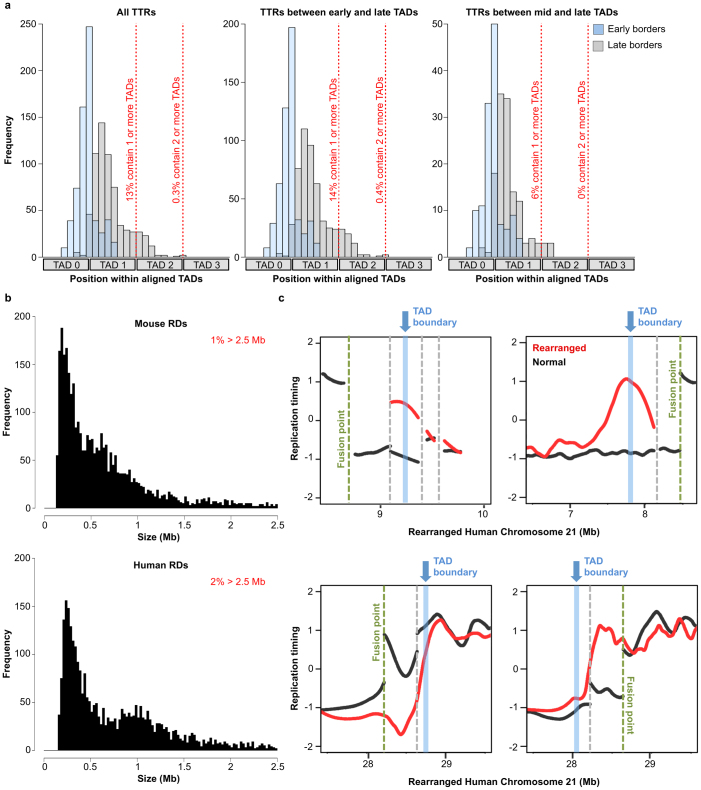
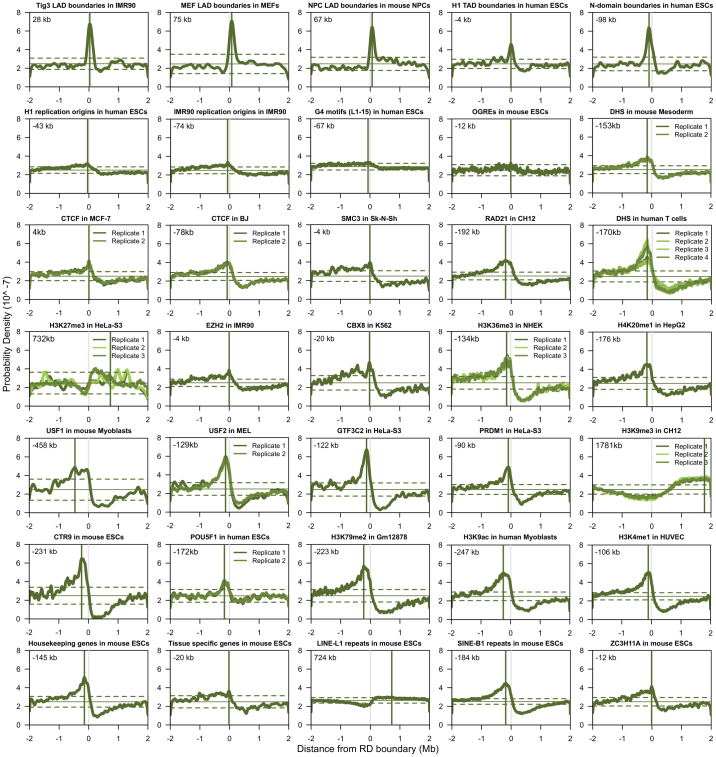
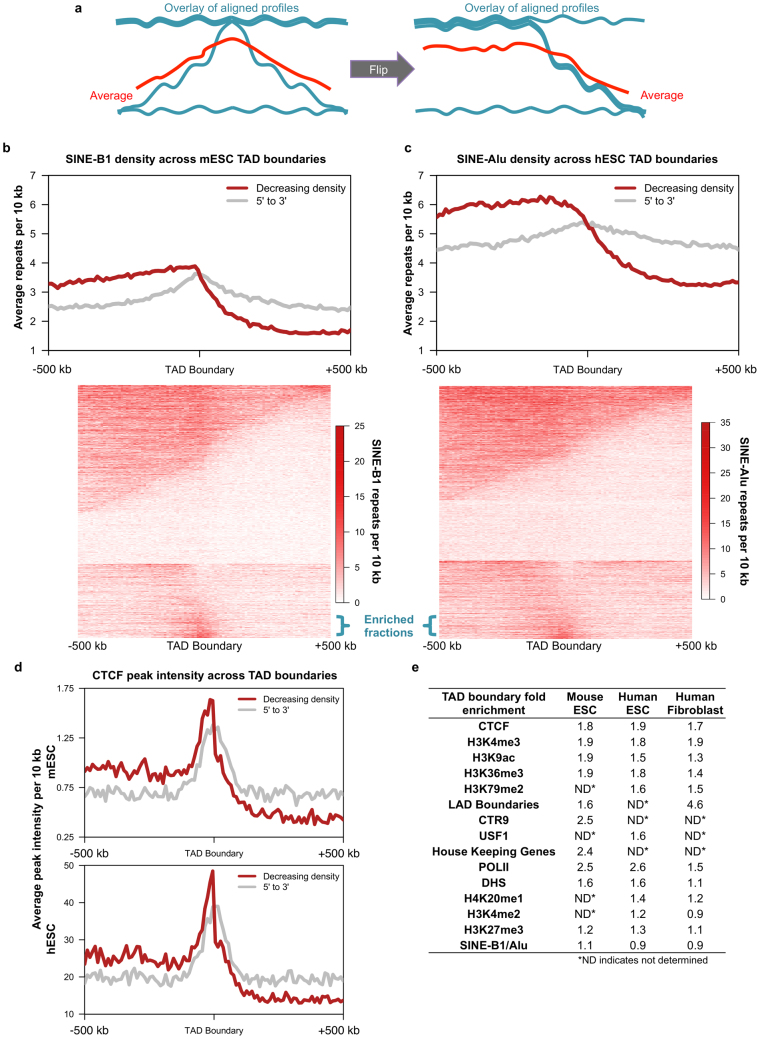
Eukaryotic chromosomes replicate in a temporal order known as the replication-timing program. In mammals, replication timing is cell-type-specific with at least half the genome switching replication timing during development, primarily in units of 400-800 kilobases ('replication domains'), whose positions are preserved in different cell types, conserved between species, and appear to confine long-range effects of chromosome rearrangements. Early and late replication correlate, respectively, with open and closed three-dimensional chromatin compartments identified by high-resolution chromosome conformation capture (Hi-C), and, to a lesser extent, late replication correlates with lamina-associated domains (LADs). Recent Hi-C mapping has unveiled substructure within chromatin compartments called topologically associating domains (TADs) that are largely conserved in their positions between cell types and are similar in size to replication domains. However, TADs can be further sub-stratified into smaller domains, challenging the significance of structures at any particular scale. Moreover, attempts to reconcile TADs and LADs to replication-timing data have not revealed a common, underlying domain structure. Here we localize boundaries of replication domains to the early-replicating border of replication-timing transitions and map their positions in 18 human and 13 mouse cell types. We demonstrate that, collectively, replication domain boundaries share a near one-to-one correlation with TAD boundaries, whereas within a cell type, adjacent TADs that replicate at similar times obscure replication domain boundaries, largely accounting for the previously reported lack of alignment. Moreover, cell-type-specific replication timing of TADs partitions the genome into two large-scale sub-nuclear compartments revealing that replication-timing transitions are indistinguishable from late-replicating regions in chromatin composition and lamina association and accounting for the reduced correlation of replication timing to LADs and heterochromatin. Our results reconcile cell-type-specific sub-nuclear compartmentalization and replication timing with developmentally stable structural domains and offer a unified model for large-scale chromosome structure and function.


Conflict of interest statement

The authors declare no competing financial interests.

Figures

Figure 1
Figure 1. Early timing transition region borders align with topologically associating domains and lamina associated domains.
a, Constant replication timing segments (CTRs) flanking a timing transition region (TTR) are illustrated. b, The average and range of 8,433 aligned TTRs from 5 mESC data sets (top). Vertical axis values are log2 ratios of early over late signal intensities, with more positive values indicating earlier replication timing (and more negative values indicating later timing). Average directionality index values across the same TTRs (bottom). Transition from upstream to downstream bias indicates a topologically associating domain (TAD) boundary near the early border. c, Individual aligned TTRs arranged by distance between early or late borders and upstream to downstream bias transitions. d, Replication timing across individual mESC TADs or lamina associated domains (LADs). UD, U-shaped replication-timing domains. PowerPoint slide Source data
Figure 2
Figure 2. TADs align with TTRs from different cell types.
a, Illustrated examples of one TTR-present and one TTR-absent replication domain (RD) boundary. b, Percentage of IMR90 TAD boundaries overlapping TTR-present or all replication domain boundaries. c, Probability density functions for IMR90 TAD boundaries and average IMR90 replication-timing profiles across replication domain boundaries. Mean and 3 standard deviations from the mean random density are indicated. d, Replication timing (top), 4C (middle), and directionality index (bottom) across the Dppa2 locus in mouse ESCs and NPCs. e, Replication timing across a chromosome rearrangement and the normal profile with the nearest TAD boundary indicated. PowerPoint slide Source data
Figure 3
Figure 3. TTR-present replication domain boundaries separate permissive and repressed chromatin domains.
a, b, Probability density functions for chromatin features and replication timing across mESC TTR-present replication domain boundaries. c, Chromatin states across the same boundaries. d, True versus predicted classification rates comparing the predicted classes of an unsupervised model trained on binding profiles for seven transcription factors (CTCF, HCFC1, MAFK, P300, RNA Pol II, ZC3H11A, and ZNF384) versus actual replication timing for all mESC TADs. TADs considered ‘early’ by replication timing predominantly composed class A, whereas ‘TTR’ and ‘late’ TADs predominantly composed class B. TFBS, transcription factor binding sites data. PowerPoint slide Source data
Figure 4
Figure 4. The replication domain model.
Top left, replication timing across three TADs replicated late in cell type 1. Early initiation of flanking regions forms TTRs that extend from the left and right boundaries of TADs 1 and 3 respectively until origins throughout the late-replicating region fire. Top right, TADs 1–3 arrange in transcriptionally repressive compartments of the nucleus. Bottom left, in cell type 2, TAD2 is replicated early, creating new TTRs at pre-existing TAD boundaries. Bottom right, the switch to early replication is associated with diminished interaction with the nuclear lamina and increased interaction with other early-replicating TADs. PowerPoint slide
Extended Data Figure 1
Extended Data Figure 1. Clustering of early replication-timing borders and TAD boundary alignment at TTRs and A/B compartment transitions.
a, Cumulative density plot showing clustering of timing values at the early and late side of timing transition regions. For each genomic orientation (forward and reverse are shown in right and left columns), timing values are more tightly distributed at the early border than the later border. b, Directionality index data for individual IMR90 TTRs aligned at their early (left) or late (right) borders and arranged by TTR size. Solid black lines indicate the positions of early and late borders in each plot. c, Percentages of ESC TTR borders or random positions that align to TAD boundaries as a function of distance from the TTR centre. Boxplots indicate the positions of TTR borders. d, Percentages of mESC compartment A/B transitions that align to TAD boundaries as a function of distance from the A/B compartment threshold (eigenvector crosses zero). As observed for early TTR borders, more A/B transitions align with TAD boundaries on their compartment A side than on their compartment B side, which aligns with TAD boundaries at near random frequency.
Extended Data Figure 2
Extended Data Figure 2. TTRs and late-replicating regions associate with the nuclear lamina.
a, Spearman correlations between genome-wide replication timing and lamina association (top) or observed changes between the indicated mouse cell types. b, Tig3 human fibroblast lamina association across individual IMR90 human fibroblast TADs with early (> 0.5) or late (< −0.5) timing values in IMR90 human fibroblasts. c, Average levels of lamina association across the same early (red) and late (blue) TADs as in b. d, Lamina association in mESCs across individual mESC TTRs aligned as in Fig. 1b, c. TTRs were ordered in the heatmap by the distance between each early TTR border and the nearest downstream LAD. e, Heatmaps show lamina association and replication timing across aligned LADs ± 400 kb. LADs were oriented with earlier replication timing to the left and ordered from top to bottom by the replication timing of the left LAD border. Averages for all LADs (grey) and the earliest (blue), middle (green), and latest (red) thirds are overlaid in the plots below. LADs on average replicate later than the surrounding genomic space and replication timing has little effect on the strength of lamina association. Interestingly, the left plot reveals a consistently sized gap ∼100 kb in size separating neighbouring LADs. f, Average replication timing (blue or red) and lamina association (purple or green) are shown across aligned TTRs ± 400 kb that either overlap with LADs (70%) or do not (30%). TTRs that do not overlap with called LADs still associate with the nuclear lamina to some degree.
Extended Data Figure 3
Extended Data Figure 3. Replication domain boundary calls are reproducible in replicate data sets.
a, Histograms of distances between replication domain boundary calls and the nearest calls made in a separate data set from the same cell type. Four lymphoblastoid Repli-chip data sets (top left) were compared to each other and five lymphoblastoid Repli-seq data sets (top right) were compared to each other. The four lymphoblastoid Repli-chip data sets were then compared to the five Repli-seq data sets (bottom left). b, Boxplots for the same data from a are also shown.
Extended Data Figure 4
Extended Data Figure 4. Increasing the resolution of Hi-C analysis increases the number of called TAD boundaries and alignment with replication domain boundaries.
a, Histograms of TAD sizes for original IMR90 calls (bottom, ref. 8) versus calls made using higher resolution IMR90 Hi-C data with 40 kb (middle) and 20 kb (top) directionality index bin sizes. b, An example region of the IMR90 replication timing profile (grey) is shown with TTR-present and TTR-absent replication domain boundaries indicated by vertical blue lines. Directionality index plots for each of the Hi-C data sets from panel a are shown across the same region with the 5′ TAD boundaries (start) indicated by solid red lines and the 3′ TAD boundaries (end) indicated by dotted black lines. c, Overlap of TAD boundaries using original or higher resolution data with TTR-present (black) or all (grey) replication domain boundaries (top left) is shown within 175 kb. The reciprocal comparison is shown below. The percentage of replication domain boundaries that overlap with TAD boundaries increases when additional TAD boundaries are identified using higher resolution data, while the percentage of TAD boundaries that overlap with replication domain boundaries is unchanged. The overlap in each case is significant (P < 10−77) relative to overlap with random positions (right).
Extended Data Figure 5
Extended Data Figure 5. Alignment of replication domain and TAD boundaries.
a, IMR90 (original resolution in grey, high resolution with 20 kb bins in black) or H1 hESC (red) TAD boundary frequency for regions with the same replication timing in both cell lines. b, TAD boundary alignment to IMR90 replication domain boundary subsets based on IMR90 TTR properties. Random alignment was calculated based on the distribution of timing values within each subset. c, TAD boundary frequency for regions with different replication timing in IMR90 and H1 hESCs. d, Alignments for IMR90 replication domain boundaries as in b using TTR properties in all cell types. e, IMR90 TAD boundary probability density across small IMR90 TTRs that either do not (top) or do (bottom) coincide with larger TTRs (timing difference > 1.5) in other cell types. f, Histograms show the distribution of probability densities from Fig. 2c for TAD boundaries within 2 Mb of TTR-present (top) and TTR-absent (bottom) IMR90 replication domain boundaries (blue) or an equal number of random positions (grey). Vertical red lines mark the mean and three standard deviations from the mean random density. g, Percentages of TTR-present (top) and TTR-absent (bottom) IMR90 replication domain boundaries that aligned to TAD boundaries as a function of distance (red) are plotted with a random control (black). The significance of alignment is also shown (grey). The vertical dashed line indicates the distance at which alignment is most significant, while the vertical solid line indicates the distance at which alignment is most different from the control.
Extended Data Figure 6
Extended Data Figure 6. Replication-timing shifts at chromosome rearrangements are restrained by TAD boundaries.
a, Distribution of early (blue) and late (grey) TTR borders within aligned, adjacent TADs for all TTRs (left), or TTRs that start in early (centre, timing > 0.5) or middle (right, timing ≤ 0.5) S phase. The right boundary of TAD 0 is nearest each early border and TADs 1–3 are neighbouring TADs in the direction of the timing transition (earlier to later from left to right). b, Histogram of replication domain sizes. c, Plots as in Fig. 2e show replication timing (red) across four rearrangement points (vertical green lines) that juxtapose otherwise early- and late-replicating regions on human chromosome 21 overlaid on the normal profile (black). Secondary rearrangement points (vertical grey lines) that joined regions with similar replication timing are also shown. The TAD boundary (vertical blue line) nearest to the fusion point is also indicated. In the examples at the top and bottom left, the shift forms a new TTR with its early border coinciding with the nearest TAD boundary. As in the other examples, the shift in the bottom right plot also does not extend beyond the nearest detected TAD boundary, but the TTR formed does not align with a called TAD boundary.
Extended Data Figure 7
Extended Data Figure 7. Alignment of TTR-present replication domain boundaries to chromatin features.
Plots as in Fig. 3a, b show probability density functions (green curves) for selected chromatin features within 4 Mb of aligned replication domain boundaries in the indicated cell types. A vertical grey line indicates the replication domain boundary position and a vertical green line indicates the average position of maximum enrichment in replicate data sets, which is listed at the top left of each graph. Horizontal solid and dashed lines indicate the mean and three standard deviations from the mean probability density of each feature about an equal number of random positions.
Extended Data Figure 8
Extended Data Figure 8. Alignment of TAD boundaries to chromatin features.
a, Approach for distinguishing local TAD boundary enrichment from differential enrichment among TADs in an aggregate analysis. Before averaging, TADs were oriented such that the analysed feature exhibited a decreasing density from left to right. b, c, SINE-B1 (b) or SINE-Alu (c) density across averaged TAD boundaries oriented (red) as in a or not (grey) are plotted (top). Individual TAD boundaries are shown below with a similar fraction exhibiting local enrichment indicated by blue brackets. d, Average CTCF peak intensity across boundaries from b (top) and c (bottom). e, Degree of local feature enrichment at TAD boundaries (see Methods).
Extended Data Figure 9
Extended Data Figure 9. Method comparison and summary of transcription factor prediction model.
a, Precision (true positives / (true positives + false positives)), recall (true positives / (true positives + false negatives)), and the f-measure (2 × (precision × recall) / (precision + recall)) are plotted for k-means (top) or hierarchical (bottom) clustering of raw transcription factor composition data or of data mapped on reduced dimensions by principal component analysis or with denoising autoencoders (labelled as PCA and dAE x-dimensions, respectively). The metrics for each label were averaged and weighted by the number of true instances to account for label imbalance, thus the f-measure can give scores that are not between precision and recall. Clusters of low layer representations were as good as those of high layer representations. Since the first dAE layer is a nonlinear principal component analysis, we can say that higher layers of the stack do not affect the ability to separate the data while reducing dimensionality. b, Sums of the L2 distances between data points and the centre of their assigned k-means cluster are plotted. This is the same measure that was minimized by the clustering algorithm. The labels on the y axis follow the convention used in a. Clustering the representations after each layer showed how the data became more and more separable at higher layers. c, The plot shows the distribution of the sum of the normalized transcription factor profile signal for each class assigned by the model.

References

    1. Wright ML, Grützner F, Seligmann H. DNA Replication Current Advances. 2011.
    1. Hiratani I, et al. Global reorganization of replication domains during embryonic stem cell differentiation. PLoS Biol. 2008;6:e245. - PMC - PubMed
    1. Hansen RS, et al. Sequencing newly replicated DNA reveals widespread plasticity in human replication timing. Proc. Natl Acad. Sci. USA. 2010;107:139–144. - PMC - PubMed
    1. Ryba T, et al. Evolutionarily conserved replication timing profiles predict long-range chromatin interactions and distinguish closely related cell types. Genome Res. 2010;20:761–770. - PMC - PubMed
    1. Yaffe E, et al. Comparative analysis of DNA replication timing reveals conserved large-scale chromosomal architecture. PLoS Genet. 2010;6:e1001011. - PMC - PubMed

Publication types