. 2014 Nov 20:5:5274.
doi: 10.1038/ncomms6274.

Dynamic analyses of alternative polyadenylation from RNA-seq reveal a 3'-UTR landscape across seven tumour types

Affiliations

Dynamic analyses of alternative polyadenylation from RNA-seq reveal a 3'-UTR landscape across seven tumour types

Zheng Xia et al. Nat Commun. .

Abstract

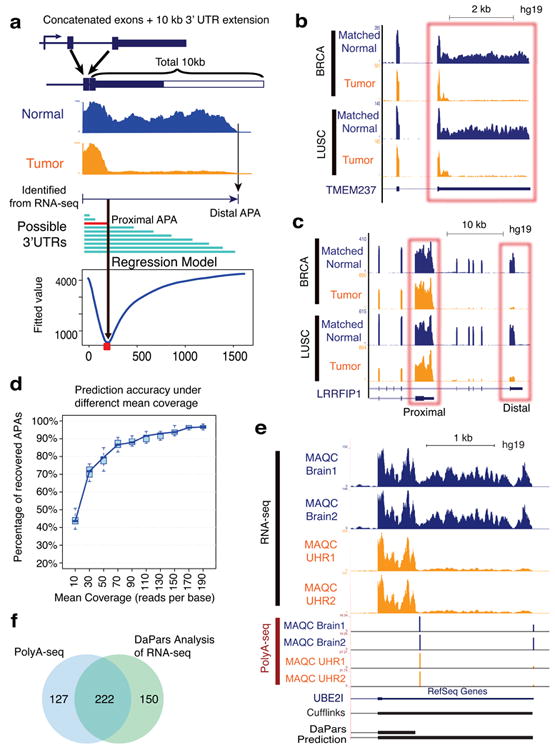
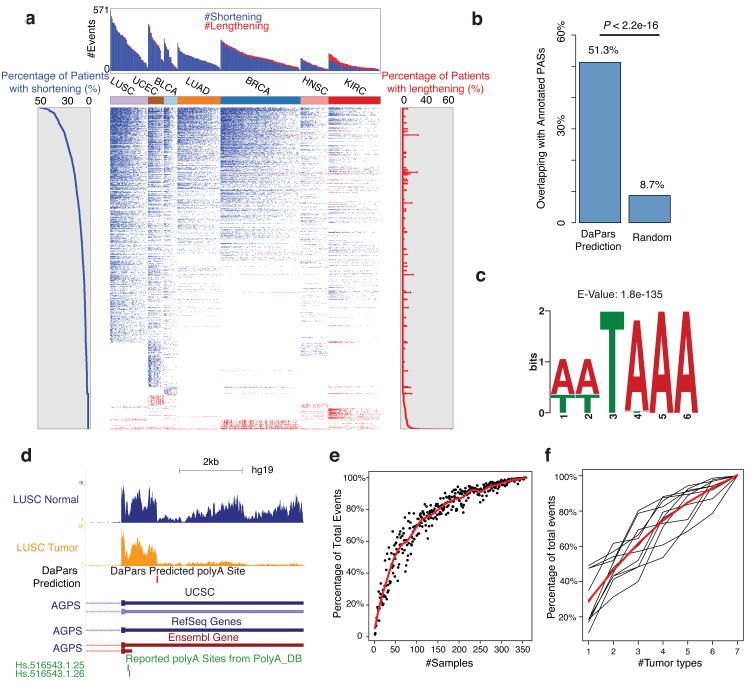
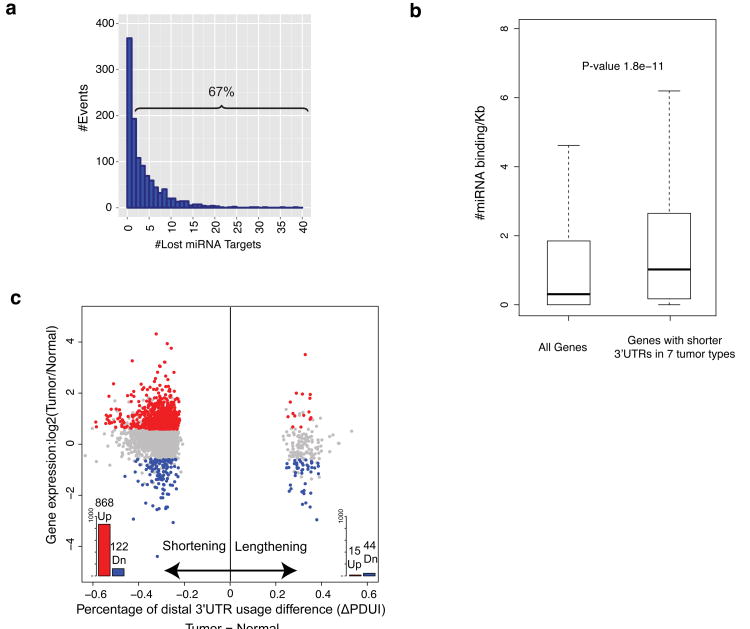
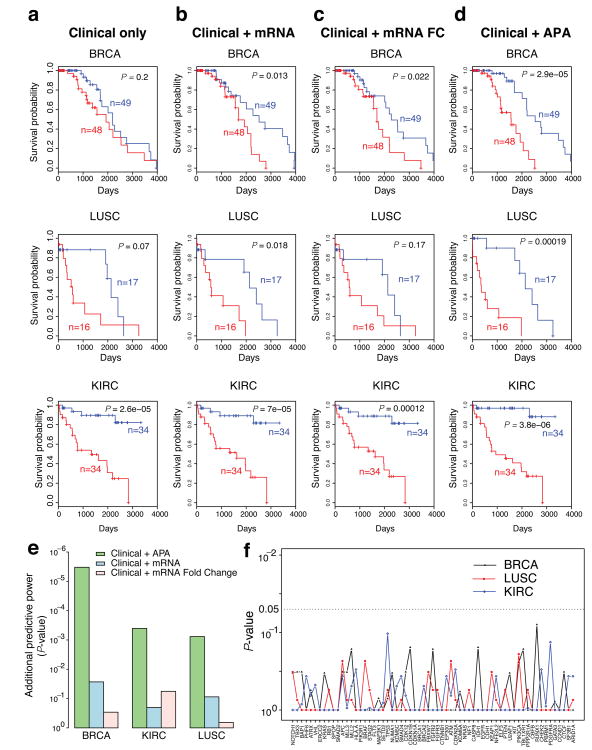
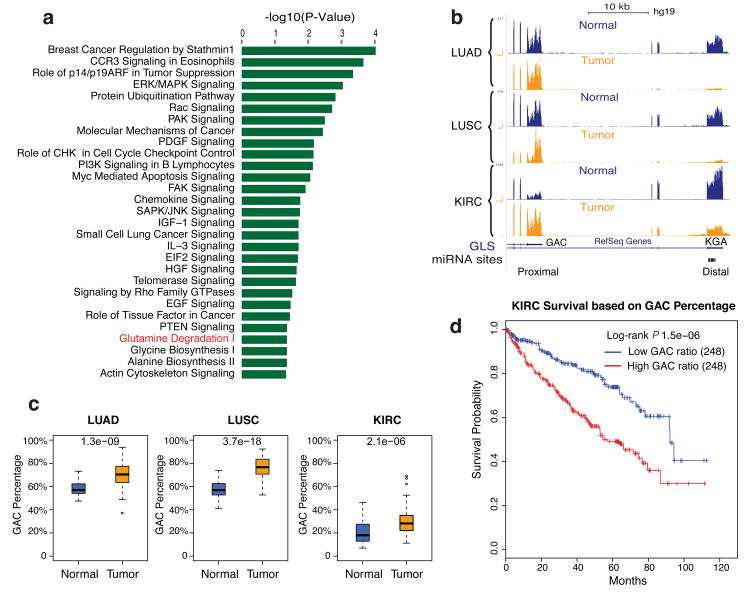
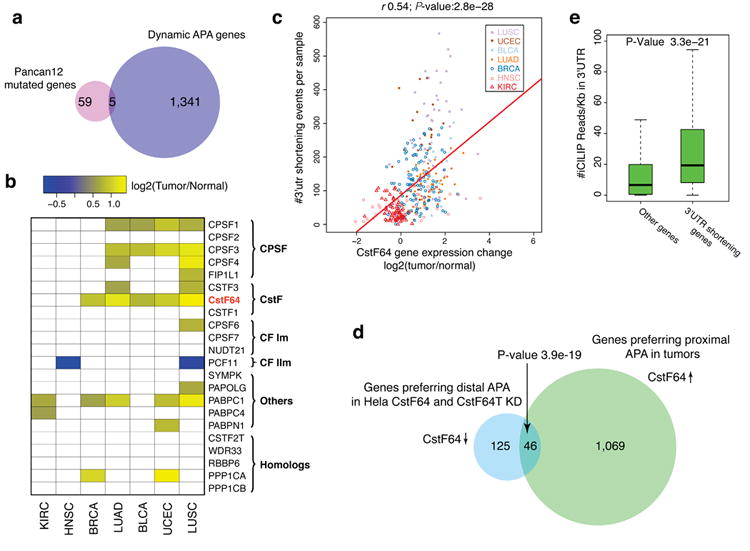
Alternative polyadenylation (APA) is a pervasive mechanism in the regulation of most human genes, and its implication in diseases including cancer is only beginning to be appreciated. Since conventional APA profiling has not been widely adopted, global cancer APA studies are very limited. Here we develop a novel bioinformatics algorithm (DaPars) for the de novo identification of dynamic APAs from standard RNA-seq. When applied to 358 TCGA Pan-Cancer tumour/normal pairs across seven tumour types, DaPars reveals 1,346 genes with recurrent and tumour-specific APAs. Most APA genes (91%) have shorter 3'-untranslated regions (3' UTRs) in tumours that can avoid microRNA-mediated repression, including glutaminase (GLS), a key metabolic enzyme for tumour proliferation. Interestingly, selected APA events add strong prognostic power beyond common clinical and molecular variables, suggesting their potential as novel prognostic biomarkers. Finally, our results implicate CstF64, an essential polyadenylation factor, as a master regulator of 3'-UTR shortening across multiple tumour types.


Figures

Figure 1
Figure 1. Overview of the DaPars Algorithm and its Performance Evaluation
(a) Diagram depicts the DaPars algorithm for the identification of dynamic APA between tumor and normal samples. The top panel shows RNA-seq coverage on exons with 10kb extension without any prior knowledge of APA sites. The distal APA site is inferred directly from the combined RNA-seq data of tumor and normal tissues (middle panels). The Y-axis of the bottom panel is the fitted value of our regression model and the locus with the minimum fitted value (red point below vertical arrow) corresponds to the predicted proximal APA site (red horizontal bar). (b) An example of DaPars identified dynamic APA from the TCGA RNA-seq data. The shorter 3′ UTR of TMEM237 is preferred in BRCA and LUSC tumors. (c) Another example of dynamic APA, here the distal APA of LRRFIP1 is nearly absent in both BRCA and LUSC tumors while the proximal APA is unchanged. (d) A simulation study to demonstrate DaPars performance. The percentage of recovered APA events is plotted against different sequencing coverage. The quantile box shows the variation of DaPars prediction based on 1000 simulated events. The black line in each box is the median recovery rate. (e) An example of dynamic APA between MAQC UHR and BRAIN detected by both DaPars analysis of RNA-seq and PolyA-seq. The 3 bottom tracks are the RefSeq gene structure, Cufflinks prediction and DaPars prediction. (f) Venn diagram comparison between PolyA-seq and DaPars analysis of RNA-seq based on the same MAQC UHR and BRAIN samples.
Figure 2
Figure 2. Broad Shortening of 3′ UTRs across 7 TCGA Tumor Types
(a) The central heatmap shows genes (rows) undergoing 3′ UTR shortening (blue) or lengthening (red) in each of the 358 tumors (columns) compared to matched normal tissues across 7 tumor types. The upper histogram shows the number of APA events per tumor. The side histograms show the percentage of tumors with 3′ UTR shortening (left) or lengthening (right) for each APA gene. (b) Bar plots show the percentages of DaPars predicted APAs and randomly selected APAs from 3′ UTR regions overlapping with annotated APAs from four databases (Refseq, UCSC, ENSEMBL and PolyA_DB). The P-value was calculated by t-test using 50x bootstrapping of data. (c) MEME identifies the canonical polyA motif AATAAA with very significant E-value (1.8e-135) from the upstream (-50bp) of the proximal polyA sites predicted by DaPars. (d) An example of DaPars predicted novel polyA site (red bar) in a LUSC tumor that is far away from any annotated polyA sites. (e) Saturation analysis of APA events by adding more samples. Each point is a random subset of samples of various smaller sizes. All the points were fitted by a smoothed read line. (f) Saturation analysis by adding more tumor types. Each grey line represents a random ordering of 7 tumor types and red curve is the fitting line. The percentage of dynamic APA events increased with the number of tumor types.
Figure 3
Figure 3. Genes with Shorter 3′ UTRs in Tumors are Prone to be Up-regulated
(a) Number of genes losing miRNA-binding sites due to the shortening of their 3′ UTRs. Here we selected miRNA bindings sites predicted by both TargetScanHuman V6.2, and miRanda, as a more conservative list of miRNA targets. Number in the bracket represents the percentage of genes losing at least 1 miRNA binding site. (b) Genes with shorter 3′ UTRs in tumors have greater miRNA binding sites density in 3′ UTR region than all RefSeq genes. We used RefSeq gene models for all the calculations regardless of the APA detection. The Y-axis is the number of miRNA binding sites normalized by 3′ UTR length (per Kb). The P-value was calculated by t-test. (c) For genes with shorter 3′ UTRs in tumors, their fold-change expression between tumors and normal tissues are plotted against their ΔPDUI values. All isoforms of the same gene were combined for the expression measurement. The genes significantly up- or down-regulated in tumors are shown in red and blue, respectively, which were identified by paired t-test with Benjamini-Hochberg (BH) false discovery rate at 5%. Accordingly, the red and blue bar plots indicate the number of up and down regulated genes, respectively.
Figure 4
Figure 4. Prognostic Power of Dynamic APA Events
(a-d) Kaplan-Meier survival plots for high (red line) and low (blue line) risk groups separated by clinical only (a), clinical with mRNA expression (b), clinical with tumor-vs-normal mRNA expressions fold change (c) and clinical with dynamic APAs (d). P-value was calculated by log-rank test. (e) Additional prognostic power of APA, mRNA expression and mRNA tumor-vs-normal expression fold change beyond clinical variables. The P-value is calculated by likelihood-ratio test. (f) No correlation between risk groups separated by APA-clinical models and mutation profiles of significantly mutated genes (SMG). The dotted vertical line represents the P-value (Mann–Whitney test) cutoff of 0.05. All SMG P-values are below this cutoff and thus are not significant.
Figure 5
Figure 5. Pathway Analysis
(a) Significantly enriched (P-value < 0.05; Fisher's exact test) Ingenuity canonical pathways in the 1,346 dynamic APA events. (b) GLS has a significant 3′ UTR shift from KGA long isoform in normal to GAC short isoform in tumor. (c) GAC percentages are significantly higher in LUAD, LUSC and KIRC tumors. The P-value in each box was calculated by paired t-test. (d) Kaplan-Meier survival plot of two KIRC tumor groups stratified by the GAC ratios with equal patient number in each group. P-value was calculated by log-rank test.
Figure 6
Figure 6. Potential Mechanisms for APA Regulation during Tumorigenesis
(a) Only 5 genes are in common between genes undergoing dynamic APA and genes significantly mutated in Pancan12 tumor types. (b) Heatmap of gene expression fold-change of known polyadenylation factors. Each rectangle represents the mean log2 fold change between tumor and matched normal tissues of one factor in one tumor type. A factor is considered differentially expressed if the false discovery rate from edgeR is less than 0.05 and the mean absolute fold change is greater than 1.5. Yellow and blue boxes indicate the significantly up-regulated and down-regulated genes, respectively. White boxes are non-significant genes. (c) Correlation between CstF64 expression fold-change and number of 3′ UTR shortening events per sample. Each point represents a patient sample across 7 tumor types. X-axis is the CstF64 log2 fold change between tumors and matched normal tissues. Y-axis is the number of shortening events per sample. Spearman's correlation coefficient (0.54) and P-value (2.8e-28) are indicated on the top. (d) Venn diagram comparison between genes preferring proximal APAs in tumor with higher expression of CstF64 and genes preferring distal APA in Hela cells with knockdown of CstF64 and CstF64T. (e) Genes with 3′ UTR shortening in tumors have more CstF64 iCLIP data derived from HeLa cells than background (P-value 3.3e-21 by t-test).

References

    1. Elkon R, Ugalde AP, Agami R. Alternative cleavage and polyadenylation: extent, regulation and function. Nature reviews Genetics. 2013;14:496–506. - PubMed
    1. Sandberg R, Neilson JR, Sarma A, Sharp PA, Burge CB. Proliferating cells express mRNAs with shortened 3′ untranslated regions and fewer microRNA target sites. Science. 2008;320:1643–1647. - PMC - PubMed
    1. Derti A, et al. A quantitative atlas of polyadenylation in five mammals. Genome research. 2012;22:1173–1183. - PMC - PubMed
    1. Tian B, Hu J, Zhang H, Lutz CS. A large-scale analysis of mRNA polyadenylation of human and mouse genes. Nucleic acids research. 2005;33:201–212. - PMC - PubMed
    1. Barreau C, Paillard L, Osborne HB. AU-rich elements and associated factors: are there unifying principles? Nucleic acids research. 2005;33:7138–7150. - PMC - PubMed

Publication types

MeSH terms